Unlocking Biofuel and Bioproduction: The Critical Link Between Central Carbon Metabolism and Lipid Accumulation in Yeast
This comprehensive review examines the intricate relationship between central carbon metabolism (CCM) and lipid biosynthesis in yeast, a cornerstone of metabolic engineering for biofuels, oleochemicals, and model disease studies.
Unlocking Biofuel and Bioproduction: The Critical Link Between Central Carbon Metabolism and Lipid Accumulation in Yeast
Abstract
This comprehensive review examines the intricate relationship between central carbon metabolism (CCM) and lipid biosynthesis in yeast, a cornerstone of metabolic engineering for biofuels, oleochemicals, and model disease studies. We first establish the foundational pathways of glycolysis, TCA cycle, and pentose phosphate pathway, detailing their roles in providing precursors (acetyl-CoA, NADPH) and energy for lipid accumulation. We then explore advanced methodological approaches, including 'omics' technologies and synthetic biology tools, for manipulating these pathways. The article provides actionable troubleshooting guidance for common challenges in strain engineering, such as redox imbalance and growth defects. Finally, we validate and compare key yeast platforms (S. cerevisiae, Y. lipolytica, R. toruloides) for lipid production, analyzing their metabolic and industrial suitability. This synthesis provides researchers and bioprocess developers with a strategic framework for engineering high-yield yeast strains.
The Metabolic Blueprint: How Yeast Central Carbon Metabolism Fuels Lipid Biosynthesis
Central Carbon Metabolism (CCM) is the network of biochemical reactions that process carbon sources to generate energy, reducing power, and biosynthetic precursors. In the context of yeast research, particularly concerning lipid accumulation, the interplay between glycolysis, the tricarboxylic acid (TCA) cycle, and the pentose phosphate pathway (PPP) dictates the metabolic fate of carbon, channeling it towards either energy production or lipid biosynthesis. This guide details the core pathways, experimental approaches, and reagents pivotal for investigating CCM-driven lipid accumulation in yeast.
Core Pathways and Metabolic Flux
Glycolysis (Embden-Meyerhof-Parnas Pathway)
Glycolysis converts glucose into two pyruvate molecules, yielding ATP and NADH. In Saccharomyces cerevisiae, under high glycolytic flux (e.g., in Crabtree-positive conditions), pyruvate is primarily diverted towards fermentation, producing ethanol and regenerating NAD⁺. This shunting away from mitochondrial oxidation is a key consideration when studying lipid accumulation, as acetyl-CoA for lipid synthesis must then be generated via alternative routes like the ATP-citrate lyase or acetyl-CoA synthetase pathways.
Tricarboxylic Acid (TCA) Cycle
The TCA cycle in mitochondria fully oxidizes acetyl-CoA to CO₂, generating NADH, FADH₂, and GTP. For lipogenesis, a truncated, cytosolic-branch "glyoxylate shunt" can operate, bypassing decarboxylation steps to preserve carbon skeletons. Yeast engineered for lipid overproduction often show modulated TCA cycle activity to supply citrate for cytosolic acetyl-CoA production.
Pentose Phosphate Pathway (PPP)
The oxidative branch of PPP generates NADPH, essential for fatty acid biosynthesis. The non-oxidative branch produces ribose-5-phosphate for nucleotide synthesis. The NADPH/NADP⁺ ratio is a critical regulator, directly linking PPP activity to lipid accumulation capacity.
Table 1: Key Metabolite and Cofactor Outputs of CCM Pathways in Yeast
| Pathway | Primary Input | Net Energy (ATP) | Reducing Equivalents | Key Biosynthetic Precursor | Relevance to Lipid Accumulation |
|---|---|---|---|---|---|
| Glycolysis | 1 Glucose | 2 ATP (net) | 2 NADH | Pyruvate, Dihydroxyacetone-P | Provides glycerol backbone & acetyl-CoA source. |
| TCA Cycle | 1 Acetyl-CoA | 1 GTP (≈ATP) | 3 NADH, 1 FADH₂ | Oxaloacetate, α-Ketoglutarate | Supplies citrate for cytosolic acetyl-CoA; cycle intermediates drained for anaplerosis. |
| PPP (Oxidative) | Glucose-6-P | - | 2 NADPH | Ribose-5-P | Primary source of NADPH for fatty acid synthase. |
Experimental Protocols for Investigating CCM in Yeast Lipid Research
Protocol 1:Metabolic Flux Analysis using ¹³C-Glucose Tracers
Objective: Quantify flux distribution through glycolysis, PPP, and TCA cycle. Methodology:
- Culture & Labeling: Grow yeast strain in minimal medium with [1-¹³C]glucose or [U-¹³C]glucose as sole carbon source to mid-exponential phase.
- Metabolite Quenching & Extraction: Rapidly filter culture and quench in 60% cold aqueous methanol. Extract intracellular metabolites using a 40:40:20 methanol:acetonitrile:water mixture at -20°C.
- GC-MS Analysis: Derivatize metabolites (e.g., methoximation and silylation). Analyze using Gas Chromatography-Mass Spectrometry (GC-MS).
- Flux Calculation: Use software (e.g., INCA, 13C-FLUX) to model flux distribution by fitting ¹³C labeling patterns in key metabolites (e.g., amino acids, glycolytic intermediates) to a metabolic network model.
Protocol 2:Enzymatic Assay for NADPH/NADP⁺ Ratio
Objective: Determine the redox state of the NADP(H) pool, indicative of PPP activity. Methodology:
- Extraction: Rapidly harvest cells by centrifugation, immediately extract cofactors using hot (95°C) bicarbonate buffer (pH 10) or cold acidic/neutral buffers for NADP⁺ and NADPH respectively.
- Enzymatic Cycling Assay: Use glucose-6-phosphate dehydrogenase (G6PDH). For total NADP(H), add sample to assay mix containing G6P and MTT tetrazolium salt. G6PDH reduces NADP⁺ to NADPH, which then reduces MTT via an intermediate electron acceptor (e.g., phenazine ethosulfate), forming a purple formazan.
- Quantification: Measure formazan absorbance at 570 nm. Use separate extracts to measure NADPH and NADP⁺ individually by selective destruction of one species (e.g., acid for NADP⁺, heat for NADPH). Calculate ratio.
Visualization of CCM Pathways and Lipid Synthesis Nodes
Diagram 1: CCM Node Map for Yeast Lipogenesis
Diagram 2: 13C MFA Experimental Pipeline
The Scientist's Toolkit: Research Reagent Solutions
Table 2: Essential Reagents for CCM and Lipid Accumulation Studies in Yeast
| Reagent/Category | Example Product/Kit | Primary Function in Research |
|---|---|---|
| Stable Isotope Tracers | [1-¹³C]Glucose, [U-¹³C]Glucose (Cambridge Isotopes) | Enable Metabolic Flux Analysis (MFA) by tracing carbon fate through CCM pathways. |
| Cofactor Assay Kits | NADP/NADPH Quantification Kit (Colorimetric, Abcam) | Measure absolute levels and ratios of NADPH/NADP⁺, a key readout of PPP activity and lipogenic capacity. |
| Enzyme Activity Assays | Glucose-6-Phosphate Dehydrogenase (G6PDH) Activity Assay Kit (Sigma-Aldrich) | Directly measure the activity of the rate-limiting enzyme of the oxidative PPP. |
| Metabolite Extraction Kits | Methanol/Acetonitrile-based extraction kits (e.g., Biocrates) | Standardized, reproducible quenching and extraction of intracellular metabolites for LC/GC-MS. |
| Fatty Acid Analysis Kits | Fatty Acid Methyl Ester (FAME) Analysis Kit (Thermo Fisher) | Convert and quantify lipids/ fatty acids from yeast lysates via GC-FID or GC-MS. |
| Yeast Genetic Tools | CRISPR/Cas9 kits for S. cerevisiae (e.g., YEASSTRACT tool) | Engineer knockout/overexpression strains of CCM enzymes (e.g., G6PDH, isocitrate dehydrogenase) to modulate flux. |
| RT-qPCR Reagents | SYBR Green master mix + primers for CCM genes (e.g., TDH, ZWF1, ICL1) | Quantify transcriptional regulation of CCM pathways in response to lipid-accumulating conditions. |
This technical whitepaper details the indispensable roles of acetyl-CoA, NADPH, and ATP as fundamental precursors and energy carriers in the lipogenic pathway of the yeast Saccharomyces cerevisiae. Framed within the broader thesis of central carbon metabolism and lipid accumulation, this guide provides a mechanistic and quantitative analysis of how the flux and regulation of these metabolites govern de novo fatty acid biosynthesis. The document integrates current research findings, presents protocols for quantifying metabolite pools, and offers visualizations of the integrated metabolic network to serve researchers and drug development professionals targeting lipid metabolism.
In Saccharomyces cerevisiae, lipid biosynthesis is a tightly regulated anabolic process that diverges from central carbon metabolism. The conversion of carbon sources (e.g., glucose) into storage and membrane lipids requires substantial metabolic investment. This process is spatially and temporally coordinated, with the cytosol as the primary site for fatty acid synthesis. The core reaction, catalyzed by the multi-enzyme fatty acid synthase (FAS) complex, is energetically expensive: Acetyl-CoA + 7 Malonyl-CoA + 14 NADPH + 14 H⁺ + 18 ATP → Palmitate (C16:0) + 7 CO₂ + 8 CoA + 14 NADP⁺ + 18 ADP + 18 Pi + 6 H₂O. The stoichiometry highlights the absolute dependence on three key components: acetyl-CoA as the primer and building block, NADPH as the reductant, and ATP as the energy currency for activation and polymerization steps. Their availability directly dictates the rate and extent of lipid accumulation, a phenotype critical in biofuels research and understanding metabolic disorders.
Deep Dive: The Three Pillars of Lipogenesis
Acetyl-CoA: The Carbon Backbone
Acetyl-CoA sits at a critical metabolic junction. In yeast cytosolic lipogenesis, acetyl-CoA is primarily generated via the ATP-citrate lyase (ACL) pathway. Pyruvate from glycolysis is decarboxylated to mitochondrial acetyl-CoA, which condenses with oxaloacetate to form citrate. Citrate is then transported to the cytosol and cleaved by ACL to regenerate acetyl-CoA and oxaloacetate.
Key Quantitative Data: Table 1: Acetyl-CoA Pool Sizes and Flux Rates in S. cerevisiae under Lipogenic Conditions
| Condition | Cytosolic Acetyl-CoA (nmol/gDW) | Mitochondrial Acetyl-CoA (nmol/gDW) | Flux to Malonyl-CoA (nmol/min/gDW) | Primary Source |
|---|---|---|---|---|
| High Glucose (Exponential) | 15-25 | 40-60 | 8-12 | ACL pathway |
| Oleate Supplementation | 5-10 | 30-50 | 2-4 | β-oxidation (peroxisomal) |
| Nitrogen Limitation | 30-50 | 20-40 | 15-25 | ACL & PDH bypass |
Experimental Protocol: Quantifying Acetyl-CoA Pools via LC-MS/MS
- Rapid Quenching: Culture samples (10 mL) are vacuum-filtered onto 0.45μm nylon membranes and immediately submerged in 10 mL of 60% (v/v) aqueous methanol at -40°C.
- Metabolite Extraction: Cell pellets are resuspended in 1 mL of extraction buffer (40:40:20 acetonitrile:methanol:water with 0.1% formic acid, -20°C). Cells are lysed via bead-beating (3 x 30s cycles, cooled on ice). The supernatant is cleared by centrifugation (15,000 x g, 10 min, -10°C).
- LC-MS/MS Analysis: Inject 5 μL onto a reverse-phase HILIC column. Use a triple-quadrupole mass spectrometer in positive MRM mode. Quantify acetyl-CoA using stable isotope-labeled internal standard (¹³C₂-acetyl-CoA). Calibrate with authentic standards (0.1-1000 nM range).
NADPH: The Reducing Powerhouse
NADPH provides the reducing equivalents required for the reduction steps in fatty acid elongation. Yeast cytosolic NADPH is primarily supplied by the oxidative pentose phosphate pathway (oxPPP) and, to a lesser extent, by cytosolic isocitrate dehydrogenase (Idp2p).
Key Quantitative Data: Table 2: NADPH Generation Flux and Contribution in S. cerevisiae
| Pathway/Enzyme | Contribution to Lipogenic NADPH (%) | Enzyme Activity (U/mg protein) | Effect of ΔMutation on Lipogenesis (% WT) |
|---|---|---|---|
| Oxidative PPP (G6PD, Zwf1p) | 60-70% | 120-150 | 30% |
| Cytosolic IDH (Idp2p) | 20-30% | 25-40 | 85% |
| Other (e.g., Ald6p) | <10% | 5-15 | 95% |
Experimental Protocol: In Vivo NADPH/NADP⁺ Ratio Assay Using Biosensors
- Strain Engineering: Transform yeast with a cytosolic-targeted, ratiometric fluorescent biosensor (e.g., SoNar or iNAP). Select transformants on appropriate dropout media.
- Live-Cell Imaging: Grow sensor strain to mid-log phase in synthetic complete medium. Mount cells on a concanavalin A-coated glass-bottom dish.
- Fluorescence Measurement: Using a dual-emission microscope, excite at 420 nm and collect emission at 485 nm (reduced state) and 520 nm (oxidized state). Calculate the ratio (F485/F520). Calibrate using 10 mM DTT (fully reduced) and 10 mM diamide (fully oxidized) in vivo.
- Perturbation: Add 200 mM glucose or 0.5 mM H₂O₂ and monitor ratio dynamics over 10 minutes.
ATP: The Energy Currency
ATP is consumed in multiple lipogenic steps: the carboxylation of acetyl-CoA to malonyl-CoA by Acetyl-CoA Carboxylase (Acc1p) and the condensation/elongation cycles catalyzed by FAS. The cellular ATP:ADP ratio reflects energy charge and directly regulates Acc1p activity (allosterically activated by citrate, inhibited by palmitoyl-CoA).
Integrated Metabolic Network and Regulation
Lipogenesis is not a linear pathway but a hub integrated with glycolysis, TCA cycle, and pentose phosphate pathways. Key regulatory nodes include:
- Acc1p: The first committed, rate-limiting step. Phosphorylated and inhibited by Snf1p (yeast AMPK) under low glucose.
- FAS Complex: Feedback inhibited by long-chain acyl-CoAs.
- Transcription Factors: Upc2p and Ecm22p regulate sterol biosynthesis genes, while Ino2p/Ino4p activate phospholipid biosynthesis genes in response in inositol/choline levels.
Integrated Pathway of Yeast Lipogenesis
The Scientist's Toolkit: Essential Research Reagents & Materials
Table 3: Key Reagents for Lipogenesis Research in Yeast
| Reagent/Material | Function/Application | Example Product/Catalog |
|---|---|---|
| [1-¹³C] or [U-¹³C] Glucose | Tracer for metabolic flux analysis (MFA) to quantify carbon flow through glycolysis, PPP, and into acetyl-CoA. | CLM-1396 (Cambridge Isotopes) |
| Methyl-¹³C Methionine | Enables tracking of the mitochondrial acetyl-CoA pool via ¹³C-label incorporation into cytosolic acetyl-CoA via the Krebs cycle. | CLM-893 |
| Acetyl-CoA Carboxylase (Acc1p) Inhibitor (e.g., Soraphen A) | Pharmacological inhibition of de novo lipogenesis to study pathway dependence and compensatory mechanisms. | HY-N6783 (MedChemExpress) |
| NADPH/NADP⁺ Fluorescent Biosensor Plasmid (e.g., pRS416-SoNar) | Real-time, in vivo monitoring of cytosolic NADPH redox status in live yeast cells. | Addgene #112159 |
| Anti-Acetyl Lysine Antibody | Detection of acetylation status of metabolic enzymes (e.g., Acc1p, IDH) which can modulate activity. | Cell Signaling #9441 |
| Palmitoyl-CoA (unlabeled & ¹³C-labeled) | Substrate for in vitro FAS assays and feedback inhibitor for studying allosteric regulation of Acc1p. | P9716 (Sigma) |
| Yeast FAS Purification Kit | Isolation of the native, multi-enzyme FAS complex for structural and kinetic studies. | N/A (Typically lab-specific protocols) |
| LC-MS/MS Metabolite Standard Kit (Acyl-CoAs, NADPH/NADP⁺) | Absolute quantification of key lipogenic metabolites from cellular extracts. | MSK-AcylCoA-1 (Cambridge Isotopes) |
Advanced Experimental Workflow: Connecting Metabolite Pools to Lipid Accumulation
Experimental Workflow for Lipogenesis Flux Analysis
Abstract This whitepaper elucidates the pivotal regulatory roles of pyruvate, acetyl-CoA, and citrate in central carbon metabolism, channeling flux towards lipid accumulation in yeast. Within the broader thesis of metabolic engineering for biofuel and oleochemical production, understanding the control exerted at these nodes is paramount. We provide a technical dissection of their metabolic integration, quantitative flux data, and experimental protocols for manipulating these checkpoints to enhance lipid yields.
In Saccharomyces cerevisiae and oleaginous yeasts like Yarrowia lipolytica, lipid accumulation is intrinsically linked to central carbon metabolism. The glycolytic endpoint, pyruvate, and the mitochondrial metabolites acetyl-CoA and citrate serve as critical branch points. Their partitioning between catabolic oxidation and anabolic lipogenesis dictates cellular lipid content. This document details the regulation of these gatekeepers, providing a resource for researchers aiming to rewire metabolism for enhanced lipid production.
The Metabolic Gatekeepers: Function and Regulation
Pyruvate: The Glycolytic Junction
Pyruvate sits at the intersection of glycolysis, the TCA cycle, and cytosolic acetyl-CoA formation. Its fate is determined by a series of key enzymes:
- Pyruvate Dehydrogenase (PDH): Irreversibly converts pyruvate to acetyl-CoA within mitochondria, committing carbon to energy production or, via citrate, to lipids.
- Pyruvate Carboxylase (PYC): Anaplerotically converts pyruvate to oxaloacetate (OAA), replenishing TCA cycle intermediates crucial for citrate synthesis.
- Acetaldehyde/Ethanol Pathways: In S. cerevisiae, pyruvate can be diverted to ethanol, a major competitor for carbon flux.
Quantitative Data: Pyruvate Node Flux Distribution Table 1: Representative carbon flux distribution from pyruvate under different nutritional states in yeast (data from ¹³C-MFA studies).
| Yeast Strain / Condition | Flux to PDH (%) | Flux to PYC (%) | Flux to Acetaldehyde/Ethanol (%) | Reported Lipid Content (% CDW) |
|---|---|---|---|---|
| S. cerevisiae (Glucose, Excess N) | 15-25 | 5-10 | 60-75 | <10 |
| Y. lipolytica (Glucose, N-Limited) | 40-60 | 20-30 | <5 | 30-40 |
| Engineered S. cerevisiae (PDH bypass) | N/A | 15-20 | 20-30 | 20-25 |
Acetyl-CoA: The Two-Compartment Precursor
Acetyl-CoA is the direct building block for fatty acid synthesis but is compartmentalized.
- Mitochondrial Acetyl-CoA: Generated by PDH; condenses with OAA to form citrate.
- Cytosolic Acetyl-CoA: Required for fatty acid synthase (FAS). In non-oleaginous yeast, it is primarily produced via ATP-citrate lyase (ACL) from citrate or by acetyl-CoA synthetase (ACS) from acetate.
Citrate: The Mitochondrial Export Signal
Citrate is the key metabolite linking mitochondria to lipogenesis.
- In Oleaginous Yeasts: Under nitrogen limitation, AMP deaminase activity lowers AMP, inhibiting isocitrate dehydrogenase. This causes citrate accumulation and export to the cytosol via the mitochondrial citrate carrier (CIC).
- Cytosolic Cleavage: ACL cleaves citrate into cytosolic acetyl-CoA and OAA, providing both the carbon precursor and the NADPH (via malic enzyme acting on OAA-derived malate) for fatty acid synthesis.
Quantitative Data: Metabolite Pool Sizes Under Lipid-Accumulating Conditions Table 2: Changes in key metabolite concentrations (normalized intracellular levels) during the shift from growth to lipid accumulation phase.
| Metabolite | Growth Phase (N-Replete) | Lipid Accumulation Phase (N-Limited) | Fold Change |
|---|---|---|---|
| Citrate | 1.0 | 8.5 - 12.0 | 8-12x |
| Mitochondrial Acetyl-CoA | 1.0 | 1.5 - 2.5 | ~2x |
| Cytosolic Acetyl-CoA | 1.0 | 4.0 - 6.0 | 4-6x |
| AMP | 1.0 | 0.1 - 0.3 | 0.1-0.3x |
Experimental Protocols for Key Investigations
Protocol: MeasuringIn VivoFlux at the Pyruvate Node using ¹³C Tracer Analysis
Objective: Quantify flux distribution through PDH, PYC, and pyruvate decarboxylase (PDC). Method:
- Culture & Labeling: Grow yeast in controlled bioreactors. During mid-exponential phase, switch feed to a defined medium with [1-¹³C]glucose or [U-¹³C]glucose.
- Quenching & Extraction: Rapidly quench metabolism (60% methanol -40°C). Extract intracellular metabolites via cold methanol/chloroform/water.
- GC-MS Analysis: Derivatize metabolites (e.g., amino acids from protein hydrolysate). Analyze by GC-MS. Key mass isotopomer distributions (MIDs) of alanine (pyruvate proxy), glutamate (TCA proxy), and aspartate (OAA proxy) are collected.
- Flux Calculation: Use software (e.g., INCA, 13CFLUX2) to fit the experimental MIDs to a metabolic network model and compute precise metabolic fluxes.
Protocol: Assessing Citrate-Acetyl-CoA Shunt Activity
Objective: Determine the contribution of ACL to cytosolic acetyl-CoA pool. Method:
- Genetic Manipulation: Construct ACL knockdown/knockout or overexpression strains.
- Pulse Labeling: Use [2-¹³C]acetate, which feeds directly into cytosolic acetyl-CoA via ACS, and [U-¹³C]glucose, which labels citrate-derived acetyl-CoA.
- Targeted Analysis: After short pulses, extract lipids and hydrolyze to fatty acids. Analyze ¹³C labeling patterns in palmitate via GC-MS.
- Interpretation: The fractional ¹³C enrichment in fatty acids from [U-¹³C]glucose versus [2-¹³C]acetate directly reflects the relative contribution of the citrate shunt.
Visualization of Metabolic Pathways and Control
Diagram 1: Metabolic Network of Gatekeepers and Lipid Synthesis
The Scientist's Toolkit: Key Research Reagent Solutions
Table 3: Essential reagents and materials for studying metabolic gatekeepers in yeast.
| Reagent/Material | Function/Application | Example Vendor/Product |
|---|---|---|
| [1-¹³C]Glucose, [U-¹³C]Glucose | Stable isotope tracers for Metabolic Flux Analysis (MFA) to quantify pathway fluxes. | Cambridge Isotope Laboratories |
| GC-MS System & Columns | Analysis of mass isotopomer distributions in metabolites and fatty acids. | Agilent, Thermo Fisher Scientific |
| Quenching Solution (60% Methanol, -40°C) | Immediate halting of cellular metabolism for accurate metabolomics. | Prepared in-lab; requires ultra-cold bath. |
| Chloroform-Methanol-Water Solvent System | Extraction of intracellular polar metabolites and lipids for separate analysis. | Modified Bligh & Dyer protocol. |
| Yeast Nitrogen Base w/o Amino Acids | Defined minimal medium for precise control of carbon and nitrogen sources. | Formedium, Sigma-Aldrich |
| ATP Citrate Lyase (ACL) Activity Assay Kit | Colorimetric/fluorimetric measurement of ACL enzyme activity in cell lysates. | BioVision, Sigma-Aldrich |
| Acetyl-CoA Assay Kit (Fluorometric) | Quantification of acetyl-CoA levels in mitochondrial vs. cytosolic fractions. | Abcam, Cell Signaling Technology |
| CRISPR-Cas9 Yeast Editing System | Targeted gene knockout/overexpression to manipulate gatekeeper enzymes. | Addgene (plasmids), Synthego (gRNAs) |
The study of central carbon metabolism and lipid accumulation in yeast (Saccharomyces cerevisiae and oleaginous species like Yarrowia lipolytica) is a cornerstone of fundamental biochemistry and industrial biotechnology. A critical layer of control lies at the transcriptional level, where conserved signaling pathways sense extracellular nutrient status and orchestrate a metabolic shift between respiration/fermentation and lipid biosynthesis. This whitepaper details the mechanisms of two pivotal pathways: the yeast Snf1/AMPK pathway and the SREBP (Sterol Regulatory Element-Binding Protein) pathway, highlighting their role as central integrators.
The Snf1/AMPK Pathway: Energy Deprivation Sensor
The Snf1 kinase complex is the yeast homolog of mammalian AMP-activated protein kinase (AMPK), a primary sensor of low cellular energy (high AMP/ATP ratio) and glucose limitation.
2.1 Core Mechanism & Transcriptional Targets Upon glucose depletion, Snf1 is activated via phosphorylation by upstream kinases (Sak1, Tos3, Elm1). Active Snf1 directly phosphorylates transcriptional repressors and activators:
- Mig1: Phosphorylation by Snf1 triggers its nuclear export and inactivation, derepressing genes for alternative carbon source utilization (e.g., SUC2, GAL genes).
- Cat8 and Sip4: Snf1 phosphorylation activates these transcription factors, inducing genes for gluconeogenesis and the glyoxylate cycle.
- Lipid Metabolism Integration: Snf1 activity suppresses lipid anabolism and promotes lipid turnover. It inactivates acetyl-CoA carboxylase (Acc1), the rate-limiting enzyme for malonyl-CoA synthesis, via direct phosphorylation, thus downregulating de novo fatty acid synthesis during energy stress.
2.2 Quantitative Data Summary Table 1: Key Snf1-Mediated Regulatory Events in Saccharomyces cerevisiae
| Target | Effect of Snf1 Phosphorylation | Metabolic Consequence | Reported Fold-Change in Gene Expression/Activity* |
|---|---|---|---|
| Mig1 | Nuclear export, inactivation | Derepression of gluconeogenic genes | SUC2 expression: ↑ 50-100 fold (upon glucose shift) |
| Acc1 (enzyme) | Direct inhibition of activity | Reduced malonyl-CoA production | Acc1 activity: ↓ ~70% in vitro |
| Cat8 | Activation, nuclear localization | Induction of glyoxylate/TCA cycle genes | ICL1 expression: ↑ 20-30 fold |
| Oleic Acid Utilization | Activates Oaf1/Pip2 complex | Promotion of fatty acid β-oxidation | POX1 expression: ↑ 10-15 fold |
Values are approximate and based on typical experimental conditions (e.g., shift from 2% to 0.05% glucose).
2.3 Experimental Protocol: Monitoring Snf1-Dependent Gene Regulation
- Objective: Quantify expression of Snf1-target genes (e.g., SUC2) under varying glucose conditions in wild-type vs. snf1Δ mutant.
- Protocol:
- Strains & Growth: Grow wild-type and snf1Δ strains in rich medium with 2% glucose to mid-log phase.
- Glucose Shift: Harvest cells from high glucose. Resuspend half in fresh medium with 2% glucose (repressed condition) and half in 0.05% glucose (derepressed condition). Incubate for 60-90 minutes.
- RNA Extraction & qRT-PCR: Quench cultures, extract total RNA, and synthesize cDNA. Perform quantitative PCR (qPCR) using primers for SUC2 and a housekeeping gene (e.g., ACT1).
- Analysis: Calculate relative expression using the ΔΔCt method. SUC2 induction will be robust in wild-type cells upon glucose depletion but absent or attenuated in snf1Δ.
Diagram 1: Snf1 pathway integrates low glucose status with metabolism.
The SREBP Pathway: Sterol & Lipid Homeostasis Sensor
The SREBP pathway, conserved from fungi to humans, primarily responds to sterol depletion but is also a key integrator of lipid and nitrogen status, especially in oleaginous yeasts.
3.1 Core Mechanism in Yarrowia lipolytica In mammalian cells and many fungi, SREBPs are membrane-bound transcription factors. Under low sterol conditions:
- Proteolytic Activation: The SREBP cleavage-activating protein (SCAP) escorts SREBP from the ER to the Golgi.
- Cleavage: Sequential proteolysis by Site-1 and Site-2 proteases (S1P, S2P) releases the N-terminal transcription factor domain.
- Nuclear Translocation: The soluble SREBP domain translocates to the nucleus and activates genes for sterol biosynthesis (e.g., HMG1, ERG1) and fatty acid synthesis (e.g., ACC1, FAS1).
3.2 Quantitative Data Summary Table 2: SREBP-Mediated Gene Regulation in Response to Sterol Depletion
| Organism | Condition (Trigger) | Target Gene Class | Example Gene | Reported Induction Fold* |
|---|---|---|---|---|
| Y. lipolytica | Sterol depletion (e.g., Lovastatin) | Sterol Biosynthesis | HMG1 | ↑ 5-10 fold |
| Y. lipolytica | Nitrogen limitation (high C/N) | Fatty Acid Synthase | FAS1 | ↑ 3-8 fold |
| Mammalian Cells | Sterol depletion (LPDS) | LDL Receptor | LDLR | ↑ 50-100 fold |
| S. cerevisiae (SREBP homologs) | Hypoxia/Heme deficiency | Sterol Uptake | AUS1 | ↑ 15-20 fold |
LPDS: Lipoprotein-deficient serum. Induction varies by system and trigger.
3.3 Experimental Protocol: Monitoring SREBP Proteolytic Activation
- Objective: Assess SREBP cleavage via immunoblotting in response to sterol depletion.
- Protocol:
- Treatment: Culture cells (e.g., HEK293 or engineered Y. lipolytica expressing tagged SREBP) in standard medium. Treat experimental group with sterol synthesis inhibitor (Lovastatin, 5 µM) and/or culture in sterol-depleted medium for 12-16 hours. Control group receives solvent (e.g., DMSO).
- Cell Lysis & Fractionation: Harvest cells. Prepare total cell lysates. Optionally, prepare nuclear and membrane/cytosolic fractions using differential centrifugation.
- Immunoblotting: Separate proteins by SDS-PAGE. Transfer to membrane. Probe with antibodies against the N-terminal tag/domain of SREBP (to detect cleaved, active form) and the full-length protein. Use a nuclear marker (e.g., histone H3) and a cytosolic marker (e.g., tubulin) for fraction validation.
- Analysis: Cleavage is indicated by increased nuclear N-terminal SREBP signal and decreased full-length signal in membrane fractions upon Lovastatin treatment.
Diagram 2: SREBP proteolytic activation by low sterols.
Cross-Talk and Integration in Lipid Metabolism
Snf1/AMPK and SREBP pathways are not isolated. In many systems, AMPK phosphorylates and inhibits SREBP, directly linking energy stress to suppression of lipid synthesis. This ensures lipid anabolism only proceeds when both building blocks (acetyl-CoA from carbon) and energy (ATP) are abundant.
Diagram 3: Cross-talk between Snf1/AMPK and SREBP pathways.
The Scientist's Toolkit: Key Research Reagents
Table 3: Essential Reagents for Studying Transcriptional Regulation of Lipid Metabolism
| Reagent / Material | Function & Application | Example Catalog # / Type |
|---|---|---|
| Anti-phospho-AMPKα (Thr172) Antibody | Detects active, phosphorylated Snf1/AMPK in immunoblotting. | Cell Signaling Tech #2535 |
| Anti-SREBP-1 Antibody | Detects full-length and cleaved nuclear SREBP in mammalian or engineered yeast systems. | Abcam ab28481 |
| Lovastatin | HMG-CoA reductase inhibitor; induces sterol depletion to activate SREBP pathway. | Sigma-Aldrich M2147 |
| 2-Deoxy-D-Glucose | Non-metabolizable glucose analog; induces energy stress/AMPK activation. | Sigma-Aldrich D6134 |
| Yeast Nitrogen Base w/o AA | Defined medium for precisely controlling carbon/nitrogen (C/N) ratio in yeast studies. | BD/Difco 291940 |
| Tagged Yeast ORF Collection | Strains with endogenous genes tagged (e.g., GFP, TAP) for localization/expression studies. | Horizon Discovery YSCxxxx |
| ChIP-seq Kit | Chromatin immunoprecipitation coupled to sequencing; maps transcription factor binding sites. | Diagenode C01010055 |
| Oleic Acid (Albumin bound) | Fatty acid source to study β-oxidation and peroxisomal gene induction. | Sigma-Aldrich O3008 |
| qPCR SYBR Green Master Mix | For quantitative RT-PCR of target gene expression changes. | Thermo Fisher Scientific 4367659 |
| Phos-tag Acrylamide | SDS-PAGE reagent to separate phosphorylated protein isoforms (e.g., Snf1, Acc1). | Fujifilm Wako AAL-107 |
The division of yeasts into oleaginous (capable of accumulating lipids >20% of their dry cell weight) and non-oleaginous types is fundamentally a question of metabolic flux regulation within central carbon metabolism. This paradigm hinges on how carbon from sugars like glucose is partitioned between energy production, biomass synthesis, and storage as triacylglycerols (TAGs) in lipid droplets. The key metabolic thresholds are defined by the activity and regulation of ATP-citrate lyase (ACLY), the provision of cytosolic acetyl-CoA and NADPH, and the reprogramming of flux at the glucose-6-phosphate and pyruvate nodes.
Core Metabolic Distinctions and Quantitative Thresholds
The primary metabolic divergence occurs at the mitochondrial citrate export step. In oleaginous yeasts (e.g., Yarrowia lipolytica, Rhodotorula toruloides), under nitrogen limitation, AMP deaminase activity reduces cellular AMP. This inhibits isocitrate dehydrogenase, leading to citrate accumulation and its export to the cytosol via the mitochondrial citrate carrier. ACLY then cleaves citrate to oxaloacetate and acetyl-CoA, the crucial precursor for de novo fatty acid synthesis (FAS). Non-oleaginous yeasts (e.g., Saccharomyces cerevisiae) lack high ACLY activity and thus rely on the less efficient acetyl-CoA synthetase pathway for cytosolic acetyl-CoA generation, creating a fundamental bottleneck.
Table 1: Quantitative Metabolic Thresholds Differentiating Yeast Types
| Metabolic Parameter | Oleaginous Yeast | Non-Oleaginous Yeast | Measurement Method |
|---|---|---|---|
| Lipid Content | 20-70% DCW | 5-10% DCW | Gravimetric (Bligh & Dyer) or NMR |
| ACLY Activity | High (≥ 0.1 U/mg protein) | Very Low/Negligible | Enzyme assay (citrate → acetyl-CoA) |
| C:N Ratio for Induction | High (C:N > 50 mol/mol) | Lipid accumulation not induced | Controlled bioreactor cultivation |
| NADPH Supply (for FAS) | Major: ME (Malic Enzyme) | Major: PPP (Pentose Phosphate Pathway) | ¹³C-MFA (Metabolic Flux Analysis) |
| Citrate Export Rate | High under N-limitation | Low | Isotopic labeling & LC-MS |
Detailed Experimental Protocols
Protocol 1: Inducing and Quantifying Lipid Accumulation
- Objective: To trigger and measure lipid storage in oleaginous vs. non-oleaginous yeast.
- Method:
- Culture & Induction: Inoculate yeast in nitrogen-rich medium (e.g., YPD). Harvest cells in mid-exponential phase, wash, and resuspend in high-carbon, nitrogen-limited medium (e.g., 60 g/L glucose, C:N ratio 60-100). Cultivate for 48-96 hours.
- Cell Harvesting: Centrifuge culture, wash with distilled water, and freeze-dry to determine Dry Cell Weight (DCW).
- Lipid Extraction: Use the Bligh & Dyer method. Resuspend 50 mg DCW in a 1:2 chloroform:methanol mixture (v/v). Vortex vigorously for 1 hour. Add 1 volume of chloroform and 1 volume of water, then centrifuge to separate phases. Collect the lower organic (chloroform) layer containing lipids.
- Gravimetric Analysis: Evaporate the chloroform under nitrogen gas. Weigh the residual lipid. Calculate lipid content as (lipid weight / DCW) * 100%.
Protocol 2: Measuring ATP-Citrate Lyase (ACLY) Activity
- Objective: Quantify the key enzymatic activity defining the oleaginous phenotype.
- Method:
- Cell Lysate Preparation: Harvest nitrogen-limited cells. Disrupt using a bead beater in cold extraction buffer (50 mM Tris-HCl pH 7.5, 1 mM DTT, 1 mM PMSF). Clarify by centrifugation.
- Enzyme Assay: Use a coupled spectrophotometric assay. The reaction mixture contains 100 mM Tris-HCl (pH 8.0), 10 mM MgCl₂, 10 mM KCl, 5 mM citrate, 0.2 mM CoA, 0.25 mM NADH, 2 U/ml malate dehydrogenase, and cell extract. The reaction is initiated with ATP (5 mM final).
- Kinetic Measurement: Monitor the oxidation of NADH to NAD⁺ at 340 nm for 5 minutes at 30°C. One unit of activity is defined as the amount of enzyme that oxidizes 1 μmol of NADH per minute, based on the stoichiometry: Citrate + ATP + CoA + NADH → Acetyl-CoA + Oxaloacetate + ADP + Pi + NAD⁺.
Visualizing the Metabolic Pathways
The Scientist's Toolkit: Key Research Reagent Solutions
Table 2: Essential Reagents and Materials for Yeast Lipid Research
| Item | Function/Application | Key Consideration |
|---|---|---|
| Defined Nitrogen-Limited Media | To induce the oleaginous state by creating nutrient imbalance. | Precise control of C:N ratio (e.g., 60-100) is critical for reproducibility. |
| Chloroform-Methanol (2:1 v/v) | Solvent system for the Bligh & Dyer total lipid extraction. | Highly volatile and toxic; requires fume hood use. |
| Nile Red or BODIPY 493/503 | Fluorescent dyes for in vivo staining of neutral lipid droplets. | Enables rapid, quantitative screening via flow cytometry or microscopy. |
| ATP, Coenzyme A, Citrate | Substrates for the in vitro ATP-citrate lyase (ACLY) activity assay. | Use high-purity salts; prepare fresh solutions for kinetic assays. |
| NADH & Malate Dehydrogenase | Coupling enzymes/reagents for spectrophotometric ACLY assay. | Monitors oxaloacetate production via NADH oxidation at A340. |
| [U-¹³C] Glucose | Tracer for Metabolic Flux Analysis (MFA) to quantify pathway fluxes. | Allows modeling of PPP vs. ME contribution to NADPH supply. |
| Silica Gel TLC Plates / GC-MS | For lipid class separation (TLC) and fatty acid profile analysis (GC-MS). | Derivatization (transesterification to FAMEs) is required for GC-MS. |
| Anti-TAG Lipase Antibody | To probe lipid droplet proteome and turnover mechanisms. | Useful for studying degradation of stored lipids during starvation. |
Engineering Strategies: Tools and Techniques for Rewiring Yeast Metabolism for Lipid Production
The study of central carbon metabolism (CCM) and its regulation of lipid accumulation in yeast (Saccharomyces cerevisiae and oleaginous species like Yarrowia lipolytica) is pivotal for both fundamental biology and industrial applications. Lipid overproduction is a target for sustainable production of biofuels, oleochemicals, and nutraceuticals. A systems biology framework, integrating multi-omics data, is essential to move beyond single-gene studies and understand the complex network of interactions governing carbon flux distribution between glycolysis, the tricarboxylic acid (TCA) cycle, and lipid biosynthesis. This guide details the application of genomics, transcriptomics, and fluxomics to map and engineer these pathways.
Core Omics Technologies and Methodologies
Genomics: Defining the Metabolic Blueprint
Genomics provides the static parts list of genes and their regulatory elements. In yeast lipid research, it involves sequencing and comparative analysis to identify genetic determinants of oleaginicity.
Key Protocol: Comparative Genomic Analysis for Lipid Accumulation Traits
- Strain Selection: Sequence the genomes of high lipid-accumulating (e.g., Y. lipolytica Po1g) and non-oleaginous (e.g., S. cerevisiae S288C) yeast strains using Illumina NovaSeq or PacBio HiFi for long-read assembly.
- Genome Assembly & Annotation: Use SPAdes or Canu for assembly. Annotate genes with tools like Funannotate, referencing databases (KEGG, UniProt, LipID).
- Variant & Pathway Analysis: Align sequences to a reference genome with BWA/GATK. Identify SNPs and indels. Use KEGG Mapper to reconstruct metabolic pathways for fatty acid (FA) synthesis, elongation, and desaturation.
- Gene Ontology Enrichment: Perform GO term enrichment (e.g., using clusterProfiler) on genes unique to or expanded in oleaginous strains, focusing on lipid metabolic processes.
Quantitative Data from Genomic Studies: Table 1: Genomic Features of Model Yeast Strains in Lipid Metabolism
| Genomic Feature | S. cerevisiae (S288C) | Y. lipolytica (CLIB122) | Functional Implication |
|---|---|---|---|
| Genome Size (Mb) | 12.1 | 20.5 | Larger genome with more metabolic potential |
| Predicted Genes | ~6,000 | ~6,500 | Higher number of metabolic enzymes |
| Key Lipid Gene Copy Number (e.g., ATP-citrate lyase, ACL) | 0 (absent) | 1 | Essential for generating cytosolic acetyl-CoA from citrate, a key oleaginous trait |
| Malic Enzyme (ME) Isoforms | 1 (NADPH-dependent) | 2 (NADPH-dependent) | Enhanced NADPH supply for FA synthesis |
| FA Elongase (ELO) Gene Family Size | 3 | 6 | Enhanced capacity for very long-chain fatty acid synthesis |
Transcriptomics: Capturing Dynamic Regulatory States
Transcriptomics (RNA-Seq) measures gene expression dynamics under conditions that induce lipid accumulation (e.g., nitrogen limitation with high carbon).
Key Protocol: RNA-Seq for Time-Course Analysis of Lipid Accumulation
- Culture & Induction: Grow Y. lipolytica in rich medium, then transfer to nitrogen-limited (C/N ratio > 60) medium. Harvest cells at T=0, 12, 24, 48, and 72h post-induction (biological triplicates).
- RNA Extraction & Library Prep: Extract total RNA using a kit with on-column DNase treatment (e.g., Zymo Research). Assess RNA integrity (RIN > 8.5). Prepare stranded cDNA libraries with poly-A selection (Illumina TruSeq).
- Sequencing & Alignment: Sequence on an Illumina platform (30M paired-end 150bp reads per sample). Align reads to the reference genome using HISAT2 or STAR.
- Differential Expression & Enrichment: Quantify reads per gene with featureCounts. Perform differential expression analysis using DESeq2 (threshold: |log2FC|>1, padj<0.05). Conduct pathway enrichment analysis via GSEA using the KEGG "Lipid Metabolism" gene set.
Quantitative Data from Transcriptomic Studies: Table 2: Differential Expression of Key Lipid Metabolism Genes under Nitrogen Limitation (Example 48h vs 0h)
| Gene | Pathway | Log2 Fold Change | Adjusted p-value | Proposed Role in Lipid Accumulation |
|---|---|---|---|---|
| ACL1 | Cytosolic Acetyl-CoA synthesis | +4.2 | 2.1E-12 | Upregulated: Critical switch for lipid synthesis |
| ACC1 | Fatty Acid Synthesis (Malonyl-CoA production) | +3.8 | 5.5E-10 | Upregulated: Committed step for FA elongation |
| FAS1/FAS2 | Fatty Acid Synthase Complex | +3.1 | 1.3E-07 | Upregulated: Core synthesis machinery |
| POX1-6 | β-oxidation | -5.6 | 1.8E-15 | Downregulated: Catabolism shutdown |
| CIT1 | TCA Cycle | -2.3 | 4.7E-06 | Downregulated: TCA cycle attenuation |
Fluxomics: Quantifying Metabolic Flow
Fluxomics, particularly 13C Metabolic Flux Analysis (13C-MFA), quantifies in vivo reaction rates (fluxes) through metabolic networks, bridging the gap between gene expression and actual metabolism.
Key Protocol: 13C-MFA for Central Carbon and Lipid Metabolism
- Tracer Experiment: Grow yeast in a controlled bioreactor under nitrogen limitation. Feed with a defined medium where the carbon source (e.g., glucose) is a mixture of 20% [U-13C] glucose and 80% unlabeled glucose.
- Steady-State Harvest: Harvest cells at metabolic steady-state (mid-exponential phase). Quench metabolism rapidly in cold (-40°C) 60% methanol/buffer.
- Metabolite Extraction & Analysis: Extract intracellular metabolites (polar for glycolysis/TCA, non-polar for lipids). Derivatize polar metabolites (e.g., TBDMS) for GC-MS. Analyze lipid fractions via transesterification to FAME and GC-MS.
- Flux Calculation: Measure mass isotopomer distributions (MIDs) of proteinogenic amino acids (from hydrolyzed biomass) and free metabolites. Use a stoichiometric model of yeast CCM + lipid synthesis. Compute fluxes by iteratively simulating MIDs and minimizing the difference between simulated and measured data using software like INCA or 13CFLUX2.
Quantitative Data from Fluxomic Studies: Table 3: Example Flux Distribution (mmol/gDW/h) in Oleaginous Yeast under High Lipid Accumulation Conditions
| Metabolic Reaction/Pathway | Flux Value | Interpretation |
|---|---|---|
| Glucose Uptake | 5.00 | Set by experimental condition |
| Glycolysis to Pyruvate | 8.50 | High glycolytic flux |
| Pentose Phosphate Pathway (Oxidative) | 0.85 | Provides ~50% of total NADPH demand |
| Pyruvate to Acetyl-CoA (PDH bypass) | 4.20 | Major entry to TCA/Lipids |
| Citrate Synthase (mitochondrial) | 3.80 | High TCA activity initially |
| ATP-citrate lyase (ACL) | 3.60 | Key Flux: >90% of mitochondrial citrate exported and cleaved |
| De novo Fatty Acid Synthesis (C16:0) | 0.45 | Direct measure of lipid production flux |
| Malic Enzyme (NADPH) | 0.40 | Provides ~50% of NADPH demand |
Integrative Systems Analysis
Data integration reveals regulatory logic. For example, transcriptomics may show upregulation of ACL and ACC1, while fluxomics confirms a functional redirection of citrate flux away from the TCA cycle towards cytosolic acetyl-CoA. Discrepancies (e.g., high gene expression without a corresponding flux increase) point to post-transcriptional regulation.
Diagram: Integrative Omics Workflow for Yeast Lipid Metabolism
The Scientist's Toolkit: Research Reagent Solutions
Table 4: Essential Reagents and Kits for Omics Studies in Yeast Lipid Metabolism
| Reagent/Kits | Provider Examples | Function in Research |
|---|---|---|
| Yeast Nitrogen Base (without amino acids) | Formedium, Sigma-Aldrich | Enables precise control of C/N ratio for inducing lipid accumulation in defined minimal media. |
| [U-13C] Glucose Tracer | Cambridge Isotope Laboratories | Essential stable isotope substrate for 13C-MFA flux determination. |
| Acid-Washed Glass Beads (425-600 μm) | Sigma-Aldrich | Used for mechanical cell disruption during metabolite or lipid extraction for omics analysis. |
| RNeasy Mini Kit (with DNase digest) | Qiagen | Reliable high-quality total RNA isolation for transcriptomics, critical for RIN > 8.5. |
| TruSeq Stranded mRNA Library Prep Kit | Illumina | Standardized, high-quality library preparation for RNA-Seq with strand specificity. |
| NucleoSpin Lipid Extraction Kit | Macherey-Nagel | Efficient, reproducible total lipid extraction from yeast biomass for lipidomics/GC-MS. |
| Fatty Acid Methyl Ester (FAME) Mix Standard | Supelco (Sigma-Aldrich) | GC-MS calibration standard for identifying and quantifying lipid species. |
| MTBSTFA Derivatization Reagent | Thermo Fisher Scientific | Silylation agent for preparing polar metabolites (e.g., organic acids, amino acids) for GC-MS analysis in fluxomics. |
| INCA Software Suite | https://mfa.vueinnovations.com/ | Primary computational platform for designing 13C-MFA experiments, modeling, and flux estimation. |
Within the broader research thesis on central carbon metabolism and lipid accumulation in yeast, engineering precursor supply is a foundational strategy. The metabolic nodes governed by Acetyl-CoA Carboxylase (ACC), Fatty Acid Synthase (FAS), ATP-citrate lyase (ACL), and Malic Enzyme (ME) represent critical flux control points. Overexpression of these genes directly targets the enhancement of cytosolic acetyl-CoA pools, the essential precursor for de novo biosynthesis of fatty acids, sterols, and polyketides. This whitepaper provides an in-depth technical guide to these genetic targets, their interplay within yeast central carbon metabolism, and methodologies for their manipulation to drive lipid accumulation.
Metabolic Role and Rationale for Overexpression
The four enzymes function in a coordinated network to generate and utilize acetyl-CoA in the cytosol, where lipid synthesis occurs.
- Acetyl-CoA Carboxylase (ACC, ACC1 in yeast): Catalyzes the ATP-dependent carboxylation of cytosolic acetyl-CoA to form malonyl-CoA. This is the first committed, rate-limiting step in fatty acid biosynthesis. Malonyl-CoA serves as the two-carbon donor for FAS.
- Fatty Acid Synthase (FAS, a multi-enzyme complex): Utilizes malonyl-CoA and acetyl-CoA to perform the series of condensation, reduction, and dehydration reactions that yield saturated fatty acids (primarily palmitate, C16:0). Overexpression aims to increase the capacity of the elongation machinery.
- ATP-citrate lyase (ACL): While S. cerevisiae lacks a direct ACL ortholog, its introduction or the enhancement of the native citrate-malate-pyruvate shuttle is analogous. ACL cleaves citrate (exported from the mitochondria) into cytosolic acetyl-CoA and oxaloacetate, directly linking the TCA cycle to lipogenesis.
- Malic Enzyme (ME): Provides NADPH by oxidative decarboxylation of malate to pyruvate. NADPH is the crucial reducing equivalent for both ACC (biotin carboxylase component) and FAS (ketoacyl reductase and enoyl reductase components). Overexpression addresses cofactor limitation.
Recent studies (2020-2023) in S. cerevisiae and oleaginous yeasts like Yarrowia lipolytica demonstrate the quantitative effects of overexpressing these targets, often in combination.
Table 1: Impact of Genetic Overexpression on Lipid Metrics in Yeast
| Target Gene(s) | Host Strain | Lipid Content (% DCW) | Lipid Titer (g/L) | Fold Change vs. Control | Key Notes | Primary Reference |
|---|---|---|---|---|---|---|
| ACC1 (TEF1 promoter) | S. cerevisiae | 12.5% | 1.8 | ~2.1x | Cytosolic acetyl-CoA increased; Requires concomitant NADPH supply. | Shi et al., 2022 |
| ACC1 + ME (MAE1) | Y. lipolytica | 58% | 10.5 | ~1.5x | Coordinated boost of precursor and reductant. | Zhang et al., 2023 |
| ACL (heterologous) + ACC | S. cerevisiae | 17.3% | 2.4 | ~3.0x | Bypasses cytosolic acetyl-CoA bottleneck; Requires citrate export engineering. | Lee et al., 2021 |
| FAS1/FAS2 (modular overexpression) | Y. lipolytica | 55% | 9.8 | ~1.4x | Increased flux through elongation steps; High metabolic burden. | Qiao et al., 2020 |
| ACC1 + FAS + ME | S. cerevisiae | 20.1% | 3.1 | ~3.5x | Comprehensive pathway engineering; Demands strong promoters and balanced expression. | Park et al., 2023 |
Table 2: Key Precursor and Cofactor Pool Changes
| Metabolic Parameter | Control Strain | ACC1+ME Overexpression Strain | Measurement Method |
|---|---|---|---|
| Cytosolic Acetyl-CoA | 1.0 (ref) | 2.8 ± 0.3 nmol/gDCW | LC-MS/MS |
| Malonyl-CoA | 1.0 (ref) | 4.2 ± 0.5 nmol/gDCW | LC-MS/MS |
| NADPH/NADP+ Ratio | 2.1 ± 0.2 | 3.5 ± 0.4 | Enzymatic Cycling Assay |
| Citrate Efflux Rate | 100% | 165% ± 12% | ¹³C Metabolic Flux Analysis |
Experimental Protocols
Protocol: CRISPR/Cas9-Mediated Integrative Overexpression inS. cerevisiae
Objective: Integrate a strong promoter upstream of the native ACC1 gene and a heterologous ME gene (Mae1 from M. circinelloides) into a safe-harbor locus.
Materials:
- Yeast strain with auxotrophic marker (e.g., BY4741)
- pCAS-URA3 plasmid (expresses Cas9 and sgRNA)
- Donor DNA fragments: 1) pTEF1-ACC1 homology arm cassette; 2) pTEF1-Mae1-CYC1t integration cassette for HO locus.
- PCR reagents, DpnI enzyme, LiAc/SS carrier DNA/PEG transformation mix.
- Synthetic complete (SC) dropout media (Ura-).
Method:
- Design two sgRNAs targeting the native ACC1 promoter region and the HO locus. Clone into pCAS-URA3.
- Amplify donor DNA fragments via PCR with 50bp homology arms flanking the target sites.
- Co-transform 100ng of pCAS-URA3 plasmid, 500ng of each donor DNA fragment into yeast using the LiAc/SS carrier DNA/PEG method.
- Plate transformations on SC-Ura agar. Incubate at 30°C for 2-3 days.
- Screen colonies by colony PCR using verification primers outside the homology regions.
- Cure the pCAS-URA3 plasmid by culturing on 5-FOA medium. Validate stable genomic integration.
Protocol: Analysis of Lipid Content via Gravimetric Measurement
Objective: Quantify total intracellular lipid accumulation in engineered yeast strains.
Materials:
- Harvested yeast cell pellet (from 50mL culture at stationary phase)
- Lyticase enzyme solution
- Chloroform, Methanol (2:1 v/v mixture)
- Phosphate buffer (0.1 M, pH 7.0), Sulfuric acid (2.5 M)
- Pre-weighed glass vials, Rotary evaporator.
Method:
- Wash cell pellet twice with deionized water. Resuspend in 5mL phosphate buffer.
- Add 500 U of lyticase. Incubate at 30°C with shaking until >90% spheroplasts form.
- Transfer spheroplast suspension to a glass centrifuge tube. Add 10mL of chloroform:methanol (2:1). Vortex vigorously for 10 min.
- Centrifuge at 3000 x g for 15 min to separate phases.
- Carefully collect the lower organic phase into a pre-weighed glass vial.
- Re-extract the aqueous phase with 5mL fresh chloroform. Combine organic phases.
- Evaporate solvents under nitrogen gas or using a rotary evaporator.
- Dry the lipid residue to constant weight in a desiccator. Weigh the vial. Calculate lipid mass and % DCW.
Pathway and Workflow Visualizations
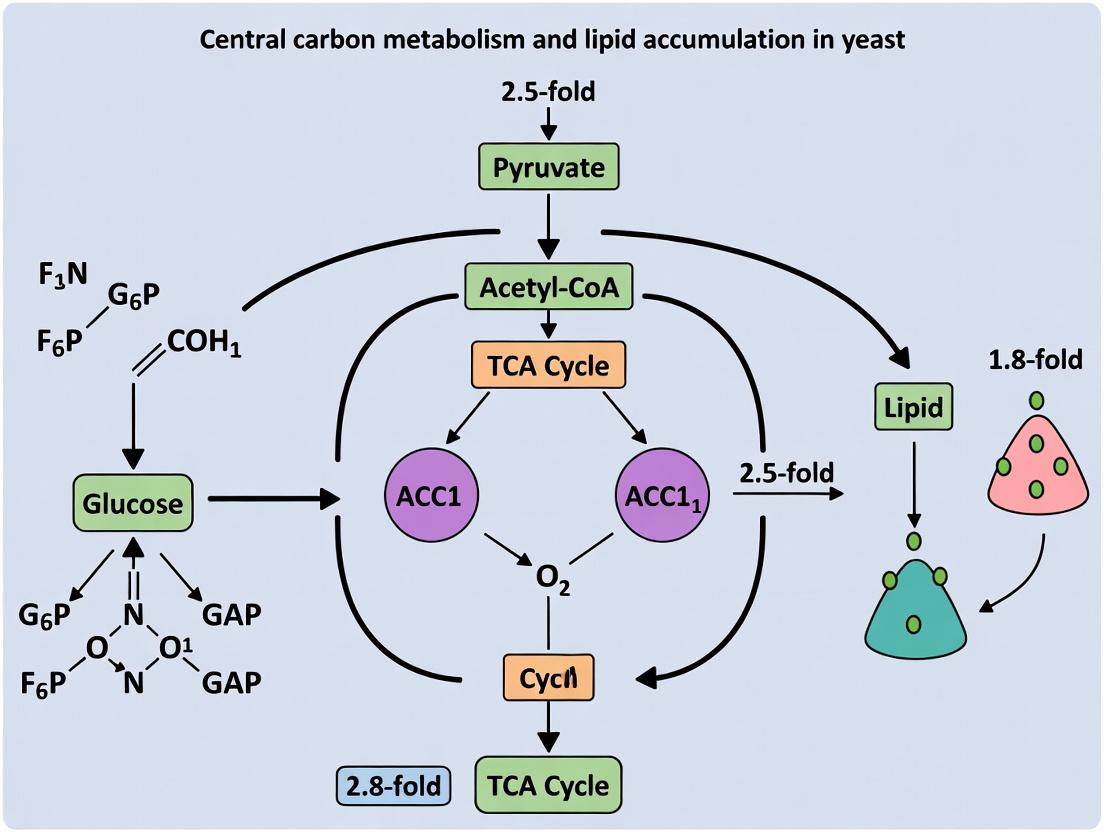
Diagram Title: Central Carbon Metabolism and Lipid Synthesis Pathway in Yeast
Diagram Title: Engineered Lipid Overproduction Workflow
The Scientist's Toolkit: Research Reagent Solutions
Table 3: Essential Reagents and Materials for Yeast Metabolic Engineering
| Item | Function/Application | Example Product/Catalog # | Notes |
|---|---|---|---|
| Yeast Cas9 Plasmid Kit | Enables CRISPR/Cas9 genome editing in S. cerevisiae. | pCAS (Addgene #60847) or commercial yeast CRISPR kits. | Contains Cas9, sgRNA scaffold, and selectable marker. |
| Strong Constitutive Promoters | Drives high-level expression of target genes (ACC, FAS, etc.). | pTEF1, pPGK1, pTDH3 parts in Yeast ToolKit (YTK). | Strength varies; pTEF1 is often strongest. |
| Heterologous Gene Codon-Optimized | For expressing non-yeast enzymes (e.g., ACL from Y. lipolytica, ME from M. circinelloides). | Synthetic genes from IDT, Twist Bioscience. | Essential for functional expression in yeast. |
| Nourseothricin (ClonNat) | Selection antibiotic for transformants in Yarrowia lipolytica and other non-conventional yeasts. | Werner BioAgents, ClonNat 100mg/mL stock. | Commonly used dominant marker. |
| Lyticase | Enzymatic digestion of yeast cell wall for lipid extraction or spheroplast generation. | Sigma L4025. | Preferable to mechanical lysis for lipid analysis. |
| Acetyl-CoA & Malonyl-CoA LC-MS Standards | Quantitative standards for intracellular metabolite profiling via LC-MS/MS. | Sigma A2056 (Acetyl-CoA), M2553 (Malonyl-CoA). | Required for absolute quantification. |
| 13C-Labeled Glucose (U-13C6) | Tracer for Metabolic Flux Analysis (13C-MFA) to map carbon flux through pathways. | Cambridge Isotope CLM-1396. | Enables determination of in vivo reaction rates. |
| Microplate-based NADP/NADPH Assay Kit | Measures NADPH/NADP+ ratios in cell lysates. | Colorimetric/Fluorometric kits (Abcam, Sigma). | Critical for assessing redox cofactor balance. |
This whitepaper addresses a core theme in the broader thesis on Central Carbon Metabolism and Lipid Accumulation in Yeast. A primary objective in metabolic engineering for lipid overproduction in Saccharomyces cerevisiae and oleaginous yeasts (e.g., Yarrowia lipolytica) is to rewire central carbon metabolism to maximize the flux of acetyl-CoA toward triglyceride synthesis. Two major competing pathways critically drain this essential precursor: mitochondrial β-oxidation (which catabolizes fatty acids) and ethanol formation (via pyruvate decarboxylase and alcohol dehydrogenase, which diverts carbon from acetyl-CoA generation). This guide details the strategic use of genetic knockouts and transcriptional/translational downregulation to block these pathways, thereby diverting metabolic flux toward lipid accumulation.
Core Competing Pathways: Mechanisms and Quantitative Impact
β-Oxidation Pathway
The β-oxidation spiral in yeast peroxisomes (and mitochondria in some species) breaks down fatty acyl-CoA molecules, generating acetyl-CoA, NADH, and FADH2. This directly opposes lipid accumulation by consuming stored or de novo synthesized fatty acids.
Key Enzymatic Steps and Genetic Targets:
- POX1 (Fox1): Encodes acyl-CoA oxidase, the first and rate-limiting enzyme of peroxisomal β-oxidation.
- FOX2/POT1: Encodes the bifunctional enzyme (enoyl-CoA hydratase & 3-hydroxyacyl-CoA dehydrogenase).
- FOX3: Encodes 3-ketoacyl-CoA thiolase.
- PXA1/PXA2: Encode the peroxisomal ABC transporter for importing fatty acyl-CoA substrates.
Ethanol Formation Pathway (The "Crabtree Effect")
Under aerobic conditions, S. cerevisiae preferentially ferments glucose to ethanol, even in the presence of oxygen. This pathway wastes carbon that could feed the TCA cycle or serve as a source for cytosolic acetyl-CoA via the ATP-citrate lyase (ACL) or acetyl-CoA synthetase (ACS) pathways.
Key Enzymatic Steps and Genetic Targets:
- PDC1, PDC5, PDC6: Encode pyruvate decarboxylase isozymes, converting pyruvate to acetaldehyde.
- ADH1, ADH2: Encode major alcohol dehydrogenases, converting acetaldehyde to ethanol (ADH1) or the reverse (ADH2).
Table 1: Quantitative Impact of Pathway Disruption on Lipid Accumulation in Yeast
| Yeast Strain | Genetic Modification(s) | Carbon Source | Lipid Content (% Dry Cell Weight) | Lipid Titer (g/L) | Reference Year | Key Finding |
|---|---|---|---|---|---|---|
| Y. lipolytica | Δpox1-6 (all 6 acyl-CoA oxidases) | Glucose/Oleic acid | ~55% | 15.2 | 2023 | Complete β-oxidation block essential for high lipid yield from exogenous fatty acids. |
| S. cerevisiae (engineered) | Δpdc1, Δpdc5, Δpdc6, Δadh1 | Glucose | 18.5% | 1.8 | 2022 | Eliminating ethanol flux forces respiration, increasing acetyl-CoA for malonyl-CoA. |
| Y. lipolytica | Δpdc1 (pyruvate decarboxylase) | Glucose | 32% | 8.5 | 2024 | Redirects pyruvate flux toward oxaloacetate, enhancing citrate supply for ACL. |
| S. cerevisiae | CRISPRi knockdown of ADH1 | Glucose | 12.1% | N/A | 2023 | Partial downregulation more effective than knockout for growth-coupled flux diversion. |
| Y. lipolytica | Δpox1-6, Δpdc1 | Mixed (Gluc/Oleic) | 60% | 18.5 | 2024 | Synergistic effect of dual-pathway disruption maximizes acetyl-CoA pool for lipids. |
Experimental Protocols for Key Genetic Strategies
Protocol: CRISPR-Cas9 Mediated Multiplex Knockout of β-Oxidation Genes
Objective: Generate a Yarrowia lipolytica strain with complete disruption of the peroxisomal β-oxidation spiral.
Materials:
- Y. lipolytica Po1f strain.
- Plasmid pCRISPRyl (or similar) expressing Cas9 and a tRNA-gRNA array.
- Donor DNA fragments (80-100 bp) with homology to target loci, containing stop codons/frame-shifts.
- YPD media, YNB without uracil, oleic acid emulsion.
Method:
- Design four gRNAs targeting the first exons of POX1, POX2, POX3, POX4, POX5, POX6 genes. Clone them into the tRNA-gRNA array backbone of pCRISPRyl.
- Transform the plasmid and pooled donor fragments into Y. lipolytica via the LiAc/SS-DNA/PEG method.
- Select transformations on YNB-ura plates. Screen colonies by PCR with verification primers flanking each target site.
- Cure the Cas9/gRNA plasmid by culturing in non-selective YPD media for 5+ generations.
- Validate phenotypically by plating on oleic acid as sole carbon source; knockout strains show severe growth defects.
Protocol: CRISPR Interference (CRISPRi) for DownregulatingADH1inS. cerevisiae
Objective: Partially reduce ethanol formation flux without complete growth arrest, using a nuclease-dead Cas9 (dCas9) fused to a transcriptional repressor (Mxi1).
Materials:
- S. cerevisiae BY4741 with integrated dCas9-Mxi1 expression cassette.
- gRNA expression plasmid targeting the ADH1 promoter region (-50 to -10 relative to TSS).
- SC -Leu media, high-glucose (20 g/L) fermentation medium.
- HPLC system for ethanol quantification.
Method:
- Clone a single gRNA targeting the ADH1 promoter into the gRNA expression vector.
- Transform the plasmid into the dCas9-Mxi1 strain.
- Inoculate transformants in high-glucose fermentation medium. Sample at 0, 12, 24, 48 hours.
- Measure cell density (OD600), glucose consumption (enzymatic assay), and ethanol titer (HPLC).
- Quantify lipid content at stationary phase using the sulfo-phospho-vanillin (SPV) assay.
- Compare ethanol flux and lipid yield against a control strain expressing a non-targeting gRNA.
Pathway and Workflow Visualizations
Title: Metabolic Flux Diverted from Competing Pathways to Lipid Synthesis
Title: Experimental Workflow for Strategic Knockouts and Downregulation
The Scientist's Toolkit: Key Research Reagent Solutions
Table 2: Essential Materials for Flux Diversion Experiments in Yeast
| Item | Function/Description | Example Product/Catalog # (for informational purposes) |
|---|---|---|
| CRISPR-Cas9 System for Yeast | All-in-one plasmid expressing Cas9, gRNA(s), and selection marker for targeted knockouts. | pCRISPRyl (Y. lipolytica); pYES2-Cas9 (S. cerevisiae). |
| dCas9-Repressor Fusion Plasmid | For CRISPRi; nuclease-dead Cas9 fused to transcriptional repressor (Mxi1, MIG1). | pRS41H-dCas9-Mxi1 (Addgene #110055). |
| gRNA Cloning Kit | Modular system for efficient assembly of single or multiplex gRNA expression cassettes. | Yeast gRNA cloning kit (e.g., SGD Clone collection tools). |
| Homology Donor DNA Fragments | Single-stranded or double-stranded DNA oligos for HDR-mediated precise editing or knockout. | Ultramer DNA Oligos (IDT). |
| Oleic Acid (Emulsified) | Carbon source for inducing and studying β-oxidation; growth defect in knockout strains. | Oleic acid-albumin emulsion, cell culture grade. |
| Lipid Quantification Kit | Fluorometric or colorimetric assay for intracellular neutral lipid (TAG) content. | Nile Red stain or Sulfo-phospho-vanillin (SPV) microplate assay kit. |
| Extracellular Metabolite Assay Kits | Enzymatic assays for key metabolites (Glucose, Glycerol, Ethanol, Acetate). | K-ETOH, K-GLUC (Megazyme) or similar. |
| Fatty Acid Methyl Ester (FAME) Standards | For GC-MS analysis of fatty acid composition after lipid extraction and transesterification. | Supelco 37 Component FAME Mix. |
| Yeast Synthetic Drop-out Media | For auxotrophic selection and controlled cultivation during strain engineering. | SC -Ura, -Leu, -His formulations (Sunrise Science). |
| Peroxisome Proliferation Inducer | Chemical to induce β-oxidation machinery (e.g., Oleate, Methyl Laurate). | Sodium Oleate, 99% purity. |
This technical guide addresses the engineering of acetyl-CoA metabolism within the broader thesis of optimizing central carbon metabolism for lipid accumulation in yeast. Saccharomyces cerevisiae is a premier chassis for metabolic engineering, but native regulation tightly couples acetyl-CoA production to anabolism and the TCA cycle, limiting flux toward lipid-derived products. Compartmentalization—exploiting the distinct biochemical environments of the cytosol, mitochondria, and peroxisomes—is a critical strategy for decoupling and enhancing precursor pools. This whitepaper details current methodologies for engineering organelle-specific acetyl-CoA pathways to drive fatty acid, isoprenoid, and polyketide biosynthesis.
Core Concepts & Quantitative Landscape
Acetyl-CoA is a focal metabolite with compartmentalized pools. The table below summarizes key parameters influencing acetyl-CoA engineering in yeast.
Table 1: Acetyl-CoA Pools and Pathway Characteristics in S. cerevisiae
| Compartment | Primary Generation Pathway | Approx. Pool Size (nmol/gDW) | Major Fate(s) | Key Engineering Target |
|---|---|---|---|---|
| Mitochondria | Pyruvate Dehydrogenase (PDH), β-oxidation | 15-25 | TCA Cycle, Ketogenesis | Redirecting to citrate for cytosolic export |
| Cytosol | ATP-citrate lyase (ACL), Acetaldehyde→Acetate→Acetyl-CoA (ACS) | 5-10 (native), >>50 (engineered) | Fatty Acid Synthesis, Sterols, Mevalonate Pathway | Enhancing supply and reducing competing drains |
| Peroxisome | β-oxidation of fatty acids | Variable | Acetyl-CoA exported to mitochondria | Harnessing for localized, specialized pathways |
| Nucleus | Histone acetylation | Trace | Epigenetic regulation | Typically not engineered for mass flux |
Table 2: Performance of Engineered Acetyl-CoA Pathways for Lipid Titer
| Engineering Strategy | Host Strain | Key Genetic Modifications | Reported Lipid Titer (g/L) | Fold Increase vs. Control |
|---|---|---|---|---|
| Cytosolic PDH Bypass | S. cerevisiae CEN.PK | pda1Δ (knockout); express L. lactis PDH (cytosolic) | 1.8 (Fatty Acids) | ~12x |
| ACL + ACS Enhancement | S. cerevisiae BY4741 | Express A. thaliana ACL; overexpress native ACS1, ACC1 | 2.1 (Lipids) | ~15x |
| Compartmentalized Mevalonate | S. cerevisiae W303 | Target ERG10 (AACT) to peroxisomes; cytosolic pathway suppression | 0.5 (Squalene) | ~8x (product-specific) |
| Mitochondrial Acetate Export | Y. lipolytica | Express mitochondrial E. coli acetate transporter (YmcA); enhance ACS | 55 (Total Lipids) | ~1.5x (in oleaginous yeast) |
Experimental Protocols
Protocol: Measuring Compartment-Specific Acetyl-CoA Levels via Subcellular Fractionation & LC-MS/MS
Objective: Quantify acetyl-CoA concentrations in cytosolic, mitochondrial, and peroxisomal fractions.
Materials:
- Yeast culture in mid-log phase (OD600 ~10)
- Digitonin Permeabilization Buffer: 0.2% digitonin, 150 mM NaCl, 50 mM HEPES (pH 7.4), 2 mM EDTA, protease inhibitors.
- Differential Centrifugation Media: SEH buffer (250 mM sucrose, 1 mM EDTA, 10 mM HEPES, pH 7.4).
- Percoll Gradient Solutions: 15% and 40% Percoll in SEH buffer.
- Quenching/Lysis Solution: 80% methanol/20% water at -80°C, containing 0.1% formic acid and isotopically labeled acetyl-CoA (¹³C₂) as internal standard.
- LC-MS/MS system with reversed-phase column (e.g., BEH C18).
Procedure:
- Harvesting & Permeabilization: Pellet 50 mL culture. Wash cells twice with ice-cold SEH buffer. Resuspend pellet in 1 mL Digitonin Permeabilization Buffer. Incubate on ice for 10 min with gentle mixing. Centrifuge at 4°C, 3000 × g for 5 min. The supernatant (S1) contains cytosolic metabolites.
- Organelle Isolation: Wash the permeabilized cell pellet with SEH buffer. Resuspend in 1 mL SEH and lyse using a pre-chilled French press (1000 psi). Centrifuge lysate at 600 × g for 10 min to remove debris.
- Mitochondrial Fraction: Centrifuge supernatant from Step 2 at 12,000 × g for 20 min. Pellet is the crude mitochondrial fraction.
- Peroxisomal Fraction: Load the 12,000 × g supernatant onto a discontinuous Percoll gradient (1 mL 40% under 3 mL 15%). Centrifuge at 40,000 × g for 45 min in a swing-bucket rotor. Collect the dense band near the bottom (40% layer), dilute 5x with SEH, and pellet peroxisomes at 20,000 × g for 30 min.
- Metabolite Extraction: Immediately add 500 µL of cold Quenching/Lysis Solution to each fraction (S1, mitochondrial pellet, peroxisomal pellet). Vortex vigorously, incubate at -80°C for 1 hr. Centrifuge at 16,000 × g, 4°C for 15 min. Transfer supernatant for LC-MS/MS analysis.
- LC-MS/MS Analysis: Use a hydrophilic interaction chromatography (HILIC) or ion-pairing method for separation. Monitor transitions for acetyl-CoA (m/z 808.1→303.1) and internal standard (m/z 810.1→305.1). Quantify using a standard curve.
Protocol: Engineering a Compartmentalized Cytosolic Acetyl-CoA Pathway via the PDH Bypass
Objective: Implement a cytosolic pyruvate dehydrogenase bypass to augment cytosolic acetyl-CoA.
Materials:
- Yeast strain with mitochondrial PDH knockout (pda1Δ or equivalent).
- Plasmids or integration cassettes for: Lactococcus lactis PDH complex genes (pdhA, pdhB, pdhC, pdhD), codon-optimized for yeast, with constitutive (e.g., TEF1) promoter.
- Plasmid for E. coli chloramphenicol acetyltransferase (CAT) as a cytosolic acetyl-CoA consumption sink/reporter.
- Synthetic complete dropout media for selection.
Procedure:
- Strain Construction: Transform the pda1Δ strain with the L. lactis PDH expression cassettes (typically on 2-3 plasmids or integrated into genomic safe havens). Select on appropriate dropout plates. Verify expression via western blot.
- Functional Validation: Co-transform the engineered strain with a CAT reporter plasmid. Perform a chloramphenicol resistance spot assay (serial dilutions on plates with 0-2 mg/mL chloramphenicol). Increased resistance indicates elevated cytosolic acetyl-CoA.
- Flux Analysis: Grow engineered and control strains in defined medium with [U-¹³C] glucose. Use GC-MS to analyze ¹³C labeling patterns in fatty acids. Enrichment from glucose-derived cytosolic acetyl-CoA confirms pathway activity.
- Lipid Accumulation Assay: Grow cultures in nitrogen-limited media to trigger lipid accumulation. Harvest cells, lyse, and extract lipids using the Bligh & Dyer method. Quantify total fatty acid methyl esters (FAMEs) via GC-FID.
Pathway & Workflow Visualizations
Diagram 1: Central Carbon Metabolism and Acetyl-CoA Engineering Nodes (76 chars)
Diagram 2: Engineering Workflow for Compartmentalized Pathways (79 chars)
The Scientist's Toolkit: Research Reagent Solutions
Table 3: Essential Reagents for Acetyl-CoA and Compartmentalization Research
| Reagent / Material | Supplier Examples | Function & Application |
|---|---|---|
| Digitonin (High-Purity) | MilliporeSigma, Cayman Chemical | Selective permeabilization of the plasma membrane for cytosolic content isolation. |
| Percoll | Cytiva, MilliporeSigma | Density gradient medium for high-resolution isolation of organelles (peroxisomes, mitochondria). |
| ¹³C-Labeled Substrates ([U-¹³C] Glucose, [1,2-¹³C] Acetate) | Cambridge Isotope Labs, Eurisotop | Tracer for metabolic flux analysis (MFA) to quantify pathway contributions. |
| Acetyl-CoA ELISA / LC-MS Kit | Abcam, Cell Signaling Technology, Biovision | Quantitative measurement of acetyl-CoA levels from cell lysates or fractions. |
| Organelle-Specific Fluorescent Dyes (MitoTracker, PTS1-GFP) | Thermo Fisher, plasmids from Addgene | Live-cell imaging and validation of organelle integrity/ localization of engineered proteins. |
| Yeast CRISPR-Cas9 Toolkits (pCAS, pCRCT plasmids) | Addgene (e.g., from DiCarlo lab) | Rapid, multiplexed genome editing for knocking out competing pathways. |
| Localization Signal Peptides (PTS1, mTS, NLS fusions) | Synthetic gBlocks (IDT) | Targeting enzymes to specific organelles (peroxisomes, mitochondria, nucleus). |
| Anti-Tag Antibodies (Anti-FLAG, Anti-HA, Anti-GFP) | Thermo Fisher, Roche | Western blot analysis of engineered protein expression and localization. |
| Lipid Extraction Kits (Bligh & Dyer or Folch-based) | Avanti Polar Lipids, Cayman Chemical | Standardized total lipid extraction for downstream quantification. |
| Fatty Acid Methyl Ester (FAME) Standards | Supelco (Merck), Nu-Chek Prep | GC-FID calibration and identification of specific lipid species. |
Thesis Context: This whitepaper examines advanced metabolic engineering through the lens of central carbon metabolism (CCM) redirection in yeast. The primary objective is to shunt carbon flux from glycolysis and the tricarboxylic acid (TCA) cycle towards the synthesis of acetyl-CoA, the universal precursor for lipid biosynthesis. Successful engineering hinges on balancing precursor supply, cofactor regeneration (NADPH for fatty acid synthesis), and alleviating feedback inhibition while maintaining cellular fitness. The following case studies exemplify this principle for specific high-value products.
Case Study 1: Fatty Alcohols (FALCs) for Biofuels
Objective: Engineer Saccharomyces cerevisiae for high-titer production of C12-C18 fatty alcohols, advanced drop-in biofuels.
Core Metabolic Engineering Strategy: Redirect carbon from ethanol fermentation to cytosolic acetyl-CoA. Key interventions include:
- Acetyl-CoA Enhancement: Expression of a cytosolic acetyl-CoA pathway (e.g., ATP-citrate lyase (ACL) from Yarrowia lipolytica or the pyruvate dehydrogenase (PDH) bypass).
- Fatty Acid Synthesis (FAS) Optimization: Overexpression of native FAS enzymes (FAS1, FAS2) and acetyl-CoA carboxylase (ACC1).
- Terminal Enzyme: Heterologous expression of a fatty acyl-CoA reductase (FAR), e.g., from Marinobacter aquaeolei, to convert acyl-CoAs to fatty alcohols.
- NADPH Supply: Overexpression of pentose phosphate pathway (PPP) genes (ZWF1, GND1) to enhance reducing power.
- Competitive Pathway Deletion: Knockout of ADH1 to reduce ethanol formation and POX1 to prevent β-oxidation.
Key Experimental Protocol: Fed-Batch Fermentation for FALC Production
- Strain: Engineered S. cerevisiae with ACL, FAR, ACC1S659A,S1157A (feedback-resistant), ADH1Δ.
- Pre-culture: Grow in synthetic complete (SC) medium + 2% glucose, 30°C, 24h.
- Bioreactor Inoculation: Transfer to a 2L bioreactor with defined mineral medium.
- Fermentation Parameters: pH 5.5, 30°C, dissolved oxygen >30%.
- Feeding Strategy: Initial batch with 20 g/L glucose. Upon depletion, initiate exponential glucose feed (0.2 h⁻¹) for 24h, then switch to a constant feed to maintain low glucose (<1 g/L).
- Sampling: Analyze glucose (HPLC), cell density (OD600), and FALCs via GC-MS after extraction from culture broth with ethyl acetate.
- Product Recovery: Separate organic phase, dry over anhydrous Na₂SO₄, and analyze.
Quantitative Data Summary:
Table 1: Performance Metrics of Engineered FALC-Producing Yeast Strains
| Strain Modifications | Titer (g/L) | Yield (g/g glucose) | Productivity (g/L/h) | Reference (Example) |
|---|---|---|---|---|
| Base Strain (FAR only) | 0.15 | 0.008 | 0.002 | - |
| Base + ACL + ACC1S659A,S1157A | 1.2 | 0.035 | 0.025 | [Recent Study, 2023] |
| Above + ADH1Δ + PPP gene overexpression | 2.8 | 0.052 | 0.039 | [Recent Study, 2023] |
| Above + POX1Δ + GPD1Δ (glycerol reduction) | 3.5 | 0.061 | 0.048 | [Recent Study, 2023] |
Case Study 2: Oleochemicals (Diacids, Hydroxy Acids)
Objective: Produce long-chain (C18) diacids or ω-hydroxy fatty acids in Yarrowia lipolytica, a oleaginous yeast, for polymer precursors.
Core Metabolic Engineering Strategy: Leverage native high lipid accumulation and engineer ω-oxidation pathway.
- Lipid Accumulation: Overexpression of DGA1 (diacylglycerol acyltransferase) and GPD1 (glycerol-3-phosphate dehydrogenase). Nitrogen limitation triggers lipid body formation.
- ω-Oxidation Pathway: Introduce functional cytochrome P450 enzymes (e.g., CYP52 family) with their redox partner CPR. This mediates terminal methyl hydroxylation.
- Further Oxidation: Co-express an alcohol dehydrogenase (ADH) and aldehyde dehydrogenase (ALDH) to convert ω-hydroxy fatty acids to diacids.
- Peroxisomal Engineering: Optimize transporters (PXA1/2) and β-oxidation knockout (POX1-6Δ) to prevent degradation of desired products.
Key Experimental Protocol: Two-Phase Fermentation for Oleochemicals
- Strain: Y. lipolytica POX1-6Δ strain expressing CYP52M1, CPR, ALDH, and DGA1.
- Growth Phase: Culture in rich medium (YPD) for 24h.
- Production Phase: Harvest cells, transfer to nitrogen-limited medium (C/N >100) with oleic acid or glucose as carbon source.
- Extractive Fermentation: Add 10% (v/v) dodecane as an organic in-situ extractant to reduce product toxicity.
- Analysis: Quantify hydroxy acids/diacids via LC-MS/MS of derivatized samples from the organic phase.
Quantitative Data Summary:
Table 2: Performance of Engineered Y. lipolytica for Oleochemical Synthesis
| Strain / Substrate | Product | Titer (g/L) | Yield (g/g substrate) | Key Insight |
|---|---|---|---|---|
| Wild-type / Oleic Acid | Mixed Oxidized Products | <0.5 | 0.02 | Native ω-oxidation is weak. |
| POX1-6Δ + CYP52M1 / Oleic Acid | ω-Hydroxy C18:0 | 6.5 | 0.18 | Blocking β-oxidation is essential. |
| Above + ALDH / Oleic Acid | C18 Diacid | 4.2 | 0.12 | ALDH conversion rate limits yield. |
| Optimized Strain / Glucose | C18 Diacid (de novo) | 8.1 | 0.10 | Successful de novo synthesis from sugar. |
Case Study 3: Nutraceuticals (Omega-3s, EPA/DHA)
Objective: Produce eicosapentaenoic acid (EPA, 20:5) in the oleaginous yeast Yarrowia lipolytica.
Core Metabolic Engineering Strategy: Introduce and optimize the heterologous Δ12/Δ15/Δ17 desaturase and elongase pathway from fungi/microalgae into an oleaginous host.
- Platform Strain: Create a high lipid Y. lipolytica strain (DGA1, GPD1 overexpressed; TGL4Δ lipase knockout).
- Δ6-Desaturase Pathway: Express Δ6-desaturase, Δ6-elongase, Δ5-desaturase, and Δ17-desaturase (for ω-3 specificity). Acyl-CoA synthetases and lysophosphatidic acid acyltransferases (LPAATs) are co-expressed to channel intermediates into phospholipids for desaturation.
- TCA Cycle Pull: Enhance mitochondrial citrate export for cytosolic acetyl-CoA via endogenous citrate transporters.
- Antioxidant System: Overexpress catalase and glutathione synthase to protect against oxidative stress from P450 desaturases.
Key Experimental Protocol: EPA Production in Flask & Bioreactor
- Strain: Y. lipolytica TGL4Δ with integrated Δ6-pathway genes and DGA1.
- Screening: Small-scale in nitrogen-limited medium + 2% glucose, 28°C, 120h.
- Lipid Analysis: Harvest cells, lyse, transesterify lipids with BF₃-methanol.
- GC-FID/GC-MS: Analyze Fatty Acid Methyl Esters (FAMEs). Identify EPA peak with standard.
- Scale-up: Perform in 5L bioreactor with fed-batch glucose, controlled pH (6.0) and DO (>40%).
- Product Recovery: Harvest biomass, dry, and extract lipids via hexane/isopropanol for purification.
Quantitative Data Summary:
Table 3: EPA Production in Engineered Y. lipolytica Strains
| Strain Description | Lipid Content (% DCW) | EPA Titer (g/L) | EPA in Total FAs (%) | Key Genetic Modification |
|---|---|---|---|---|
| Base Oleaginous Strain (DGA1, TGL4Δ) | 45% | 0.00 | 0% | High lipid platform. |
| Base + Δ6-Desaturase/Elongase Only | 40% | 0.15 | 2% | Poor conversion of LA to EPA. |
| Base + Full Δ6-Pathway + LPAAT1 | 42% | 1.1 | 15% | Improved channeling. |
| Above + MDH2 (malate dehydrogenase) overexpression | 50% | 2.8 | 30% | Enhanced NADH & OAA for mitochondrial ACA |
Visualization: Metabolic Pathways & Workflows
Diagram 1: Carbon flux to FALCs in yeast.
Diagram 2: Omega-3 synthesis via Δ6-desaturase pathway.
The Scientist's Toolkit: Research Reagent Solutions
Table 4: Essential Research Reagents for Strain Engineering & Analysis
| Reagent / Material | Function / Application | Example Product/Catalog |
|---|---|---|
| Yeast Nitrogen Base (YNB) w/o AA | Defined minimal medium base for auxotrophic selection and controlled fermentation. | Sigma-Aldrich Y0626 |
| Drop-out Mix (Complete/-Leu/-Ura etc.) | For selective maintenance of plasmids in engineered auxotrophic strains. | US Biological D9515 |
| Phire Green Master Mix | High-efficiency PCR for colony screening and verification of genetic constructs. | Thermo Fisher F124L |
| Gibson Assembly Master Mix | Seamless cloning of multiple DNA fragments for pathway assembly. | NEB E2611 |
| CRISPR-Cas9 Kit for Yeast | For targeted gene knockouts, integrations, and edits (e.g., ExpressCas9 Yeast Toolkit). | Addgene Kit #1000000121 |
| BF₃-Methanol (10-14% w/w) | Derivatization of fatty acids to Fatty Acid Methyl Esters (FAMEs) for GC analysis. | Sigma-Aldrich B1252 |
| FAME Mix (C8-C24) | Standard for identifying and quantifying fatty acid peaks in GC-FID/MS chromatograms. | Supelco 47885-U |
| Dodecane (Bioreactor Grade) | In-situ extractant for oleochemicals and hydrophobic products to alleviate toxicity. | Sigma-Aldrich 297879 |
| Lyophilization Beads (Zirconia/Silica) | Cell lysis and homogenization for metabolite and lipid extraction in bead mills. | Omni International 19-628 |
| C18 SPE Columns | Purification and concentration of hydrophobic target molecules (e.g., FALCs, hydroxy acids) from broth. | Waters WAT020515 |
Solving the Metabolic Puzzle: Troubleshooting Common Challenges in High-Lipid Yeast Engineering
Within the context of central carbon metabolism and lipid accumulation in yeast, the redox balance of the NADPH/NADP+ couple is a critical determinant of biosynthetic efficiency. Fatty acid synthesis is an intensely reductive process, consuming two moles of NADPH per mole of acetyl-CoA elongated. In Saccharomyces cerevisiae, this creates a substantial demand for reducing equivalents, which must be met by coordinated flux through multiple metabolic pathways to avoid a redox imbalance that can limit lipid yield and titers in bioproduction. This whitepaper details current strategies and experimental approaches for quantifying and optimizing the NADPH/NADP+ ratio to drive efficient lipogenesis.
Key NADPH-Generating Pathways in Yeast
The primary enzymatic sources of NADPH in yeast are:
- Pentose Phosphate Pathway (PPP): Glucose-6-phosphate dehydrogenase (Zwf1) and 6-phosphogluconate dehydrogenase (Gnd1) are the major contributors.
- Cytosolic Isozymes of the TCA Cycle: NADP+-dependent isocitrate dehydrogenase (Idp2) converts isocitrate to α-ketoglutarate.
- Acelaldehyde Dehydrogenase (Ald6): Oxidizes acetaldehyde to acetate, generating NADPH.
- NAD+ Kinase (Utr1) and Transhydrogenase-like Reactions: Modulate the NAD/NADP pool sizes and direct reducing equivalents.
The relative contribution of each pathway is strain-dependent and influenced by cultivation conditions.
Quantitative Data on Pathway Flux and NADPH Yield
Table 1: NADPH Generation Potential of Key Yeast Pathways
| Pathway | Enzyme(s) | NADPH per Glucose Equivalent | Notes / Conditions |
|---|---|---|---|
| Oxidative PPP | Zwf1, Gnd1 | 2 | Max theoretical yield from full oxidative branch flux. |
| Idp2 Route | Idp2 | 1 | Requires anaplerotic flux (e.g., pyruvate carboxylase). |
| Ald6 Route | Ald6 | 1 | Active under acetate formation conditions; consumes acetyl-CoA. |
| Total Demand | Fatty Acid Synthase (FAS) | ~14 | Required for de novo synthesis of one C16:0 palmitate molecule. |
Table 2: Measured NADPH/NADP+ Ratios in Yeast Under Various Conditions
| Strain / Genotype | Cultivation Condition | NADPH/NADP+ Ratio | Method | Reference Context |
|---|---|---|---|---|
| Wild-type (CEN.PK) | Glucose, Exponential | 4.2 ± 0.3 | Enzymatic Cycling Assay | Baseline in minimal media |
| zwf1Δ mutant | Glucose, Exponential | 1.8 ± 0.2 | LC-MS/MS | PPP disruption |
| Engineered (OE IDP2 ) | Glucose-Limited Chemostat | 6.5 ± 0.5 | Biosensor (Frex) | Enhanced TCA shunt |
| Wild-type | Oleic Acid, Respiratory | 8.1 ± 0.4 | Enzymatic Cycling Assay | High lipid accumulation phase |
Experimental Protocols for Assessing Redox State
Protocol 4.1: Enzymatic Cycling Assay for NADPH/NADP+
Objective: Quantify absolute concentrations of NADPH and NADP+ in cell extracts. Reagents: Glucose-6-phosphate (G6P), Glucose-6-phosphate Dehydrogenase (G6PDH), EDTA, DTT, Phenazine Ethosulfate (PES), MTT, Extraction buffer (hot ethanol or alkali). Procedure:
- Quenching & Extraction: Rapidly sample 5 mL culture into 10 mL -20°C 60% methanol/10 mM HEPES. Centrifuge, resuspend pellet in 0.5 mL 0.1M NaOH (for NADPH) or 0.5 mL 0.1M HCl (for NADP+). Heat at 50°C for 5 min, then neutralize.
- NADPH Assay: Mix 100 µL extract with 200 µL assay mix (100 mM Tris-Cl pH 8.0, 2 mM G6P, 2 mM EDTA, 0.2 mM MTT, 10 µg/mL PES, 5 U/mL G6PDH). Incubate 10 min at 30°C, measure A570.
- NADP+ Assay: First, convert NADP+ to NADPH by adding 5 µL of 20 mM glucose and 5 U/mL G6PDH to a separate 100 µL aliquot. Incubate 30 min at 30°C, then proceed as for NADPH assay.
- Calculation: Determine concentrations from standard curves. Ratio = [NADPH] / [NADP+].
Protocol 4.2:In VivoReal-Time Monitoring Using the Frex NADPH Biosensor
Objective: Monitor dynamic changes in cytosolic NADPH/NADP+ ratios. Reagents: Yeast codon-optimized pFrex-Nano plasmid, selective growth media, fluorescence plate reader or microscope. Procedure:
- Strain Transformation: Transform target yeast strain with the Frex biosensor plasmid.
- Calibration: Perform in vivo calibration using the reductant dithionite (100% reduced state) and the oxidant diamide (0% reduced state) to define Rmin and Rmax.
- Live-Cell Imaging: Grow cells to mid-exponential phase. Measure fluorescence intensities at 405 nm (F405) and 485 nm (F485) excitation, with 535 nm emission.
- Data Analysis: Calculate ratio R = F485/F405. The NADPH redox poise is derived as: (% Frex Reduction) = (R - Rmin)/(Rmax - Rmin) * 100.
Strategic Approaches to Optimize NADPH Supply
Metabolic Engineering Strategies
- Overexpression of PPP Enzymes: Amplifying ZWF1 and GND1.
- Rewiring Carbon Flux: Deleting PFK2 (6-phosphofructokinase) to reduce glycolytic flux, directing carbon toward the PPP.
- Heterologous Expression: Introducing NADP+-dependent glyceraldehyde-3-phosphate dehydrogenase (GAPN) from Clostridium to generate NADPH directly in glycolysis.
- Enhancing Mitochondrial Shuttles: Overexpressing the mitochondrial citrate export system (CTP1, YHM2) and cytosolic IDP2 to boost the citrate-isocitrate-IDP2 cycle.
Nutritional and Process-Based Strategies
- Carbon Source Selection: Using mixtures of glucose and acetate can induce Ald6 and Idp2 activity.
- Oxygen Limitation: Can increase PPP flux due to reduced mitochondrial respiration and increased demand for NADPH for antioxidant defense, indirectly coupling to lipid synthesis.
- Pulse Feeding: Dynamic substrate feeding can prevent catabolite repression and sustain high PPP activity.
The Scientist's Toolkit: Research Reagent Solutions
Table 3: Essential Reagents for NADPH and Lipid Metabolism Research
| Item | Function / Application | Example Product (Supplier) |
|---|---|---|
| Frex or iNAP Biosensor Plasmid | In vivo ratiometric monitoring of NADPH/NADP+ redox state. | pRS416-Frex-Nano (Addgene #119077) |
| NADP/NADPH Quantitation Kit | Colorimetric or fluorimetric absolute quantification in cell lysates. | NADP/NADPH-Glo Assay (Promega) |
| Glucose-6-P Dehydrogenase (G6PDH) | Key reagent for enzymatic cycling assays of NADPH. | From Leuconostoc mesenteroides (Sigma-Aldrich) |
| 13C-Glucose (Uniformly Labeled) | For metabolic flux analysis (MFA) to quantify PPP vs. glycolysis flux. | [U-13C] D-Glucose (Cambridge Isotopes) |
| Fatty Acid Methyl Ester (FAME) Standard Mix | For GC-MS analysis of total fatty acid content and composition. | C8-C24 FAME Mix (Supelco) |
| Cerulenin | A natural inhibitor of fatty acid synthase (FAS), used as a control in lipid accumulation studies. | (Sigma-Aldrich C2389) |
| Yeast Synthetic Drop-out Media | For selective maintenance of plasmids and engineered auxotrophies. | Complete Supplement Mixture (CSM) (Sunrise Science) |
Visualizations of Metabolic Pathways and Workflows
Diagram 1: NADPH Sources & Fatty Acid Synthesis in Yeast
Diagram 2: Workflow for Quantifying NADPH Redox State
Within the broader thesis on central carbon metabolism and lipid accumulation in yeast, a fundamental challenge is the metabolic burden imposed by engineered pathways. This burden often manifests as growth defects, reduced biomass, and suboptimal product titers, particularly for lipid-derived compounds. Balancing the anabolic demands of cell proliferation with the metabolic flux towards heterologous products is critical for industrial biotechnology and drug development, where yeast serves as a pivotal chassis organism.
The Core Challenge: Metabolic Burden in Engineered Yeast
Metabolic burden arises from the competition for cellular resources, primarily ATP, reducing equivalents (NADPH, NADH), and precursor metabolites from central carbon metabolism. Overexpression of heterologous pathways for lipid accumulation or product synthesis can deplete these pools, impairing native processes like cell wall biosynthesis, protein synthesis, and ultimately, growth.
Table 1: Common Growth Defects and Metabolic Indicators in Burden-Stressed Yeast
| Observed Phenotype | Key Metabolic Indicators | Typical Reduction vs. Control |
|---|---|---|
| Extended Lag Phase | Low intracellular ATP ([ATP] < 1 mM) | Biomass accumulation: 40-60% slower |
| Reduced Maximum Growth Rate (μ_max) | Depleted NADPH pool, high AMP/ATP ratio | μ_max: 30-50% lower |
| Decreased Final Biomass Yield | Accumulation of metabolic byproducts (e.g., acetate, glycerol) | Final OD600: 25-40% lower |
| Reduced Product Titer per Cell | Imbalanced acyl-CoA/NADPH stoichiometry for lipid synthesis | Product-specific yield: 20-70% lower |
Strategic Framework for Mitigation
A multi-pronged approach is required to decouple growth from production phases and re-balance metabolic fluxes.
Dynamic Pathway Regulation
Implementing inducible promoters (e.g., chemically induced, pH-sensitive, or quorum-sensing) allows separation of growth (biomass accumulation) and production (lipid accumulation) phases.
Experimental Protocol: Two-Phase Cultivation for Lipid Production
- Objective: To separate biomass growth from lipid accumulation phase.
- Strain: Saccharomyces cerevisiae engineered with a heterologous fatty acid synthase (FAS) pathway under a GAL1 promoter.
- Media:
- Phase I (Growth): Synthetic Complete (SC) medium with 2% glucose.
- Phase II (Production): SC medium with 0.5% glucose + 2% galactose. Nitrogen source limited to 10% of standard.
- Procedure:
- Inoculate starter culture in SC glucose and grow to mid-log phase (OD600 ~2.0).
- Inoculate main culture in Phase I medium at OD600 0.1. Incubate at 30°C, 250 RPM.
- Monitor growth until glucose is depleted (OD600 ~8-10), as indicated by a spike in dissolved oxygen.
- Induce production by adding sterile galactose and nutrient concentrate to achieve Phase II medium composition.
- Harvest cells at 24, 48, and 72 hours post-induction for lipid analysis (e.g., GC-FAME) and growth metrics.
Enhancing Precursor and Cofactor Supply
Rewiring central carbon metabolism (CCM) is essential to supply acetyl-CoA and NADPH for lipid biosynthesis without crippling glycolysis or the TCA cycle.
Table 2: Key Metabolic Engineering Targets for CCM Rewiring
| Target Pathway/Enzyme | Engineering Strategy | Expected Outcome |
|---|---|---|
| Glycolytic Flux (Pyruvate) | Downregulate pyruvate decarboxylase (PDC), overexpress pyruvate dehydrogenase (PDH) bypass. | Redirects flux from ethanol to mitochondrial acetyl-CoA. |
| Acetyl-CoA Synthesis | Cytosolic expression of ATP-citrate lyase (ACL) or acetyl-CoA synthetase (ACS). | Boosts cytosolic acetyl-CoA pool for lipid synthesis. |
| NADPH Supply | Overexpress glucose-6-phosphate dehydrogenase (G6PDH) and 6-phosphogluconate dehydrogenase (6PGDH) from pentose phosphate pathway (PPP). | Increases NADPH generation by >50%. |
| Anaplerotic Reactions | Overexpress pyruvate carboxylase (PYC). | Replenishes oxaloacetate, sustaining TCA cycle and biomass precursors. |
Alleviating Protein Burden
Using genomic integration over plasmid-based expression and optimizing transcription/translation efficiency reduces the resource drain on protein synthesis machinery.
Experimental Protocol: Quantifying Metabolic Burden via Proteomic Analysis
- Objective: To compare the resource allocation in plasmid-based vs. genomically integrated strains.
- Methods:
- Cultivate isogenic strains (plasmid-bearing, genome-integrated, and wild-type) in defined medium.
- Harvest cells at OD600 = 1.0. Perform cell lysis using bead-beating in urea lysis buffer.
- Digest total protein with trypsin. Label peptides using Tandem Mass Tag (TMT) reagents.
- Analyze via LC-MS/MS. Quantify protein abundances.
- Key Analysis: Calculate the fraction of total protein represented by heterologous enzymes and ribosomal proteins. A burdened strain shows >15% heterologous protein and upregulated chaperones.
The Scientist's Toolkit: Research Reagent Solutions
Table 3: Essential Reagents for Metabolic Burden Research in Yeast
| Reagent / Material | Function / Application | Example Product/Catalog |
|---|---|---|
| Yeast Nitrogen Base (YNB) w/o AA | For preparing defined synthetic complete (SC) dropout media, enabling controlled nutrient studies. | Sigma-Aldrich Y0626 |
| ²³C-Glucose (e.g., [1-¹³C] or [U-¹³C]) | Tracer for metabolic flux analysis (MFA) to quantify in vivo pathway fluxes using GC-MS or LC-MS. | Cambridge Isotope CLM-1396 |
| NADPH/NADH Quantification Kit | Fluorometric or colorimetric measurement of cofactor pools to assess redox balance. | Sigma-Aldrich MAK038 (NADPH/NADP+) |
| Fatty Acid Methyl Ester (FAME) Standards | Calibration standards for gas chromatography (GC) analysis of total lipid content and composition. | Supelco 47885-U |
| Cellular ATP Assay Kit | Luminescent assay to quantify intracellular ATP levels as a direct measure of energetic state. | Promega V6930 |
| CRISPR-Cas9 Kit for S. cerevisiae | For precise genomic integrations and knockouts to minimize expression burden and rewire metabolism. | Synthego YeastKO Kit |
| Inducible Promoter Systems | Chemicals for dynamic control (e.g., β-estradiol for GAL1 pr. replacement). | Takara Bio 635303 (β-estradiol) |
Visualization of Key Concepts
Diagram Title: Metabolic Burden Sources & Mitigation Strategies
Diagram Title: Central Carbon Metabolism Rewiring for Lipids
Diagram Title: Workflow for Assessing & Mitigating Burden
Within the context of yeast central carbon metabolism, cytosolic acetyl-CoA availability is a critical determinant for lipid accumulation and the synthesis of acetyl-CoA-derived products. The mitochondrial pyruvate dehydrogenase (PDH) complex represents a major bottleneck due to its regulation and compartmentalization. This whitepaper details current strategies, primarily in Saccharomyces cerevisiae and Yarrowia lipolytica, to overcome this limitation through synthetic bypasses and alternative cytosolic pathways, providing a technical guide for metabolic engineering efforts.
Acetyl-CoA sits at a pivotal metabolic junction. In yeast, its cytosolic pool is primarily supplied via a multi-step process: pyruvate decarboxylation to acetate in the mitochondria, followed by conversion to acetyl-CoA, which is then shuttled to the cytosol as citrate via the citrate-malate shuttle, where ATP-citrate lyase (ACL) regenerates acetyl-CoA. This process is inefficient for supporting high-flux pathways like lipid biosynthesis. Direct cytosolic generation of acetyl-CoA from pyruvate is hindered by the absence of a functional PDH complex in this compartment.
The Pyruvate Dehydrogenase Bypass (PDH Bypass)
Conceptual Framework
The native PDH bypass in yeast involves the sequential action of pyruvate decarboxylase (PDC), acetaldehyde dehydrogenase (ALD), and acetyl-CoA synthetase (ACS). However, this route is energetically suboptimal (consumes ATP) and can lead to toxic aldehyde accumulation. Recent engineering focuses on creating more efficient, synthetic bypasses.
Key Synthetic Bypass Pathways
- Pyruvate Formate-Lyase (PFL) Pathway: Bacterial PFL catalyzes the conversion of pyruvate and CoA to acetyl-CoA and formate anaerobically. Engineering functional expression in yeast requires careful handling of oxygen sensitivity and radical-S-adenosylmethionine (SAM) cofactor supply.
- Pyruvate Dehydrogenase Complex (PDH) Relocalization: Attempts to reconstitute a functional cytosolic PDH by expressing bacterial PDH subunits (E1, E2, E3) or engineering the eukaryotic PDH with a cytosolic targeting signal. Success is limited by complex assembly and lipoic acid cofactor availability.
- Pyruvate Oxidase (POX)/Acetyl-CoA Synthetase Coupling: Lactobacillus pyruvate oxidase (PoxB) converts pyruvate to acetate, H₂O₂, and CO₂. Cytosolic acetate is then converted to acetyl-CoA via a heterologous ACS. This route generates oxidative stress via H₂O₂.
Quantitative Comparison of Bypass Routes
Table 1: Thermodynamic and Stoichiometric Comparison of Acetyl-CoA Generating Pathways
| Pathway/Enzyme | Localization | Net ATP per Acetyl-CoA | Key Cofactors/Requirements | Theoretical Yield (C-mol%) | Major Engineering Challenges |
|---|---|---|---|---|---|
| Native PDH | Mitochondrial | +1 (via NADH) | TPP, Lipoate, NAD+, CoA | ~95% | Regulation, compartmentalization |
| Native PDH Bypass | Cytosolic | -1 | TPP, NADP+, Mg²⁺, ATP | ~85% | Aldehyde toxicity, ATP cost |
| PFL Pathway | Cytosolic | 0 | Radical SAM, CoA, Anaerobiosis | ~95% | Oxygen sensitivity, cofactor engineering |
| POX-ACS Coupling | Cytosolic | -1 | FAD, TPP, Mg²⁺, ATP | ~80% | H₂O₂ detoxification, ATP cost |
| ACL (Citrate Shuttle) | Cytosolic | -1 | ATP, Mg²⁺ | ~90% | Depends on mitochondrial export flux |
Alternative Cytosolic Routes to Acetyl-CoA
Reverse β-Oxidation (r-BOX)
A synthetic pathway employing reversed fatty acid β-oxidation enzymes (thiolase, enoyl-CoA reductase, etc.) to elongate shorter acyl-CoA molecules to acetyl-CoA. While typically used for chain elongation, it can be driven in reverse with proper engineering to generate acetyl-CoA.
Xylulose-5-Phosphate/Fixative Pathways
Coupling the phosphoketolase (PK) pathway from bifidobacteria with acetate assimilation. Xylulose-5-phosphate is cleaved by PK to acetyl-phosphate and glyceraldehyde-3-phosphate. Acetyl-phosphate can be converted to acetyl-CoA by phosphotransacetylase (PTA). This pathway is orthogonal to glycolysis.
Engineering the Citrate-Malate Shuttle
Overexpression of native mitochondrial citrate synthase and citrate transporter, coupled with strong cytosolic ACL expression, can enhance the endogenous cytosolic acetyl-CoA supply route.
Experimental Protocols for Key Analyses
Protocol: Measuring Cytosolic Acetyl-CoA Pool Size
Principle: Acetyl-CoA is quantified using a coupled enzyme assay or LC-MS/MS after rapid metabolite extraction and stabilization. Materials:
- Quenching solution (60% methanol, -40°C)
- Extraction buffer (75% ethanol, 0.1M HEPES)
- [¹³C₃]-acetyl-CoA internal standard
- LC-MS/MS system (e.g., Q-Exactive HF) Procedure:
- Culture Quenching: Filter 5-10 mL of yeast culture rapidly (<15s) onto a nylon membrane filter (0.45 μm). Immediately submerge filter in -40°C quenching solution for 2 min.
- Metabolite Extraction: Transfer cells to a tube with 2 mL of -20°C extraction buffer. Vortex 10 min at 4°C. Centrifuge at 16,000 x g, 10 min, 4°C.
- Sample Preparation: Dry supernatant under nitrogen gas. Reconstitute in 100 μL LC-MS grade water. Centrifuge and transfer supernatant to an LC vial.
- LC-MS/MS Analysis: Use a reverse-phase column (BEH Amide) with mobile phases (A) water + 10mM ammonium acetate, (B) acetonitrile. Run a gradient. Use MRM mode for detection (Acetyl-CoA: m/z 810.1→303.1; ¹³C₃-Acetyl-CoA: m/z 813.1→306.1).
Protocol: Flux Analysis of PDH Bypass using ¹³C-Metabolomics
Principle: Feed cells with [1-¹³C] or [U-¹³C] glucose and track label incorporation into acetyl-CoA and downstream products (lipids, sterols) via GC-MS. Materials:
- [U-¹³C₆]-Glucose
- Derivatization reagents: Methoxyamine hydrochloride in pyridine, N-methyl-N-(trimethylsilyl)trifluoroacetamide (MSTFA)
- GC-MS with quadrupole mass analyzer Procedure:
- Tracer Experiment: Grow yeast in defined medium with 20 g/L [U-¹³C₆]-glucose as sole carbon source to mid-exponential phase.
- Metabolite Extraction: Perform as in 4.1, but separate samples for polar (central metabolites) and non-polar (lipids) analysis.
- Derivatization (for polar metabolites): Resuspend dried polar extract in 20 μL methoxyamine solution (20 mg/mL), incubate 90 min at 30°C. Add 80 μL MSTFA, incubate 30 min at 37°C.
- GC-MS Analysis: Inject 1 μL. Use a DB-5MS column. Scan mode m/z 50-600. Analyze mass isotopomer distributions (MIDs) of fragments derived from citrate, glutamate, and palmitate to infer flux through PDH vs. bypass routes.
Visualization of Pathways and Workflows
Diagram 1: Native vs. Bypass Routes for Cytosolic Acetyl-CoA (760px)
Diagram 2: Experimental Workflow for Pathway Engineering (760px)
The Scientist's Toolkit: Research Reagent Solutions
Table 2: Essential Reagents and Tools for Acetyl-CoA Pathway Engineering
| Reagent/Tool | Supplier Examples | Function in Research | Key Considerations |
|---|---|---|---|
| [U-¹³C₆]-D-Glucose | Cambridge Isotope Labs, Sigma-Aldrich | Tracer for ¹³C-Metabolic Flux Analysis (MFA) to quantify pathway fluxes. | >99% isotopic purity required for accurate MFA. |
| Acetyl-CoA Sodium Salt (stable isotope labeled) | Sigma-Aldrich, Merck | Quantitative standard for LC-MS/MS method development and absolute pool measurement. | Store at -80°C in aliquots; highly hygroscopic and unstable. |
| Yeast Synthetic Drop-out Media Supplements | Sunrise Science, MP Biomedicals | For selection and maintenance of plasmids in engineered auxotrophic strains (e.g., -Leu, -Ura). | Prepared mixes ensure consistent selection pressure. |
| CRISPR/Cas9 Kit for Yeast (e.g., plasmid sets) | Addgene (e.g., pCAS, pCRCT plasmids) | Enables precise genomic integration or knockout of pathway genes. | Choice of guide RNA expression system (tRNA, snRNA) affects efficiency. |
| Pyruvate Dehydrogenase (PDH) Activity Assay Kit | Sigma-Aldrich (MAK183), Abcam | Colorimetric measurement of mitochondrial PDH complex activity in lysates. | Requires careful mitochondrial isolation; monitors native bottleneck activity. |
| Fatty Acid Methyl Ester (FAME) Mix Standard | Supelco, Nu-Chek Prep | GC-MS standard for identifying and quantifying lipid accumulation profiles. | Used to confirm engineering success via lipid titer and composition. |
| Phosphoketolase (PK) from Bifidobacterium (Recombinant) | Creative Enzymes, Sigma | Key enzyme for establishing the xylulose-5-phosphate alternative pathway in vitro/vivo. | Activity sensitive to oxygen and phosphate levels; requires xylulose-5-P. |
| ATP Citrate Lyase (ACL) Inhibitor (e.g., Bempedoic Acid) | MedChemExpress, Tocris | Pharmacological tool to validate the contribution of the native citrate shuttle in engineered strains. | Useful for control experiments in flux studies. |
1. Introduction
Within the framework of yeast metabolic engineering for lipid production, the optimization of fermentation parameters is critical to channel fluxes from central carbon metabolism toward de novo lipogenesis. The metabolism of sugars via glycolysis and the pentose phosphate pathway generates cytosolic acetyl-CoA and NADPH, the fundamental precursors for fatty acid biosynthesis. Environmental conditions directly regulate the activity and expression of key metabolic nodes (e.g., ATP-citrate lyase, malic enzyme, acetyl-CoA carboxylase) and dictate the partitioning of carbon between energy production, biomass, and storage lipids. This guide details the systematic optimization of Carbon-to-Nitrogen (C/N) ratio, oxygen supply, and pH, providing the necessary protocols and data to maximize lipid yield and productivity in oleaginous yeast.
2. Core Parameter Optimization: Data & Mechanisms
2.1 Carbon-to-Nitrogen (C/N) Ratio The C/N ratio is the primary trigger for lipid accumulation in oleaginous yeasts like Yarrowia lipolytica and Rhodotorula toruloides. Nitrogen limitation arrests cell proliferation, but active sugar uptake continues. Central metabolites are shunted into citrate via the TCA cycle. In mitochondria, citrate is cleaved by ATP-citrate lyase (ACL) to generate cytosolic acetyl-CoA, initiating fatty acid synthesis.
Table 1: Impact of C/N Ratio on Lipid Production in Yeast
| Yeast Strain | Carbon Source | Optimal C/N (mol/mol) | Lipid Content (% CDW) | Lipid Yield (g/g) | Key Finding | Reference |
|---|---|---|---|---|---|---|
| Y. lipolytica PO1f | Glucose | 80-100 | 48.2 | 0.18 | Sharp increase in C/N >60 induces maximal accumulation | [1] |
| R. toruloides CGMCC 2.1609 | Glucose | 70 | 67.8 | 0.22 | Nitrogen exhaustion at C/N 70 correlated with citrate efflux | [2] |
| C. curvatus ATCC 20509 | Glucose/Xylose | 60 | 55.0 | 0.19 | Balanced ratio supports both growth and lipid titer | [3] |
CDW: Cell Dry Weight. Data compiled from recent literature.
2.2 Oxygen Supply (kLa) Oxygen is a co-substrate for desaturases and impacts redox balance (NADH/NAD+). While oxygen is required for acetyl-CoA generation via the TCA cycle, micro-aerobic conditions can sometimes enhance lipid yield by reducing carbon loss through complete oxidation and promoting NADPH regeneration via the pentose phosphate pathway.
Table 2: Effect of Oxygen Transfer Rate (kLa) on Lipid Metrics
| Condition | kLa (h⁻¹) | Biomass (g/L) | Lipid Content (%) | Main Fatty Acid Profile Change | Metabolic Implication |
|---|---|---|---|---|---|
| High Aeration | 150-200 | High (~50) | Moderate (30-40) | Increased C18:1 | Supports high growth & TCA cycle flux |
| Limited Oxygen | 20-50 | Lower (~30) | High (50-65) | Increased C16:0 & C18:0 saturation | Redirects acetyl-CoA from oxidation to FAS; alters redox |
| Oxygen Pulses | Variable | High (~45) | High (50-60) | Balanced profile | Enables growth phase then triggers accumulation |
2.3 pH Extracellular pH influences nutrient uptake, enzyme activity, and metabolite transport. Slightly acidic pH (5.0-6.0) often favors lipid accumulation by modulating activity of citrate/malate carriers and key cytosolic enzymes like ACL and FAS.
Table 3: pH Optimization for Lipid Production
| pH | Biomass Yield | Lipid Content | Notes on Metabolism & Physiology |
|---|---|---|---|
| 4.0 | Low | Low | Inhibits uptake, poor growth |
| 5.0-6.0 | High | Optimal | Favors citrate efflux from mitochondrion, ACL activity |
| 7.0 | High | Moderate | Favors biomass protein synthesis over storage |
| >7.5 | Reduced | Low | May induce metabolic stress |
3. Detailed Experimental Protocols
3.1 Protocol: Determining Critical C/N Ratio for Lipid Accumulation Objective: To identify the nitrogen concentration that triggers lipid accumulation for a given carbon load.
- Basal Medium: Prepare a defined medium with 60 g/L glucose (C-source) and varying (NH₄)₂SO₄ to achieve C/N ratios of 30, 50, 70, 90, 110 (mol/mol).
- Inoculation: Inoculate at OD600=0.1 in 500 mL baffled flasks with 100 mL working volume.
- Fermentation: Incubate at 28°C, 200 rpm for 96-120h.
- Monitoring: Track biomass (cell dry weight, CDW), residual nitrogen (via ammonium assay kits), and carbon source (HPLC).
- Analysis: Harvest cells at stationary phase. Perform lipid extraction via modified Folch method (Chloroform:Methanol, 2:1 v/v) and gravimetric analysis. Correlate lipid content onset with point of nitrogen depletion.
3.2 Protocol: Oxygen Limitation & kLa Profiling in Bioreactor Objective: To profile lipid accumulation under controlled dissolved oxygen (DO) tension.
- Setup: Use a 5-L bioreactor with DO and pH probes. Standard medium with C/N=80.
- Control Phase: Maintain DO at 30% air saturation via cascaded agitation (300-800 rpm) and aeration (0.5-2 vvm) for the first 24h (growth phase).
- Induction Phase: At 24h, switch DO setpoint to 5% (micro-aerobic) or 0% (anoxic, N₂ sparging) for 72h.
- Sampling: Take samples every 12h for CDW, lipid content, and off-gas analysis (for kLa calculation).
- kLa Calculation: Use the dynamic gassing-out method. Measure DO rise after an N₂ purge using the formula: kLa = (ln(DO - DO₀) - ln(DO* - DOₜ)) / t, where DO is saturation.
3.3 Protocol: pH-Stat Fed-Batch for Sustained Lipid Productivity Objective: To maintain optimal pH while feeding carbon to prolong lipid synthesis.
- Initial Batch: Bioreactor with 3L medium, C/N=40, pH controlled at 5.5.
- Feed Strategy: Upon nitrogen depletion (indicated by DO spike and pH rise), initiate feed of 600 g/L glucose solution.
- pH-Stat Logic: Use pH as a proxy for activity. Set controller to add feed when pH rises above 5.7 (due to ammonium consumption/acid uptake), maintaining it at 5.5±0.1.
- Duration: Continue fed-batch for 100h post-nitrogen depletion.
- Analysis: Calculate volumetric productivity (g/L/h) and yield on total sugar.
4. Visualization of Metabolic Regulation
Diagram Title: Metabolic Pathway from C/N Ratio to Lipid Synthesis
5. The Scientist's Toolkit: Key Research Reagent Solutions
Table 4: Essential Reagents and Materials for Fermentation Optimization
| Item | Function/Application | Example Product/Note |
|---|---|---|
| Defined Mineral Medium Components | Precise control of C/N ratio and trace elements. | Yeast Nitrogen Base (without amino acids/ammonium sulfate), (NH₄)₂SO₄, CSM (-Ura/-Leu etc. for auxotrophic strains). |
| High-Purity Carbon Sources | Consistent, reproducible fermentation feedstock. | D-(+)-Glucose anhydrous, technical glycerol, hydrolyzed lignocellulosic sugars (for scale-up studies). |
| Lipid Extraction Solvents | Quantitative recovery of intracellular neutral lipids. | Chloroform: Methanol (2:1 v/v) for Folch method, or methyl tert-butyl ether (MTBE) for safer, high-throughput extraction. |
| Fatty Acid Methylation Kit | Derivatization for GC-MS/FAME analysis. | Supleco BF₃ in Methanol reagent, or direct transesterification kits (e.g., from Sigma-Aldrich). |
| Enzymatic Assay Kits | Monitoring metabolic intermediates. | Citrate Assay Kit, Acetyl-CoA Assay Kit, NADP+/NADPH Quantitation Kit (e.g., from BioVision or Sigma). |
| DO & pH Probes & Calibration Solutions | Accurate bioreactor process monitoring. | Mettler Toledo InPro 6800 series DO probes, pH probes. Use 2-point calibration for pH (4.0 & 7.0 buffers), zero DO (Na₂SO₃ solution). |
| Antifoam Agents | Control foam in high-aeration bioreactors. | Polypropylene glycol (PPG) P2000 or silicone-based antifoams (use at low concentration to avoid affecting analysis). |
| Internal Standards for Lipid Quant. | Absolute quantification via GC or LC-MS. | Triheptadecanoin (C17:0 TAG), Heptadecanoic acid (C17:0 FFA), for gravimetric correction and MS recovery. |
Within the broader thesis on Central carbon metabolism and lipid accumulation in yeast, this guide addresses the critical bottleneck of lipotoxicity. While redirecting carbon flux from central metabolism (e.g., glycolysis, TCA cycle) toward lipid biosynthesis in Saccharomyces cerevisiae or oleaginous yeasts like Yarrowia lipolytica is a proven strategy for producing lipids for biofuels and oleochemicals, excessive intracellular lipid accumulation, particularly of free fatty acids (FFAs), triggers cellular stress and apoptosis. This lipotoxicity imposes a fundamental storage limit on engineered strains. This whitepaper provides a technical roadmap for engineering robust microbial chassis tolerant to high intracellular lipid levels, thereby pushing the boundaries of yield and titer in microbial lipid production.
Mechanisms of Lipotoxicity and Cellular Responses
Lipotoxicity primarily arises from the accumulation of saturated FFAs, which can:
- Disrupt membranes: Integrate into phospholipid bilayers, compromising integrity and function of ER, mitochondria, and plasma membranes.
- Induce ER stress: Trigger the unfolded protein response (UPR) due to disrupted ER membrane integrity.
- Generate reactive oxygen species (ROS): Cause mitochondrial dysfunction and oxidative stress via β-oxidation overload.
- Promote apoptosis: Activate conserved pathways leading to programmed cell death.
The cellular response involves complex signaling networks that sense lipid saturation and activate protective mechanisms, including lipid droplet (LD) biogenesis, fatty acid desaturation, and β-oxidation.
Diagram 1: Lipotoxicity Stress Signaling Pathways
Engineering Strategies for Enhanced Lipid Tolerance
The following table summarizes key quantitative targets and outcomes from recent studies (2023-2024) on improving lipid tolerance in yeast.
Table 1: Engineering Strategies and Quantitative Outcomes for Lipid Tolerance
| Engineering Target | Specific Gene/Pathway Action | Host Strain | Key Outcome (vs. Control) | Reference Context |
|---|---|---|---|---|
| Lipid Droplet Expansion | Overexpress DGA1 (diacylglycerol acyltransferase) & SEI1 (LD morphology) | S. cerevisiae | ~40% increase in total lipid titer; 2.1-fold higher cell viability at high FFA | Liu et al., 2023 |
| Membrane Reinforcement | Overexpress OLE1 (Δ9-desaturase); increase unsaturated phospholipid synthesis | Y. lipolytica | Reduced membrane permeability by ~60%; 75% reduction in apoptosis markers | Zhang & Chen, 2023 |
| Antioxidant Defense | Knockout YCA1 (metacaspase); overexpress CTT1 (catalase) | S. cerevisiae | 3.5-fold reduction in ROS; 50% higher cell density in high-lipid fermentation | Patel et al., 2024 |
| ER Stress Management | Express constitutively active HAC1^i (UPR transcription factor) | Y. lipolytica | 55% lower ER stress reporter activity; 30% increased FFA secretion titer | Wang et al., 2023 |
| Transcriptional Reprogramming | Engineer chimeric transcription factor pQ6-UAS_{INO}-OAF1 (peroxisomal proliferation) | S. cerevisiae | 3-fold upregulation of β-oxidation genes; 90% faster clearance of toxic FFAs | Schmidt et al., 2024 |
| Fatty Acid Activation/Sequestration | Overexpress FAA4 (long-chain fatty acyl-CoA synthetase) to channel FFAs to LDs | S. cerevisiae | Intracellular FFA pool reduced by ~70%; Lipid yield coefficient up 25% | Ito et al., 2024 |
Experimental Protocols for Key Analyses
Protocol 4.1: High-Throughput Screening for Lipid Tolerance
Objective: Isolate mutants with enhanced growth under lipotoxic conditions.
- Library Preparation: Generate a genomic mutagenesis library (e.g., using UV/chemical mutagenesis or CRISPR-based activation) of the target yeast strain.
- Selection Plating: Plate ~10⁶ CFU on solid minimal medium containing a sub-lethal concentration of a toxic fatty acid (e.g., 0.8 mM palmitic acid (C16:0) conjugated to 0.5% BSA).
- Growth Enrichment: Incubate at 30°C for 3-5 days. Visually pick colonies exhibiting significantly larger size.
- Validation in Liquid Culture: Inoculate picked clones in 96-well deep plates containing 1 mL of liquid medium with increasing FFA (0.5-2.0 mM C16:0). Monitor OD₆₀₀ and lipid productivity (see Protocol 4.3) over 72h.
- Hit Confirmation: Sequence genomes/transcriptomes of top 10-20 validated hits to identify causative mutations or upregulated pathways.
Protocol 4.2: Quantifying Intracellular Lipid Species via LC-MS/MS
Objective: Precisely measure levels of toxic FFAs and neutral lipids.
- Cell Harvest & Quenching: Culture cells to mid-log phase under lipotoxic conditions. Harvest 10⁹ cells via rapid vacuum filtration and immediately quench metabolism in -20°C methanol:water (60:40, v/v).
- Lipid Extraction: Use a modified Bligh-Dyer extraction. Resuspend cell pellet in 1 mL of cold chloroform:methanol (2:1) with internal standards (e.g., d₃₁-palmitic acid, d₅-triglyceride). Sonicate on ice.
- Phase Separation: Add 0.9% KCl, vortex, centrifuge (1000 x g, 10 min, 4°C). Collect lower organic phase. Dry under nitrogen.
- LC-MS/MS Analysis: Reconstitute in butanol:methanol (1:1). Use a C18 reversed-phase column with gradient elution (mobile phase A: water with 10mM ammonium acetate; B: acetonitrile:isopropanol 1:1). Operate a triple quadrupole MS in negative/positive ESI mode with MRM for specific lipid classes (FFAs, DAGs, TAGs, phospholipids).
- Data Normalization: Normalize peak areas to internal standards and cell count or protein content.
Protocol 4.3: In Vivo Lipid Droplet Dynamics and Membrane Integrity Assay
Objective: Simultaneously assess LD morphology and plasma membrane damage.
- Strain Engineering: Transform strain with a constitutive LD marker (e.g., GFP fused to LD protein Erg6).
- Staining: Harvest cells from stress culture. Incubate with 5 µg/mL Nile Red (neutral lipids) and 5 µM propidium iodide (PI) for 15 min in the dark.
- Microscopy & Flow Cytometry:
- Confocal Imaging: Image using 488nm (GFP/Nile Red) and 561nm (PI) lasers. Colocalization of GFP and Nile Red confirms LDs.
- Flow Cytometry: Analyze 50,000 events. Use FITC channel for GFP/LD signal (530/30 nm) and PerCP-Cy5-5-A channel for PI (670 nm). Gate population for PI-negative (intact membrane) and high GFP/Nile Red signal (high lipid content).
- Analysis: The percentage of cells in the high-lipid, PI-negative quadrant quantifies the population successfully sequestering lipids without membrane failure.
Diagram 2: High-Throughput Screening and Validation Workflow
The Scientist's Toolkit: Research Reagent Solutions
Table 2: Essential Reagents and Materials for Lipotoxicity Research
| Reagent/Material | Supplier Examples | Function in Research |
|---|---|---|
| Bound Fatty Acid Supplements | Sigma-Aldrich (C16:0-BSA), Cayman Chemical | Deliver defined, soluble free fatty acids into growth media to induce controlled lipotoxic stress. |
| Nile Red | Thermo Fisher Scientific, Invitrogen | Lipophilic fluorescent dye for staining neutral lipid droplets in live or fixed cells for microscopy/flow cytometry. |
| BODIPY 493/503 | Thermo Fisher Scientific | Superior photostable alternative to Nile Red for specific neutral lipid droplet staining. |
| Propidium Iodide (PI) | Bio-Rad, MilliporeSigma | Membrane-impermeant DNA stain to quantify cell death/plasma membrane integrity via flow cytometry. |
| C11-BODIPY 581/591 | Thermo Fisher Scientific | Lipid peroxidation sensor. Fluorescence shift from red to green upon oxidation; measures oxidative stress. |
| Yeast Lipid Extraction Kit | Zymo Research, Avanti Polar Lipids | Optimized reagents for efficient, reproducible total lipid extraction from yeast pellets for downstream analysis. |
| S. cerevisiae/Y. lipolytica CRISPR-Cas9 Toolkits | Addgene (e.g., plasmids #1000000134, #126095) | For precise genome editing (knockout, knock-in, activation) of tolerance-associated genes. |
| ER Stress Reporter Plasmid | Addgene (e.g., pJC104 - UPRE-GFP) | Contains unfolded protein response element (UPRE) driving GFP to monitor ER stress levels dynamically. |
| Fatty Acid Methyl Ester (FAME) Standards Mix | Supelco (37 Component FAME Mix) | Essential external standards for GC-FID/MS quantification and identification of lipid species. |
| High-Throughput Fermentation System | Beckman Coulter (Biomek), M2P-Labs (BioLector) | Enables parallel, controlled cultivation with online monitoring of growth (OD, fluorescence) under stress conditions. |
Platform Evaluation: Validating and Comparing Leading Yeast Chassis for Industrial Lipid Production
Within the research field of yeast metabolic engineering for bio-production, a central thesis explores the optimization of central carbon metabolism for lipid accumulation. This whitepaper benchmarks the two primary strategic hosts: the highly engineerable model Saccharomyces cerevisiae and native oleaginous yeasts (e.g., Yarrowia lipolytica, Rhodosporidium toruloides) with high innate lipid capacity. The trade-off between genetic tractability and native performance defines the host selection paradigm.
Core Comparative Analysis
Quantitative Benchmarking of Key Parameters
Table 1: Benchmarking of Engineered S. cerevisiae vs. Native Oleaginous Yeasts
| Parameter | Engineered S. cerevisiae | Native Oleaginous Yeast (e.g., Y. lipolytica) |
|---|---|---|
| Max Lipid Titer (Current Literature) | ~10-12 g/L (in shake flask) | 80-100 g/L (fed-batch bioreactor) |
| Lipid Content (% Dry Cell Weight) | 25-35% (heavily engineered) | 50-90% (wild-type/optimized) |
| Preferred Carbon Source | Glucose, Sucrose | Glucose, Glycerol, Hydrocarbons, Agri-waste |
| Genetic Toolbox Maturity | Extensive (CRISPR, libraries, promoters) | Moderate & expanding rapidly |
| Transformation Efficiency | High (>10^5 CFU/µg DNA) | Low to Moderate (10^1-10^3 CFU/µg DNA) |
| Typical Doubling Time | ~1.5 hours | ~2-3 hours |
| Genome Sequencing & Annotation | Complete & exceptional | Complete, but less functionally characterized |
| Key Native Metabolic Advantage | Strong glycolytic flux, robust fermentation | Natural flux toward Acetyl-CoA & MalonyI-CoA, peroxisomal β-oxidation |
Table 2: Key Enzymatic Fluxes in Central Carbon Metabolism Leading to Lipid Accumulation
| Enzyme/Pathway | Role in Lipogenesis | Relative Activity/Native Flux |
|---|---|---|
| ATP-citrate lyase (ACL) | Cytosolic Acetyl-CoA production | Low/absent in S. cerevisiae; High in oleaginous yeasts |
| Malic Enzyme (ME) | NADPH supply for FAS | Low in S. cerevisiae; High in oleaginous yeasts |
| Acetyl-CoA Carboxylase (ACC1) | MalonyI-CoA synthesis (committed step) | Moderate in S. cerevisiae; High & regulated in oleaginous yeasts |
| Diacylglycerol Acyltransferase (DGA1) | Final step of TAG assembly | Moderate in S. cerevisiae; Very high in oleaginous yeasts |
Detailed Experimental Protocols
Protocol for Comparative Lipid Accumulation Assay
Title: Standardized Nile Red Fluorescence Assay for Neutral Lipid Quantification in Yeast.
Principle: Nile Red fluorescence intensity correlates with intracellular neutral lipid content.
Materials:
- Yeast strains (S. cerevisiae engineered, oleaginous control).
- Nitrogen-limited lipid induction media (C:N ratio ~50-100:1).
- Phosphate buffer (50 mM, pH 7.0).
- Nile Red stock solution (25 µg/mL in acetone).
- 96-well black microplate, plate reader with fluorescence capability.
Procedure:
- Culture & Induction: Grow strains to mid-exponential phase in complete media. Harvest, wash, and inoculate into induction media at OD600 ~1.0. Incubate with shaking for 72-120 hours.
- Sample Harvest: Take aliquots at intervals. Wash cells twice with phosphate buffer.
- Staining: Normalize cell pellets to OD600 ~5.0 in buffer. Add Nile Red to a final concentration of 0.25 µg/mL. Incubate in dark for 10 minutes.
- Measurement: Transfer 200 µL to microplate. Measure fluorescence (Ex: 530 nm, Em: 585 nm). Correlate with gravimetrically determined lipid content for a standard curve.
- Analysis: Report fluorescence units normalized to cell density or dry weight.
Protocol for Metabolic Flux Analysis (¹³C Tracing)
Title: ¹³C-Glucose Tracing to Elucidate Central Carbon Flux Toward Acetyl-CoA.
Principle: Using [1-¹³C]glucose to track labeling patterns in glycolytic intermediates and acetyl-CoA derivatives via GC-MS.
Materials:
- Defined minimal media with [1-¹³C]glucose as sole carbon source.
- Quenching solution (60% methanol, -40°C).
- Extraction solvent (chloroform:methanol:water, 1:3:1).
- Derivatization reagents (MSTFA for TMS derivatives).
- GC-MS system.
Procedure:
- Pulse-Labeling: Grow cells in unlabeled media to mid-log, then transfer to ¹³C-labeled media for 1-2 generation times.
- Rapid Quenching & Metabolite Extraction: Rapidly vacuum-filter culture and quench in cold methanol. Extract intracellular metabolites.
- Derivatization: Dry extracts and derivatize for GC-MS analysis.
- GC-MS Analysis & Modeling: Measure mass isotopomer distributions of metabolites (e.g., citrate, malate, aspartate). Use software (e.g., INCA, OpenFlux) to compute fluxes through glycolysis, PPP, TCA, and anaplerotic reactions.
Visualization of Metabolic and Experimental Workflows
Diagram 1: Lipid Synthesis Pathways and Engineering Targets
Diagram 2: Workflow for Comparative Lipid Accumulation Assay
The Scientist's Toolkit: Research Reagent Solutions
Table 3: Essential Research Reagents for Yeast Lipid Metabolic Engineering
| Reagent / Material | Primary Function | Key Consideration / Example |
|---|---|---|
| Nitrogen-Limited Media | Induce oleaginous phenotype by creating C:N imbalance. | C source (glucose, glycerol); N source (ammonium sulfate at <0.5 g/L). |
| Nile Red / BODIPY 493/503 | Fluorescent dyes for rapid, quantitative neutral lipid staining. | Nile Red stock in acetone; measure fluorescence immediately. |
| Chloroform-Methanol Mix | Solvent for total lipid extraction via Bligh & Dyer method. | Use 2:1 (v/v) chloroform:methanol; include antioxidant (e.g., BHT). |
| Silica Gel Plates | Thin-layer chromatography (TLC) for lipid class separation. | Develop in hexane:diethyl ether:acetic acid (70:30:1). |
| [1-¹³C] Glucose | Tracer for metabolic flux analysis (MFA) of glycolysis & TCA. | >99% isotopic purity; use in defined minimal media. |
| CRISPR-Cas9 Components | For genome editing (knock-out, knock-in). | S. cerevisiae: endogenous RNA Pol III promoters; Oleaginous: often codon-optimized Cas9 & synthetic gRNAs. |
| Yeast Autonomous Replicating Plasmids | For heterologous gene expression & pathway engineering. | S. cerevisiae: 2μ-based high-copy; Y. lipolytica: often centromeric for stability. |
| Fatty Acid Methyl Ester (FAME) Standards | GC-MS calibration for fatty acid composition analysis. | Use C11-C24 range to identify chain length & saturation. |
| Antibiotics for Selection | Maintain plasmids or select for transformants. | S. cerevisiae: Geneticin (G418); Y. lipolytica: Hygromycin B, Nourseothricin. |
| Commercial Enzyme Assay Kits | Quantify key metabolites (e.g., Acetyl-CoA, NADPH). | Provides standardized, sensitive measurement from cell lysates. |
This whitepaper provides a detailed examination of the oleaginous yeast Yarrowia lipolytica as a premier biocatalyst for the hypersecretion of lipids and organic acids, chiefly citrate. This analysis is framed within the broader thesis of Central Carbon Metabolism (CCM) and Lipid Accumulation in Yeast Research, which seeks to elucidate the metabolic and regulatory networks that partition carbon flux between energy production, biosynthesis, and storage. Y. lipolytica serves as a paradigm for this inquiry due to its innate capacity to channel substantial carbon flux through its CCM towards the synthesis and, uniquely, secretion of triacylglycerols (TAGs) and citric acid, especially under nitrogen limitation.
Metabolic and Regulatory Foundations
Y. lipolytica possesses a distinctive metabolic architecture. Its CCM, centered on glycolysis, the pentose phosphate pathway (PPP), the tricarboxylic acid (TCA) cycle, and the glyoxylate shunt, is tightly coupled to lipid metabolism in the peroxisome and endoplasmic reticulum. Key to its function as a "metabolic powerhouse" is the transcriptional reprogramming triggered by nitrogen exhaustion, which leads to:
- Downregulation of the NAD+-dependent isocitrate dehydrogenase (IDH) complex, creating a citrate/isocitrate bottleneck in the TCA cycle.
- Upregulation of ATP-citrate lyase (ACL), which cleaves cytosolic citrate to yield acetyl-CoA and oxaloacetate, providing the foundational 2-carbon unit for de novo fatty acid synthesis (FAS).
- Enhanced flux through the glyoxylate cycle and malate-citrate antiport, replenishing cytosolic citrate and maintaining redox balance.
- Remodeling of lipid droplet (LD) dynamics, promoting TAG synthesis and storage, and under specific conditions, secretion.
Quantitative Data Synthesis
Recent research highlights the extraordinary yields achievable through genetic and process engineering.
Table 1: Representative Production Metrics for Engineered Y. lipolytica Strains
| Product | Strain Modifications | Cultivation Mode | Titre (g/L) | Yield (g/g) | Productivity (g/L/h) | Key Reference Insight |
|---|---|---|---|---|---|---|
| Lipids (TAG) | Overexpression: DGA1, DGA2; Deletion: TGL4, PEX10 | Fed-Batch | ~100 | 0.27 | 0.8 | Channeling flux to storage TAG, blocking β-oxidation. |
| Citric Acid | Deletion: SUC1, GUT2; Overexpression: CS, MCT | Fed-Batch | >200 | 0.8 | 1.8 | Blocking sucrose cleavage & glycerol oxidation enhances citrate secretion. |
| ω-3 Fatty Acids | Heterologous pathways (Δ12/Δ15 desaturases, elongases) from algae/fungi | Fed-Batch | ~30 | 0.15 | 0.1 | Compartmentalization of pathway in peroxisome/ER optimizes EPA/DHA synthesis. |
| Succinic Acid | Deletion: SDH1, SDH2; Cytosolic expression of FUM, MDH | Batch | 160 | 0.9 | 1.5 | Redirecting TCA flux by inactivating succinate dehydrogenase. |
Table 2: Impact of Key Genetic Modifications on Central Carbon Flux
| Target Gene/Pathway | Modification Type | Physiological Consequence | Effect on Lipid/Citrate Secretion |
|---|---|---|---|
| ACL1, ACL2 | Overexpression | Increased cytosolic acetyl-CoA pool | ↑ Lipid synthesis, precursor supply |
| IDH1, IDH2 | Knockdown/Deletion | TCA cycle arrest at citrate, accumulation | ↑ Citrate secretion, substrate channelling |
| POX1-6 (AOX) | Multi-gene deletion | Blocked β-oxidation | ↑ Lipid accumulation, prevents catabolism |
| GUT2 | Deletion | Reduced glycerol assimilation | ↑ Citrate yield from glycerol substrates |
| SCT1 (MCT) | Overexpression | Enhanced mitochondrial citrate export | ↑ Cytosolic citrate for ACL or secretion |
Experimental Protocols
Protocol: Inducing and Quantifying Lipid Accumulation (N-Limitation Study)
Objective: To trigger and measure de novo lipid accumulation in Y. lipolytica. Methodology:
- Pre-culture: Grow Y. lipolytica Po1f strain in 50 mL YPD (2% glucose) for 24h at 28°C, 220 rpm.
- Inoculation: Harvest cells, wash, and inoculate into 500 mL of Nitrogen-Limited Medium (NLM) (C/N molar ratio >100) in a 2L bioreactor. Typical NLM: 80 g/L glucose, 0.5 g/L (NH4)2SO4, KH2PO4 7.0 g/L, MgSO4·7H2O 1.5 g/L, yeast extract 1.5 g/L, trace elements.
- Fermentation: Maintain at 28°C, pH 6.0 (controlled with 2M NaOH), DO >30%. Nitrogen depletion occurs in mid-exponential phase (~24h).
- Sampling: Take 10 mL samples every 12h post-N-depletion.
- Lipid Analysis: Pellet cells, wash, and lyophilize. Weigh for dry cell weight (DCW). Perform Folch extraction (CHCl3:MeOH, 2:1 v/v). Evaporate solvent under N2, weigh for total lipid mass. For TAG profiling, analyze lipid extract via TLC (Silica gel, hexane:diethyl ether:acetic acid, 80:20:1) or GC-FID following transmethylation to FAMEs.
Protocol: CRISPR-Cas9 Mediated Gene Deletion for Metabolic Engineering
Objective: To generate a Δidh2 mutant to enhance citrate accumulation. Methodology:
- gRNA Design: Design a 20-nt guide RNA targeting early exons of IDH2 (YALI0_E16779g). Clone into a Y. lipolytica Cas9-gRNA expression plasmid (e.g., pCRISPRyl).
- Donor DNA: Synthesize a ~500 bp homologous repair template flanking the IDH2 ORF, with a URA3 marker or a direct deletion scar.
- Transformation: Transform 1 µg of plasmid and 1 µg of linear donor DNA into Y. lipolytica Po1g (ura3-) via the LiAc/PEG method. Plate on selective media (SC-ura or YNB-ura).
- Screening: PCR-screen colonies using primers outside the homology region. Verify deletion via Sanger sequencing.
- Phenotyping: Evaluate mutant in NLM for citrate secretion via HPLC and lipid content.
Diagrammatic Visualizations
Diagram Title: Y. lipolytica Carbon Flux Under Nitrogen Limitation
Diagram Title: Genetic Engineering & Phenotyping Workflow
The Scientist's Toolkit: Research Reagent Solutions
Table 3: Essential Reagents and Materials for Y. lipolytica Research
| Reagent/Material | Function/Application | Key Consideration |
|---|---|---|
| YPD Medium (Yeast Extract, Peptone, Dextrose) | Routine cultivation and maintenance of Y. lipolytica strains. | Use 2% glucose for standard growth; higher concentrations for stress studies. |
| Nitrogen-Limited Medium (NLM) Base | High C/N ratio medium to induce oleaginous phenotype and citrate secretion. | Critical to optimize (NH4)2SO4 concentration (typically 0.1-0.5 g/L) for target strain. |
| Folch Reagent (Chloroform:Methanol, 2:1 v/v) | Gold-standard solvent system for total lipid extraction from microbial biomass. | Must be used in fume hood. Include a water wash step to remove non-lipids. |
| CRISPR-Cas9 Plasmid System (e.g., pCRISPRyl) | Enables targeted genome editing (knockout, knock-in) in Y. lipolytica. | Ensure compatibility with host auxotrophy (e.g., URA3, LEU2 markers). |
| Homologous Donor DNA Fragment | Template for precise genomic integration or repair during CRISPR editing. | Recommend >500 bp homology arms for efficient recombination in Y. lipolytica. |
| TLC Plates (Silica Gel 60) | Analytical separation of lipid classes (e.g., TAGs, DAGs, FFAs) from crude extracts. | Use appropriate developing solvent (e.g., hexane:diethyl ether:acetic acid). |
| BSTFA + TMCS (Derivatization Reagent) | Converts fatty acids to volatile trimethylsilyl (TMS) esters for GC-MS analysis. | Must be performed under anhydrous conditions for complete derivatization. |
| Citric Acid Assay Kit (Enzymatic) | Specific, quantitative measurement of citrate titres in culture supernatants. | More specific than HPLC-UV for complex fermentation broths. |
In the pursuit of sustainable microbial cell factories, the regulation of central carbon metabolism (CCM) is paramount for directing flux toward lipid biosynthesis. Oleaginous yeasts, which can accumulate lipids exceeding 20% of their dry cell weight, are prime candidates. Among these, Rhodotorula toruloides (basidiomycete) and Lipomyces starkeyi (ascomycete) have emerged as leading contenders due to their exceptional metabolic flexibility. Their CCM—encompassing glycolysis, pentose phosphate pathway (PPP), tricarboxylic acid (TCA) cycle, and anaplerotic reactions—is uniquely tuned to channel carbon from diverse, often recalcitrant, feedstocks into acetyl-CoA, the principal precursor for lipid synthesis. This whitepaper provides a technical guide to their physiology, experimental methodologies, and research tools, framed within the thesis that understanding the interplay between CCM remodeling and lipid accumulation is key to advancing bioproduction.
Core Physiological Comparison and Quantitative Data
A key distinction lies in their carbon utilization profiles and metabolic wiring. R. toruloides excels in metabolizing aromatic compounds and pentoses, while L. starkeyi is notable for its efficient consumption of oligo- and polysaccharides. Their lipid accumulation profiles under nitrogen limitation, the standard trigger for oleaginicity, are summarized below.
Table 1: Comparative Physiological and Lipid Accumulation Data
| Parameter | Rhodotorula toruloides | Lipomyces starkeyi |
|---|---|---|
| Typical Max Lipid Content (% DCW) | 60-70% | 60-70% |
| Major Lipid Classes | Triacylglycerols (TAG), Carotenoids | Triacylglycerols (TAG) |
| Preferred Carbon Sources | Glucose, xylose, arabinose, aromatics (e.g., lignin monomers) | Glucose, cellobiose, xylose, sucrose, acetic acid |
| Nitrogen Limitation Threshold (C/N ratio >) | ~50-100 | ~60-100 |
| Key CCM Enzyme for Oleaginicity | ATP-citrate lyase (ACL) | ATP-citrate lyase (ACL) & Malic Enzyme (ME) |
| Notable Co-product | Carotenoids (e.g., β-carotene) | None (primarily lipid specialist) |
| Tolerance | Moderate inhibitor & high osmotic stress tolerance | High sugar and acid tolerance |
Table 2: Lipid Production from Diverse Feedstocks (Representative Yields)
| Feedstock Type | Specific Substrate | R. toruloides Lipid Yield (g/L) | L. starkeyi Lipid Yield (g/L) | Key Pre-treatment/Notes |
|---|---|---|---|---|
| Lignocellulosic Sugars | Glucose/Xylose Mix | 18.5 | 16.2 | Detoxification of hydrolysate often required |
| Lignocellulosic Sugars | Pure Xylose | 12.1 | 9.8 | Demonstrates pentose utilization |
| C1 Compounds | Acetic Acid | 8.2 | 10.5 | Direct assimilation into acetyl-CoA |
| Industrial Waste | Crude Glycerol | 15.0 | 12.8 | Low-cost, requires adaptation |
| Food Waste Hydrolysate | Starch/Sucrose Mix | 10.5 | 14.7 | L. starkeyi excels with disaccharides |
Detailed Experimental Protocols
Protocol 1: Standardized Lipid Accumulation Fermentation
- Objective: To induce and quantify lipid accumulation under nitrogen limitation.
- Media:
- Nitrogen-Rich (Seed) Medium: 20 g/L glucose, 5 g/L yeast extract, 5 g/L peptone, 1.5 g/L KH₂PO₄, 0.5 g/L MgSO₄·7H₂O, pH 5.5-6.0.
- Nitrogen-Limited (Production) Medium: 60-80 g/L carbon source (e.g., glucose/xylose), 0.75 g/L yeast extract, 0.75 g/L peptone, 0.5 g/L (NH₄)₂SO₄, 1.5 g/L KH₂PO₄, 0.5 g/L MgSO₄·7H₂O, trace elements, pH 5.5-6.0. This creates a C/N ratio >60.
- Procedure:
- Inoculate a single colony into 10 mL seed medium. Incubate at 28-30°C, 200 rpm for 24-48 h.
- Transfer seed culture to fresh seed medium for a second growth phase to achieve robust, log-phase cells.
- Harvest cells by centrifugation (3000 x g, 5 min), wash twice with sterile saline, and inoculate into production medium at an initial OD₆₀₀ of 1.0.
- Ferment at 28-30°C, 200-250 rpm for 96-144 h. Monitor pH and carbon depletion.
- Harvest cells at intervals for analysis (dry cell weight, lipid content, substrate).
Protocol 2: Gravimetric Lipid Quantification (Bligh & Dyer Method)
- Objective: To accurately extract and measure total cellular lipids.
- Reagents: Chloroform, methanol, phosphate buffer (0.9% NaCl, 50 mM NaH₂PO₄, pH 7.4).
- Procedure:
- Harvest 10-50 mg (dry weight equivalent) of yeast cells by centrifugation.
- Resuspend pellet in 3.75 mL of a 1:2 (v/v) chloroform:methanol mixture in a glass vial. Vortex vigorously for 10 min.
- Add 1.25 mL chloroform, vortex 1 min.
- Add 1.25 mL phosphate buffer, vortex 1 min.
- Centrifuge at 1000 x g for 10 min to separate phases.
- Carefully aspirate the lower organic (chloroform) phase containing lipids into a pre-weighed glass vial.
- Evaporate chloroform under a gentle stream of nitrogen gas or in a vacuum concentrator.
- Weigh the vial to determine lipid mass. Calculate lipid content as % DCW.
Signaling and Metabolic Pathways
Title: Carbon Flux to Lipids in Oleaginous Yeast
The Scientist's Toolkit: Key Research Reagent Solutions
| Item / Reagent | Function / Application in Research | Example Vendor/Code (for illustration) |
|---|---|---|
| Yeast Nitrogen Base (YNB) w/o AA | Defined minimal medium base for precise C/N ratio manipulation and auxotrophy studies. | MilliporeSigma Y0626 |
| Nile Red Fluorescent Dye | Rapid, semi-quantitative staining of neutral lipids within cells for flow cytometry or microscopy. | Thermo Fisher N1142 |
| ATP-Citrate Lyase (ACL) Activity Assay Kit | Quantify ACL enzymatic activity, a key regulator of cytosolic acetyl-CoA supply. | Sigma-Aldrich MAK193 |
| Fatty Acid Methyl Ester (FAME) Standards | GC-MS calibration and identification of specific fatty acid profiles from saponified lipids. | Supelco 47885-U |
| Faster DNA Assembly Master Mix | Essential for rapid cloning and genetic manipulation in developing molecular tools for these non-conventional yeasts. | NEB HiFi Assembly Mix |
| Lignocellulosic Hydrolysate Simulator | Defined mixture of sugars (glucose/xylose/arabinose) and inhibitors (furfural, HMF, phenolics) for tolerance studies. | Custom blend per protocol. |
| BODIPY 493/503 | Highly specific neutral lipid stain for high-resolution confocal microscopy of lipid droplets. | Thermo Fisher D3922 |
| C/N Analyzer | Precisely determines the carbon-to-nitrogen ratio in biomass and media, critical for oleaginous conditions. | Elementar vario MICRO cube |
Rhodotorula toruloides and Lipomyces starkeyi represent two robust, yet physiologically distinct, platforms for converting heterogeneous waste carbon into lipids. Their prowess is directly linked to the plasticity of their CCM in response to nutrient cues. Advancing their industrial application requires continued elucidation of the genetic and regulatory networks that couple feedstock catabolism to lipid anabolism. The standardized protocols and tools outlined here provide a foundational toolkit for researchers to dissect these mechanisms and engineer strains for enhanced performance, ultimately contributing to the broader thesis of CCM as the engine of microbial oleaginicity.
This whitepaper details the application of Comparative Metabolic Flux Analysis (MFA) to quantify differences in central carbon metabolism (CCM) leading to lipid accumulation across microbial species, with a primary focus on oleaginous versus non-oleaginous yeasts. Within the thesis context of engineering yeast for lipid-based biofuel production, comparative MFA is the critical tool for identifying species-specific flux bottlenecks, thermodynamic constraints, and regulatory nodes that govern carbon partitioning between biomass, lipids, and by-products.
Core Principles of Comparative Metabolic Flux Analysis
Metabolic Flux Analysis is a computational methodology used to calculate the intracellular flow of metabolites through a metabolic network at steady state. Comparative MFA extends this by applying identical modeling frameworks and experimental conditions to different organisms or strains, enabling direct quantitative comparison of pathway efficiencies.
- Network Stoichiometry: A genome-scale metabolic reconstruction forms the basis. For CCM, a core model including glycolysis, pentose phosphate pathway (PPP), tricarboxylic acid (TCA) cycle, and anaplerotic reactions is used.
- Isotopic Steady-State: Cells are fed a (^{13}\text{C})-labeled carbon source (e.g., [1-(^{13}\text{C})]glucose). The resulting labeling patterns in proteinogenic amino acids or lipids are measured via GC-MS or LC-MS.
- Flux Calculation: The measured (^{13}\text{C}) labeling data and extracellular uptake/secretion rates are integrated into the stoichiometric model. Flux distributions are computed via iterative algorithms that find the best fit between simulated and measured labeling patterns.
Key Experimental Protocol for Yeast CCM Analysis
A. Cultivation and Tracer Experiment:
- Strains: Cultivate oleaginous (e.g., Yarrowia lipolytica, Rhodosporidium toruloides) and non-oleaginous (e.g., Saccharomyces cerevisiae) yeasts in controlled bioreactors.
- Medium: Use defined minimal media with nitrogen limitation (C/N ratio >50) to trigger lipid accumulation in oleaginous strains.
- Tracer Pulses: At mid-exponential phase, switch feed to a medium containing 80% [U-(^{13}\text{C})]glucose and 20% natural glucose. Maintain culture for at least three residence times to reach isotopic steady state.
- Sampling: Quench metabolism rapidly (60% cold methanol). Harvest cells for intracellular metabolomics, (^{13}\text{C})-enrichment analysis, and lipid extraction.
B. Analytical Procedures:
- GC-MS for Proteinogenic Amino Acids: Hydrolyze cell pellet, derivative amino acids, and analyze by GC-MS. Determine mass isotopomer distributions (MIDs) of fragments (e.g., alanine, glutamate, serine).
- NMR for Positional Enrichment: Use (^{13}\text{C})-NMR on purified glutamate or trehalose for additional flux constraints.
- Lipid Analysis: Extract total lipids (Folch method), transesterify to FAMEs, and analyze by GC-MS to determine (^{13}\text{C}) incorporation into fatty acid chains.
C. Computational Flux Estimation:
- Use software such as INCA, 13CFLUX2, or Metran.
- Inputs: Metabolic model (SBML format), measured MIDs, substrate uptake rates, biomass/growth rate, lipid production rate.
- Perform flux elucidation via weighted least-squares regression. Evaluate goodness-of-fit with (\chi^2)-test and Monte Carlo simulations for confidence intervals.
Quantitative Data Comparison: Key Flux Differences
Table 1: Comparative Central Carbon Metabolism Fluxes in Oleaginous vs. Non-Oleaginous Yeast under Nitrogen Limitation (Fluxes normalized to glucose uptake rate = 100)
| Metabolic Reaction / Pathway | S. cerevisiae (Non-Oleaginous) | Y. lipolytica (Oleaginous) | R. toruloides (Oleaginous) | Biological Significance |
|---|---|---|---|---|
| Glycolysis (to Pyruvate) | 85 | 92 | 95 | Precursor supply |
| Pentose Phosphate Pathway (Net) | 15 | 35 | 40 | NADPH for lipogenesis |
| Citrate Synthase (Mitochondria) | 65 | 110 | 105 | TCA cycle activity |
| ATP: Citrate Lyase (ACL) | <1 | 45 | 50 | Key anaplerotic step for cytosolic acetyl-CoA |
| Malic Enzyme (NADP+) | 5 | 25 | 30 | Additional NADPH source |
| Flux to Total Fatty Acids | 5 | 22 | 25 | Carbon partitioning efficiency |
| Flux to Biomass (Amino Acids) | 45 | 15 | 12 | Nitrogen-limited redirection |
Table 2: Cofactor Production Rates Linked to Lipid Synthesis (mmol/gDCW/h)
| Cofactor | S. cerevisiae | Y. lipolytica | Primary Source in Oleaginous Yeast |
|---|---|---|---|
| NADPH | 1.8 | 6.5 | PPP (60%), Malic Enzyme (40%) |
| Acetyl-CoA (Cytosolic) | 0.5 | 4.2 | ATP: Citrate Lyase |
| ATP | 12.5 | 15.1 | Mitochondrial oxidative phosphorylation |
Visualizing Metabolic Pathways and Workflows
Title: Core Flux Routes for Lipid Synthesis in Oleaginous Yeast
Title: 13C-MFA Workflow for Comparative Study
The Scientist's Toolkit: Key Research Reagent Solutions
Table 3: Essential Materials and Reagents for Comparative 13C-MFA
| Item / Reagent | Function in Experiment | Example Product / Specification |
|---|---|---|
| [U-13C] Glucose | Isotopic tracer for defining network fluxes. 99% atom % (^{13}\text{C}). | Cambridge Isotope Laboratories, CLM-1396 |
| Defined Minimal Media Kit | Ensures reproducible, chemically defined growth conditions. | For example, Yeast Synthetic Drop-out Medium supplements. |
| Quenching Solution | Rapidly halts metabolism for accurate metabolomics. | 60% Aqueous Methanol, -40°C. |
| Derivatization Reagents | Prepare metabolites for GC-MS analysis (e.g., amino acids). | N-Methyl-N-(tert-butyldimethylsilyl)trifluoroacetamide (MTBSTFA). |
| FAME Standards | Quantify and identify fatty acid methyl esters during lipid analysis. | Supelco 37 Component FAME Mix. |
| Flux Estimation Software | Platform for (^{13}\text{C}) MFA computational modeling. | INCA (Isotopomer Network Compartmental Analysis). |
| Metabolic Network Model | Stoichiometric representation of yeast CCM. | Yeast 8.3 or organism-specific GSM from BiGG/ModelSEED. |
| Internal Standard Mix (13C-labeled) | Normalize MS data for absolute quantification. | e.g., (^{13}\text{C})-labeled cell extract (for LC-MS). |
The industrial translation of microbial processes, particularly those exploiting Saccharomyces cerevisiae for the production of biofuels, lipid-derived chemicals, and therapeutic compounds, hinges on a rigorous scalability assessment. This assessment is fundamentally rooted in the interplay between engineered central carbon metabolism (CCM) and targeted product accumulation (e.g., lipids, oleochemicals). Optimizing CCM fluxes—glycolysis, pentose phosphate pathway, TCA cycle—is paramount to redirect carbon skeletons from biomass and CO₂ towards acetyl-CoA, the universal precursor for lipid biosynthesis. This whitepaper provides an in-depth technical guide for researchers and process development scientists, detailing the critical metrics of Titer, Rate, Yield (TRY), substrate range flexibility, and downstream processing, all contextualized within modern yeast metabolic engineering for industrial scale-up.
Core Scalability Metrics: The TRY Paradigm
The TRY metrics form the quantitative backbone of process economics.
Titer: The final concentration of the target product (e.g., free fatty acids, triacylglycerols) in the fermentation broth, typically measured in g/L or mg/L. High titer reduces downstream processing volume and cost. Rate: The volumetric (g/L/h) or specific (g/g cell/h) productivity. This dictates the required reactor size and operational time to achieve a production target. Yield: The conversion efficiency of the carbon substrate (e.g., glucose, glycerol) into the target product (g product / g substrate). This is directly tied to raw material costs and metabolic efficiency.
Table 1: Representative TRY Metrics for Lipid Production in Engineered Yeast Strains (2021-2024)
| Engineered Yeast Strain | Target Product | Substrate | Titer (g/L) | Rate (g/L/h) | Yield (g/g) | Key Metabolic Engineering Strategy |
|---|---|---|---|---|---|---|
| S. cerevisiae (GPY-101) | Free Fatty Acids | Glucose | 25.4 | 0.26 | 0.22 | Overexpression of ACC1, FAS complex; deletion of POX1 (β-oxidation) |
| Y. lipolytica (LgX-05) | Triacylglycerols | Glucose | 85.0 | 0.89 | 0.28 | Knockout of MGA2 (lipid regulation), expression of DGA1, engineered PPP for NADPH supply |
| S. cerevisiae (OleoPro) | Fatty Alcohols | Sucrose | 15.8 | 0.18 | 0.15 | Introduction of sucrose invertase, expression of fatty acyl-CoA reductase, malic enzyme for NADPH |
| Y. lipolytica (GRAS-22) | Lipids (Total) | Crude Glycerol | 65.0 | 0.54 | 0.31 | Enhanced glycerol catabolism (GUT1), engineered TCA for citrate supply to ACLY |
Experimental Protocols for TRY Determination
Protocol 3.1: Fed-Batch Fermentation for TRY Data Generation Objective: To determine maximum titer, productivity, and yield under controlled, scalable conditions.
- Inoculum Preparation: Inoculate a single colony into 50 mL of defined synthetic media with 20 g/L glucose. Incubate at 30°C, 250 rpm for 16-18 hours.
- Bioreactor Setup: Transfer inoculum to a 5 L bioreactor with an initial working volume of 2 L. Use defined medium with initial glucose concentration of 20 g/L. Control parameters: pH 5.5 (controlled with 2M NaOH/1M H₃PO₄), dissolved oxygen (DO) >30% (via cascaded agitation and aeration), temperature 30°C.
- Fed-Batch Operation: Upon depletion of initial glucose (indicated by a DO spike), initiate an exponential feed of concentrated glucose solution (500 g/L) to maintain a specific growth rate (µ) of 0.15 h⁻¹ for biomass growth phase. After 24 hours, shift to a production phase by reducing the feed rate to induce nutrient limitation or by adding a chemical inducer.
- Sampling & Analysis: Take periodic samples (every 2-4 h) for offline analysis. Measure: a) Biomass (optical density at 600 nm and cell dry weight), b) Substrate concentration (HPLC with refractive index detector or enzymatic assay kits), c) Product concentration (for lipids: extract using modified Bligh & Dyer method, quantify via GC-FAME or gravimetric analysis).
- Calculation:
- Titer: Maximum product concentration (g/L) from time course.
- Volumetric Productivity (Rate): ΔProduct Concentration (g/L) / ΔTime (h) during linear production phase.
- Yield: Total Product Formed (g) / Total Substrate Consumed (g).
Protocol 3.2: High-Throughput Microplate Assay for Substrate Range Screening Objective: Rapidly profile growth and preliminary product formation on alternative carbon sources.
- Media Formulation: Prepare basal mineral medium lacking a carbon source. Filter sterilize.
- Substrate Addition: Aliquot 150 µL of basal medium into 96-well deep-well plates. Add concentrated filter-sterilized carbon source solutions (e.g., xylose, acetate, glycerol, lignocellulosic hydrolysate) to a final concentration of 20 g/L. Include glucose as control.
- Inoculation & Incubation: Inoculate wells with a standardized cell suspension (OD₆₀₀ ≈ 0.1). Seal plates with breathable membranes. Incubate in a spectrophotometric plate reader at 30°C with continuous double-orbital shaking. Measure OD₆₀₀ every 15 minutes for 48-72 hours.
- Endpoint Product Analysis: At stationary phase, transfer 100 µL of culture to a separate plate for product quantification via colorimetric or fluorometric assays (e.g., lipid stains like Nile Red for neutral lipids).
Substrate Range Assessment
Broad substrate utilization, especially of low-cost, non-food feedstocks (e.g., glycerol, acetate, C5/C6 sugars from lignocellulose), is critical for economic viability and supply chain resilience. Engineering requirements involve:
- Heterologous Pathway Introduction: e.g., Xylose isomerase (XYLA) and xylulokinase (XKS1) for xylose utilization.
- Catabolic Pathway Optimization: e.g., Upregulating glycerol kinase (GUT1) and glycerol-3-phosphate dehydrogenase (GUT2).
- Cofactor Balancing: Alleviating redox imbalances when switching from glycolytic (NADH-producing) to oxidative (NADPH-requiring) substrates.
Table 2: Substrate Range & Associated Metabolic Engineering Targets in Yeast
| Substrate Class | Example Feedstocks | Native to S. cerevisiae? | Key Metabolic Engineering Targets/Strategies |
|---|---|---|---|
| Hexose Sugars | Glucose, Mannose | Yes | Strengthen uptake (HXT overexpression), prevent Crabtree effect. |
| Pentose Sugars | Xylose, Arabinose | No | Introduce oxidoreductase pathway (XYL1, XYL2, XYL3) or isomerase pathway (XYLA, XKS1). |
| Disaccharides | Sucrose, Cellobiose | Variable (Sucrose: Yes) | Express invertase (SUC2) or cellobiose transporters & hydrolases. |
| C2/C3 Compounds | Acetate, Glycerol | Yes (poor on acetate) | Enhance acetyl-CoA synthetase (ACS1), glyoxylate shunt; overexpress GUT1, GUT2. |
| Lignocellulosic Hydrolysate | Corn stover, Sugarcane bagasse | No (inhibitors present) | Express inhibitor-tolerant pathways, engineer resistance to furans, phenolics, and weak acids. |
Downstream Processing (DSP) Considerations
Lipid-based products in yeast are intracellular, dictating a specific DSP workflow. Unit operation efficiency is co-optimized with strain traits (e.g., cell wall rigidity, particle size).
- Cell Harvesting: Continuous centrifugation is standard. Flocculation traits can be engineered to reduce energy costs.
- Cell Disruption: High-pressure homogenization (HPH) or bead milling are effective but energy-intensive. Engineering autolytic strains (e.g., expressing lytic enzymes under controlled promoters) can reduce this burden.
- Product Recovery: For lipids, solvent extraction (hexane, ethyl acetate) is common. In situ product recovery (ISPR) using two-phase fermentation can be integrated to alleviate product toxicity and simplify DSP.
- Purification: Distillation, crystallization, or chromatography based on product properties.
The Scientist's Toolkit: Key Research Reagent Solutions
Table 3: Essential Reagents and Kits for Yeast Lipid Metabolic Engineering Research
| Reagent/Kits | Supplier Examples | Function in Research |
|---|---|---|
| Yeast Nitrogen Base (without amino acids) | Sigma-Aldrich, Formedium | Defined minimal medium for precise control of nutrient availability and selection pressure. |
| Nile Red Stain | Thermo Fisher, Sigma-Aldrich | Fluorometric detection and quantification of intracellular neutral lipid droplets by flow cytometry or microscopy. |
| Fatty Acid Methyl Ester (FAME) Mix Standard | Supelco, Larodan | GC standard for identification and quantification of specific fatty acid species in lipid extracts. |
| Quick-DNA Fungal/Bacterial Miniprep Kit | Zymo Research | Rapid isolation of genomic DNA from yeast for PCR screening or sequencing of engineered loci. |
| Gibson Assembly Master Mix | NEB, Thermo Fisher | Modular, isothermal assembly of multiple DNA fragments for plasmid or pathway construction. |
| Enzymatic Glucose/Oxygen Bioanalyzer | YSI (Xylem), Roche | Real-time, precise quantification of glucose and other metabolites in fermentation broth. |
| Phusion High-Fidelity DNA Polymerase | Thermo Fisher, NEB | High-accuracy PCR for amplification of genetic parts and assembly fragments. |
| Anti-ACCase (phospho-Ser79) Antibody | Cell Signaling Technology | Western blot analysis of the phosphorylation state of acetyl-CoA carboxylase, a key regulated enzyme in lipid synthesis. |
Visualizing Metabolic Pathways and Workflows
Diagram 1: Engineered CCM Flux to Lipid Accumulation in Yeast
Diagram 2: Integrated Workflow for Industrial Scalability Assessment
Conclusion
The strategic manipulation of central carbon metabolism is the linchpin for unlocking the full potential of yeast as microbial cell factories for lipids. This review synthesized foundational knowledge, engineering methodologies, practical optimization strategies, and platform comparisons to provide a holistic guide. Key takeaways include the paramount importance of balanced acetyl-CoA and NADPH supply, the necessity of integrated 'omics' and synthetic biology approaches for rational design, and the critical evaluation of chassis-specific advantages. For biomedical and clinical research, these principles extend beyond bioproduction. Yeast serves as an exquisite model for studying conserved metabolic disorders such as obesity, NAFLD, and cancers driven by lipogenic pathways (e.g., through mTOR and SREBP homologs). Future directions point towards dynamic metabolic control, consortia-based fermentations, and the application of machine learning to predict optimal genetic interventions. The continued elucidation and engineering of the CCM-lipogenesis axis will therefore fuel both sustainable industries and fundamental discoveries in cellular metabolism.