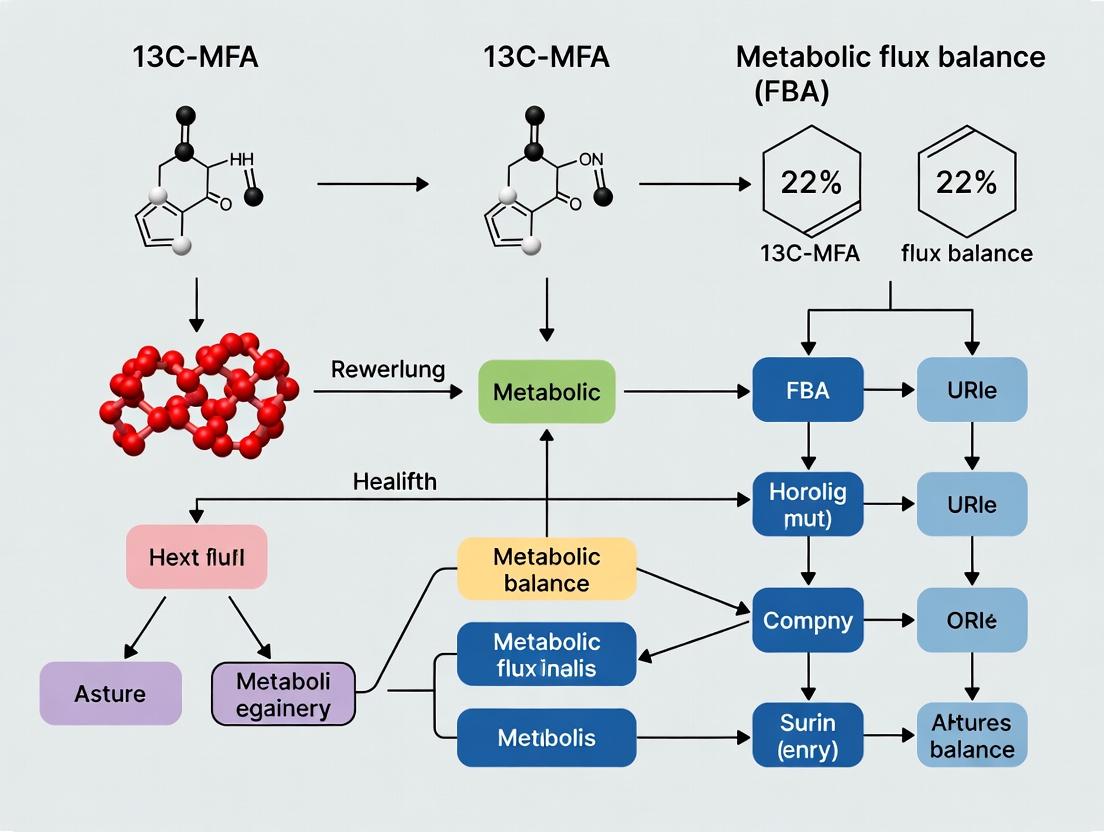
Metabolic Flux Analysis Decoded: A Comprehensive Guide to 13C-MFA vs. FBA for Biomedical Research
This article provides a detailed comparative analysis of two fundamental approaches to metabolic flux analysis: 13C Metabolic Flux Analysis (13C-MFA) and Flux Balance Analysis (FBA).
Metabolic Flux Analysis Decoded: A Comprehensive Guide to 13C-MFA vs. FBA for Biomedical Research
Abstract
This article provides a detailed comparative analysis of two fundamental approaches to metabolic flux analysis: 13C Metabolic Flux Analysis (13C-MFA) and Flux Balance Analysis (FBA). Tailored for researchers, scientists, and drug development professionals, it explores the core principles, methodologies, applications, and inherent trade-offs of each technique. The content spans from foundational concepts and experimental/computational workflows to troubleshooting common challenges and validating model predictions. By synthesizing current research and best practices, this guide aims to empower the target audience in selecting and implementing the optimal flux analysis strategy for their specific biomedical research or therapeutic development objectives.
Understanding the Core: Principles, Scope, and Key Differences Between 13C-MFA and FBA
Measuring the flow of metabolites through biochemical pathways—metabolic flux—is fundamental to understanding cellular physiology in health and disease. Accurate flux measurements can identify dysregulated pathways in cancer, reveal mechanisms of drug action or resistance, and guide metabolic engineering for therapeutic production. This comparison guide focuses on two dominant methodologies for flux analysis: 13C-Metabolic Flux Analysis (13C-MFA) and constraint-based Flux Balance Analysis (FBA).
Core Thesis: While FBA provides a powerful, genome-scale modeling framework for hypothesis generation and in silico prediction of flux distributions, 13C-MFA offers an empirical, top-down approach for experimental measurement of intracellular fluxes with high resolution, making it the gold standard for quantitative validation.
Comparison Guide: 13C-MFA vs. Flux Balance Analysis (FBA)
| Feature | 13C-Metabolic Flux Analysis (13C-MFA) | Flux Balance Analysis (FBA) |
|---|---|---|
| Core Principle | Fits a kinetic model to experimental data from isotopes (e.g., [1,2-13C]glucose) to calculate net reaction rates. | Uses linear programming to optimize an objective function (e.g., biomass) within constraints of stoichiometry and reaction bounds. |
| Primary Input | Experimental measurements: Extracellular rates, intracellular metabolite labeling patterns from MS/NMR. | Genomic annotation (network stoichiometry), exchange flux constraints, an objective function. |
| Flux Output | Quantitative, absolute fluxes (nmol/gDW/h) for core central metabolism. Resolves bidirectional fluxes in reversible reactions. | Relative flux distribution (normalized units). Predicts a single flux solution per optimization. |
| Network Scale | Focused, sub-network models (50-100 reactions of central carbon metabolism). | Genome-scale models (often >1,000 reactions encompassing entire metabolism). |
| Key Requirement | High-quality mass isotopomer distribution (MID) data; knowledge of atom transitions. | Well-curated, tissue/cell-specific genome-scale metabolic model (GEM). |
| Temporal Resolution | Provides steady-state snapshot; dynamic 13C-MFA can capture transients. | Typically steady-state; dynamic FBA (dFBA) variants exist. |
| Validation | Empirically validated by experimental data fitting (chi-square statistics). | Predictive; requires experimental (often 13C-MFA) data for validation/constraining. |
| Primary Biomedical Application | Definitive pathway activity measurement in disease models, drug mechanism studies, quantitative phenotyping. | Hypothesis generation, identification of essential genes/reactions, integration with omics data, guiding 13C-MFA experimental design. |
Supporting Experimental Data: A Case Study in Cancer Cell Metabolism A 2019 study in Nature Communications directly compared the outputs of FBA and 13C-MFA in pancreatic cancer cells.
- Aim: Quantify the activity of the oxidative pentose phosphate pathway (oxPPP) versus the non-oxidative PPP.
- Protocol:
- Cell Culture: PANC-1 cells were cultured with [1,2-13C]glucose.
- Metabolite Extraction: Cells were quenched, and metabolites (e.g., ribose-5-phosphate, nucleotides) were extracted.
- Mass Spectrometry: GC-MS was used to measure the 13C-labeling patterns (mass isotopomer distributions, MIDs) of key metabolites.
- Flux Analysis: MIDs and exchange rates were input into a 13C-MFA model (e.g., using INCA software) to compute fluxes.
- FBA Prediction: A context-specific GEM for PANC-1 was used to predict PPP flux distribution under maximal growth objective.
| Method | Predicted/Measured oxPPP Flux (% of glucose uptake) | Key Insight |
|---|---|---|
| FBA Prediction | ~15% (Highly variable based on objective function and constraints) | Predicted a substantial oxPPP flux for NADPH production. |
| 13C-MFA Measurement | <5% | Experimentally demonstrated that >95% of ribose synthesis came via the non-oxidative PPP (transketolase/transaldolase), challenging the assumed role of oxPPP in this cancer line. |
Conclusion: The study highlighted that FBA alone could misrepresent pathway usage, while 13C-MFA provided the empirical data needed to correct the model and reveal the true metabolic phenotype, crucial for targeting cancer metabolism.
Experimental Protocol for 13C-MFA
A standard workflow for steady-state 13C-MFA is as follows:
1. Experimental Design & Tracer Selection:
- Choose a 13C-labeled substrate (e.g., [U-13C]glucose, [1,2-13C]glucose) that will generate informative labeling patterns in the pathways of interest.
- Ensure cells are at metabolic steady-state (constant growth rate and extracellular rates) and isotopic steady-state (labeling patterns no longer changing).
2. Cell Culturing & Sampling:
- Culture cells in bioreactors or well-controlled plates with the 13C tracer medium.
- Periodically sample supernatant for extracellular flux rates (glucose uptake, lactate/glutamate secretion, etc.) via assays or HPLC.
- At isotopic steady-state, quickly quench metabolism (liquid N2, cold methanol), extract intracellular metabolites, and prepare for analysis.
3. Analytical Measurements:
- GC-MS or LC-MS: Derivatize polar metabolites (e.g., amino acids, organic acids). Measure the Mass Isotopomer Distribution (MID) of key fragments. The MID is the vector of fractional abundances of molecules with different numbers of 13C atoms (M0, M1, M2,...).
4. Computational Flux Estimation:
- Use specialized software (e.g., INCA, 13CFLUX2, OpenMebius).
- Build a stoichiometric model of the metabolic network with atom mappings.
- Input: 1) Extracellular rates, 2) Measured MIDs.
- The software performs an iterative fitting routine, adjusting net fluxes until the simulated MIDs best match the experimental MIDs (minimizing residual sum of squares).
5. Statistical Analysis & Validation:
- Assess goodness-of-fit (chi-square test).
- Perform sensitivity analysis and Monte Carlo simulations to calculate confidence intervals for each estimated flux.
Title: 13C-MFA Experimental and Computational Workflow
Pathway Logic: Integrating FBA with 13C-MFA
Title: Iterative Cycle Between Predictive FBA and Definitive 13C-MFA
The Scientist's Toolkit: Key Research Reagent Solutions
| Item | Function in Flux Analysis |
|---|---|
| 13C-Labeled Substrates ([1,2-13C]Glucose, [U-13C]Glutamine) | The essential tracer. Provides the "signal" to track metabolic fate. Different labeling patterns probe different pathway activities. |
| Isotope-Labeled Internal Standards (e.g., 13C/15N-amino acids for LC-MS) | Critical for absolute quantification of metabolite concentrations, which can inform flux estimation and improve model accuracy. |
| Specialized Software Licenses (INCA, 13CFLUX2, CobraPy) | Required for computational flux fitting (13C-MFA) or constraint-based modeling (FBA). Steep learning curves but essential. |
| Cell Culture Bioreactors (Micro-scale) | Enable precise control of nutrient levels, pH, and gas for achieving true metabolic steady-state—a prerequisite for accurate 13C-MFA. |
| High-Resolution Mass Spectrometer (HRMS - GC or LC coupled) | The core analytical instrument. Measures the mass isotopomer distributions (MIDs) of metabolites with high sensitivity and resolution. |
| Validated, Cell-Specific GEM (e.g., from AGORA, Recon3D) | A high-quality, curated genome-scale metabolic model is the foundational input for generating meaningful FBA predictions relevant to the studied system. |
Core Methodological Comparison: 13C-MFA vs. Metabolic Flux Balance Analysis (FBA)
While both 13C-MFA and FBA are cornerstone techniques in metabolic network analysis, their underlying principles, data requirements, and output validation differ fundamentally. This guide compares their performance in generating predictive, quantitative metabolic models.
Table 1: Core Principle and Data Requirement Comparison
| Feature | 13C-MFA | Flux Balance Analysis (FBA) |
|---|---|---|
| Primary Objective | Determine in vivo metabolic reaction rates (fluxes) from isotopic labeling data. | Predict optimal metabolic flux distributions based on stoichiometry and optimization principles. |
| Key Requirement | Experimental 13C-labeling data of metabolites (e.g., GC-MS, LC-MS). | Genome-scale metabolic reconstruction (stoichiometric matrix). |
| Mathematical Basis | Iterative fitting of non-linear isotopomer balance equations. | Linear programming solution space constrained by stoichiometry. |
| Flux Resolution | Provides absolute, quantitative fluxes for core metabolism. | Provides relative flux distributions; requires objective function (e.g., biomass max.). |
| Validation Basis | Direct validation against experimental isotopic labeling patterns. | Validation against growth phenotypes or secretion rates; lacks direct mechanistic validation. |
| State Assumption | Isotopic and metabolic steady-state. | Metabolic steady-state (pseudo-steady-state). |
Table 2: Performance Comparison in Predictive Modeling
| Performance Metric | 13C-MFA | FBA | Supporting Experimental Data (Typical) |
|---|---|---|---|
| Quantitative Accuracy | High (experimentally measured). | Low to Moderate (theoretically predicted). | 13C-MFA fluxes show <5% residual error vs. labeling data; FBA predictions can deviate >30% from measured exometabolite rates. |
| Network Scope | Core central metabolism (50-100 reactions). | Genome-scale (1000+ reactions). | 13C-MFA typically resolves ~50 net fluxes in central carbon metabolism. |
| Identification of Parallel Pathways | Excellent (e.g., PPP vs. EMP). | Poor (often lumped reactions). | 13C-MFA can quantify split ratio between oxidative and non-oxidative PPP pentose phosphate pathway. |
| Requirement for Biomass Composition | Not required for flux calculation. | Critical and highly sensitive input. | Errors in biomass stoichiometry directly propagate to FBA flux errors. |
| Ability to Measure Reversibility | Yes, quantifies net and exchange fluxes. | No, typically assumes irreversibility. | 13C-MFA can quantify reversible TCA cycle fluxes (e.g., malate <-> fumarate). |
Detailed Methodologies for Key 13C-MFA Experiments
Protocol 1: Steady-State Isotopic Tracer Experiment for Mammalian Cells
- Cell Culture & Tracer Introduction: Grow cells to mid-log phase. Replace standard growth medium with an identical medium where the primary carbon source (e.g., Glucose) is substituted with a uniformly labeled 13C tracer (e.g., [U-13C]Glucose).
- Isotopic Steady-State Achievement: Maintain cells in tracer medium for a duration sufficient to achieve isotopic steady-state in intracellular metabolite pools (typically 24-48 hours for mammalian cells, confirmed by time-course sampling).
- Rapid Quenching & Metabolite Extraction: Rapidly transfer culture dish to a cold methanol bath (-40°C) to quench metabolism. Scrape cells in an extraction solvent (e.g., 80% methanol/water).
- Sample Preparation for MS: Centrifuge extract, collect supernatant, and dry under nitrogen. Derivatize polar metabolites (e.g., using MSTFA for GC-MS or butanol for LC-MS) to enhance volatility/ionization.
- Mass Spectrometry Analysis: Analyze derivatized samples via GC-MS or LC-MS. For GC-MS, common targets include proteinogenic amino acids (hydrolyzed from cellular protein) and intracellular intermediates.
Protocol 2: Flux Calculation via Computational Modeling
- Metabolic Network Definition: Construct a stoichiometric model of core metabolism, including atom transitions for each reaction.
- Measurement Input: Input the experimentally measured Mass Isotopomer Distributions (MIDs) of target metabolites from Step 1.
- Flux Estimation: Use software (e.g., INCA, 13C-FLUX) to iteratively adjust metabolic fluxes in the model until the simulated MIDs best fit the experimental MIDs (minimizing residual sum of squares).
- Statistical Validation: Employ chi-square statistics and Monte-Carlo simulations to determine confidence intervals for each estimated flux.
13C-MFA Experimental and Computational Workflow
Title: 13C-MFA Workflow from Experiment to Flux Map
Integrated 13C-MFA & FBA Framework for Drug Development
Title: Iterative 13C-MFA & FBA Framework in Research
The Scientist's Toolkit: Key Reagent Solutions for 13C-MFA
| Item | Function in 13C-MFA |
|---|---|
| 13C-Labeled Tracer Substrates (e.g., [U-13C]Glucose, [1-13C]Glutamine) | The fundamental perturbation; introduces measurable isotopic label into metabolism to trace pathway activity. |
| Quenching Solvent (e.g., Cold Methanol, ≤ -40°C) | Instantly halts all enzymatic activity to "freeze" the metabolic state at the time of sampling. |
| Derivatization Reagents (e.g., MSTFA for GC-MS, 3N Butanol-HCl for LC-MS) | Chemically modifies polar metabolites to increase volatility (for GC-MS) or improve ionization/chromatography (for LC-MS). |
| Internal Standards (e.g., 13C/15N-labeled cell extract) | Added during extraction to correct for variations in MS ionization efficiency and sample preparation losses. |
| Isotopomer Modeling Software (e.g., INCA, 13C-FLUX, OpenFLUX) | Performs the computational fitting of the metabolic network model to the experimental MS data to calculate fluxes. |
| Stable Isotope-Enabled Metabolic Model | A curated biochemical network detailing stoichiometry and carbon atom transitions, required for flux estimation. |
Comparative Analysis of 13C-MFA vs. FBA in Metabolic Research
This guide provides an objective comparison of two primary methodologies in metabolic flux analysis: 13C-Metabolic Flux Analysis (13C-MFA) and Flux Balance Analysis (FBA). Within the broader thesis of 13C-MFA vs. FBA research, we compare their core principles, performance, and applicability, supported by experimental data.
Core Principle Comparison
The fundamental distinction lies in their approach: 13C-MFA is an experimentally-driven, top-down methodology that uses isotopic tracer data to calculate in vivo fluxes. In contrast, FBA is a computationally-driven, bottom-up approach that uses stoichiometric models and optimization to predict theoretical flux capacities.
Table 1: Foundational Comparison of 13C-MFA and FBA
| Principle | 13C-MFA | Flux Balance Analysis (FBA) |
|---|---|---|
| Data Input | Measured 13C isotopic labeling patterns, extracellular fluxes. | Genome-scale metabolic model (stoichiometric matrix), growth/uptake constraints, objective function. |
| Mathematical Core | Iterative fitting to non-linear isotopomer balance equations. | Linear programming solution to S • v = 0, subject to constraints. |
| Key Output | Absolute, in vivo flux values for core metabolism. | Relative flux distribution maximizing/minimizing an objective (e.g., biomass). |
| Temporal Resolution | Steady-state (hours) or dynamic (instationary MFA). | Primarily steady-state; can be dynamic via dFBA. |
| Scale | Central carbon metabolism (~50-100 reactions). | Genome-scale (500-10,000+ reactions). |
| Basis of Prediction | Experimental measurement & statistical fitting. | Constraint-based optimization & assumed cellular objective. |
Table 2: Performance Benchmarks from Comparative Studies
| Performance Metric | 13C-MFA | FBA | Supporting Experimental Data (Typical Range) |
|---|---|---|---|
| Quantitative Accuracy | High for resolved pathways. | Moderate; depends on constraints. | 13C-MFA error: ±2-10%. FBA vs. 13C-MFA correlation: R²=0.4-0.8 for core fluxes. |
| Scope/Comprehensiveness | Limited to core metabolism. | Comprehensive, genome-wide. | 13C-MFA typically covers <100 reactions vs. FBA's >1000. |
| Time to Solution | Hours to days (experiment + computation). | Seconds to minutes (computation only). | 13C-MFA: 1-week culture + 24h computation. FBA: <5 min simulation. |
| Cost | Very High (labeled substrates, MS/NMR). | Very Low (computational). | 13C-labeled glucose: ~$500/gram. FBA simulation: negligible. |
| Requirement for Omics Data | Not required, but can integrate. | Required for context-specific model generation. | FBA models often integrated with transcriptomics (GIMME, iMAT) or proteomics. |
Experimental Protocols for Key Comparative Studies
Protocol 1: Validating FBA Predictions with 13C-MFA
- Strain & Culture: Cultivate model organism (e.g., E. coli, S. cerevisiae) in defined medium with natural carbon source.
- FBA Simulation: Construct or use a published genome-scale model. Set constraints based on measured substrate uptake rates. Optimize for biomass production. Extract predicted internal flux map.
- 13C-MFA Experiment: Switch culture to an identical medium with [1-13C] or [U-13C] labeled substrate at mid-exponential phase. Harvest at steady-state isotopic enrichment.
- Mass Spectrometry: Derivatize intracellular metabolites (e.g., amino acids). Measure mass isotopomer distributions (MIDs) via GC-MS or LC-MS.
- Flux Calculation: Use software (e.g., INCA, 13CFLUX2) to fit net fluxes to the experimental MIDs via least-squares regression.
- Comparison: Correlate absolute fluxes from 13C-MFA for shared reactions (e.g., PPP, TCA fluxes) with relative fluxes predicted by FBA.
Protocol 2: Integrating 13C-MFA Data to Improve FBA Models
- Gap-Filling: Use 13C-MFA-verified active pathways to identify gaps in in silico model stoichiometry.
- Constraint Refinement: Apply 13C-MFA-derived flux ranges (lower/upper bounds) as additional constraints in the FBA linear programming problem.
- Objective Function Testing: Test alternative objective functions (e.g., maximizing ATP yield, minimizing redox imbalance) against the 13C-MFA flux map as a benchmark to determine the most biologically relevant objective.
Visualization of Methodologies and Integration
The Scientist's Toolkit: Key Research Reagent Solutions
Table 3: Essential Materials for 13C-MFA / FBA Comparative Research
| Item | Function & Application | Example Product/Resource |
|---|---|---|
| 13C-Labeled Substrates | Tracers for 13C-MFA experiments to determine in vivo flux. | [1-13C]Glucose, [U-13C]Glucose (e.g., Cambridge Isotope Laboratories CLM-1396, CLM-1397). |
| Defined Culture Media | Essential for precise control of nutrient availability for both experimental and in silico constraints. | M9 minimal medium (bacteria), SM medium (yeast), DMEM without glucose/pyruvate (mammalian). |
| Genome-Scale Metabolic Models | The foundational stoichiometric matrix for FBA. | BiGG Models database (e.g., iML1515 for E. coli, Recon3D for human). |
| Flux Analysis Software | Platforms for performing 13C-MFA flux fitting or FBA simulations. | 13C-MFA: INCA, 13CFLUX2. FBA: COBRA Toolbox (MATLAB), cobrapy (Python). |
| Mass Spectrometer | Instrument for measuring mass isotopomer distributions (MIDs) of metabolites. | GC-MS system (e.g., Agilent 7890B/5977B) or LC-HRMS (e.g., Thermo Q Exactive). |
| Constraint Curation Databases | Sources for experimentally measured uptake/secretion rates to set realistic FBA bounds. | PlasmoDB (for Plasmodium), ECMDB (for E. coli), published literature values. |
| Context-Specific Model Algorithms | Tools to integrate transcriptomic/proteomic data with FBA models. | GIMME, iMAT, INIT, FASTCORE (available in COBRA Toolbox). |
Metabolic network analysis is central to systems biology, with two dominant philosophies: the bottom-up, data-driven 13C-Metabolic Flux Analysis (13C-MFA) and the top-down, constraint-based Flux Balance Analysis (FBA). This guide compares their performance, underpinned by experimental data, within the thesis that 13C-MFA provides precise, condition-specific flux maps, while FBA offers a versatile, genome-scale framework for hypothesis generation and exploration.
Core Methodological Comparison
| Feature | 13C-Metabolic Flux Analysis (13C-MFA) | Flux Balance Analysis (FBA) |
|---|---|---|
| Philosophy | Bottom-Up, Data-Driven | Top-Down, Constraint-Based |
| Primary Input | Measured extracellular rates, 13C-labeling patterns of metabolites | Genome-scale metabolic reconstruction (SBML), objective function (e.g., biomass) |
| Primary Output | Absolute, in vivo metabolic fluxes in central carbon metabolism | Potential flux distributions (rates) network-wide; a solution space |
| Key Constraint | Isotopic steady-state & mass balance | Physico-chemical constraints (mass balance, reaction bounds) |
| Scale | Focused (central metabolism, ~50-100 reactions) | Genome-scale (>1,000 reactions) |
| Temporal Resolution | Steady-state (hours) | Steady-state; Dynamic FBA variants exist |
| Requires Measured Flux Data | Yes (extensive labeling data) | No (but can integrate data as additional constraints) |
The following table summarizes key outcomes from studies comparing flux predictions to empirical validation data, such as direct metabolite production rates or 13C-MFA-derived fluxes as a "gold standard."
| Study Context (Organism) | 13C-MFA Performance (Error vs. Validation) | FBA Performance (Error vs. Validation) | Key Insight |
|---|---|---|---|
| E. coli (Aerobic, Glucose) | <5% deviation in central carbon fluxes | 15-40% deviation in key pathways (e.g., TCA cycle) without tuning | FBA predictions are highly sensitive to the defined objective function. 13C-MFA provides accurate, objective-function-independent maps. |
| CHO Cell Bioprocessing | Precise identification of shift in glycolysis/TCA split | Correctly predicted growth-optimal secretion patterns but missed branch point nuances | FBA robust for growth/yield optimization; 13C-MFA essential for quantifying pathway engagements in industrial cell lines. |
| Cancer Metabolism (Warburg Effect) | Quantified precise contribution of glycolysis vs. OXPHOS | Predicted feasibility of aerobic glycolysis but required 13C-MFA data to constrain and identify used pathways | FBA models list possibilities; 13C-MFA identifies the actual flux phenotype. |
Detailed Experimental Protocols
Protocol 1: Standard 13C-MFA Workflow
- Tracer Experiment: Cultivate cells with a defined 13C-labeled substrate (e.g., [1-13C]glucose).
- Steady-State Verification: Ensure metabolic and isotopic steady-state via constant growth/metrics over ≥5 generations.
- Sampling & Quenching: Rapidly collect cells and quench metabolism (e.g., -40°C methanol/water).
- Metabolite Extraction: Use cold methanol/chloroform/water extraction.
- LC-MS/MS Analysis: Derivatize (if GC-MS) or directly analyze intracellular metabolite intermediates (e.g., amino acids, glycolytic/TCA intermediates) to measure mass isotopomer distributions (MIDs).
- Flux Estimation: Input MIDs, extracellular uptake/secretion rates, and network model into software (e.g., INCA, Isotopomer Network Compartmental Analysis). Use an iterative algorithm to find the flux map that best fits the labeling data.
Protocol 2: Constraint-Based FBA Simulation
- Model Curation: Obtain/construct a genome-scale metabolic model (GEM) in SBML format.
- Define Constraints: Set lower/upper bounds (νmin, νmax) for all reactions (e.g., glucose uptake = -10 mmol/gDW/hr).
- Set Objective: Define an objective function (Z = c^T * ν) to maximize/minimize (e.g., maximize biomass reaction).
- Linear Programming Solve: Compute the flux distribution (ν) that maximizes Z, subject to S • ν = 0 (mass balance) and νmin ≤ ν ≤ νmax. Use solvers (e.g., COBRA Toolbox in MATLAB/Python).
- Solution Analysis: Interpret the optimal flux distribution or perform additional analyses (e.g., flux variability analysis, parsimonious FBA).
Pathway and Workflow Visualizations
Diagram 1: 13C-MFA vs FBA Workflow Comparison (91 chars)
Diagram 2: Simplified Central Carbon Network (78 chars)
The Scientist's Toolkit: Key Research Reagent Solutions
| Item | Function in 13C-MFA/FBA | Example/Note |
|---|---|---|
| 13C-Labeled Substrates | Essential tracers for 13C-MFA to generate measurable isotopic patterns. | [1,2-13C]Glucose, [U-13C]Glutamine; >99% isotopic purity required. |
| Genome-Scale Model (GEM) | The foundational network topology for FBA and 13C-MFA. | Recon (human), iJO1366 (E. coli); accessed from public databases (e.g., BiGG Models). |
| Metabolite Extraction Kits | Standardized protocols for intracellular metabolome quenching and extraction. | Cold methanol-based kits improve reproducibility and recovery for LC-MS. |
| COBRA Toolbox | Primary software platform for constraint-based modeling (FBA, pFBA, FVA). | MATLAB/Python toolbox for building, simulating, and analyzing GEMs. |
| 13C-MFA Software (INCA) | Industry-standard platform for flux estimation from 13C labeling data. | Uses computational least-squares fitting to calculate net and exchange fluxes. |
| LC-MS/MS System | High-resolution mass spectrometer for quantifying mass isotopomer distributions (MIDs). | Required for high-precision 13C-MFA; enables parallel fluxomics & metabolomics. |
| Cell Culture Bioreactors | Enable controlled, steady-state cultivation for both approaches (chemostat). | Critical for achieving metabolic steady-state required for rigorous 13C-MFA. |
Metabolic flux analysis is fundamental for understanding cellular physiology. Two principal computational frameworks are used: 13C Metabolic Flux Analysis (13C-MFA) and Flux Balance Analysis (FBA). Their application depends on the biological question, available data, and system constraints.
Core Principles and Comparison
| Feature | 13C-MFA | Flux Balance Analysis (FBA) |
|---|---|---|
| Core Principle | Fitting a metabolic model to experimental 13C labeling data to infer in vivo net and exchange fluxes. | Using linear programming to optimize an objective function (e.g., growth) under stoichiometric and capacity constraints. |
| Data Requirements | High: Requires extracellular rates & mass isotopomer distributions (MIDs) from 13C tracer experiments (e.g., [1-13C]glucose). | Low: Requires a genome-scale metabolic model, optional growth/uptake/secretion rates. |
| Flux Resolution | High-resolution net fluxes through central carbon metabolism (glycolysis, TCA, PPP). | Genome-scale flux map, but yields a solution space; often requires constraints to narrow. |
| Quantitative Accuracy | Gold standard for in vivo flux quantification in core metabolism. Validation via statistical goodness-of-fit. | Predicts potential fluxes. Accuracy depends on model quality and constraints. |
| Temporal Dynamics | Typically provides a steady-state snapshot. INST-13C-MFA enables short-term transients. | Can model steady-state or be extended to dynamic FBA for longer timescales. |
| Key Output | Single, statistically validated flux map with confidence intervals. | Range of feasible fluxes (solution space); a single solution upon optimization. |
| Primary Domain | Hypothesis testing & validation. Quantifying metabolic rewiring in disease, engineering, or perturbation. | Hypothesis generation & exploration. Predicting knockout targets, growth phenotypes, and network capabilities. |
Supporting Experimental Data: A 2021 study in Cancer & Metabolism compared fluxes in cancer cells under normoxia vs. hypoxia. 13C-MFA quantified a precise >2-fold increase in reductive carboxylation flux in hypoxia, which FBA had previously predicted as a feasible pathway but could not quantify the magnitude without 13C data constraints.
When is 13C-MFA the Gold Standard?
13C-MFA is the gold standard when precise, quantitative flux values in central metabolism are required to validate a metabolic phenotype. This is critical for:
- Defining metabolic mechanisms in diseases like cancer or metabolic disorders.
- Validating the function of engineered pathways in metabolic engineering.
- Quantifying the absolute flux changes induced by drugs or genetic interventions.
Key Experimental Protocol for 13C-MFA
- Tracer Experiment: Cultivate cells with a 13C-labeled substrate (e.g., 80% [1,2-13C]glucose, 20% unlabeled glucose).
- Steady-State Confirmation: Ensure metabolic and isotopic steady-state (typically 3-5 cell doublings).
- Quenching & Extraction: Rapidly quench metabolism (cold methanol), extract intracellular metabolites.
- Mass Spectrometry (GC/MS or LC-MS/MS): Measure mass isotopomer distributions (MIDs) of proteinogenic amino acids or intracellular metabolites.
- Flux Estimation: Use software (INCA, 13C-FLUX) to fit a metabolic network model to the extracellular flux data and MIDs via iterative least-squares regression.
- Statistical Evaluation: Assess fit quality with χ²-test and compute 95% confidence intervals for all fluxes via Monte Carlo simulation.
When Does FBA Shine?
FBA shines in genome-scale predictive modeling and exploration where 13C data is unavailable or infeasible. Its strengths are:
- Predicting outcomes of gene knockouts/knock-ins for strain design.
- Mapping the space of possible fluxes in uncharacterized organisms or conditions.
- Integrating multi-omics data (transcriptomics, proteomics) as constraints (creating "rFBA" or "ME-models").
Key Computational Protocol for FBA
- Model Formulation: Define stoichiometric matrix S (m x n) for m metabolites and n reactions.
- Apply Constraints: Set lower/upper bounds (vmin, vmax) for exchange and reaction fluxes based on known rates.
- Define Objective Function: Often biomass maximization (Z = c^T v).
- Solve Linear Programming Problem: Use solvers (e.g., COBRA Toolbox in MATLAB/Python) to find flux vector v that maximizes/minimizes Z subject to S·v = 0 and flux bounds.
- Analysis: Perform flux variability analysis (FVA), phenotypic phase plane analysis, or in silico gene knockout simulations.
The Scientist's Toolkit: Key Research Reagent Solutions
| Item | Function in 13C-MFA/FBA |
|---|---|
| U-13C or Position-specific 13C-Labeled Substrates (e.g., [U-13C]glucose) | Tracer for 13C-MFA experiments to generate measurable mass isotopomer patterns. |
| Quenching Solution (Cold Aqueous Methanol, ≤ -40°C) | Rapidly halts cellular metabolism to capture in vivo metabolite labeling states. |
| Derivatization Reagents (e.g., MSTFA for GC/MS; Chloroformate for LC-MS) | Chemically modify polar metabolites for volatile (GC) or improved ionization (LC) separation and detection. |
| Genome-Scale Metabolic Model (GEM) (e.g., Recon3D, iML1515) | Structured knowledgebase of reactions, genes, and metabolites; essential scaffold for both FBA and 13C-MFA. |
| COBRA Toolbox / 13C-FLUX Suite | Standard software platforms for constructing, simulating, and analyzing FBA models and 13C-MFA data. |
Visualizing the Workflow and Relationship
Title: Decision Workflow and Relationship Between 13C-MFA and FBA
Title: Key Central Carbon Metabolism Fluxes Quantifiable by 13C-MFA
From Lab Bench to Laptop: Step-by-Step Workflows and Real-World Applications
Comparison Guide: 13C-Metabolic Flux Analysis (13C-MFA) vs. Flux Balance Analysis (FBA)
Within metabolic engineering and systems biology research, 13C-MFA and FBA are complementary but distinct tools for quantifying intracellular metabolic fluxes. This guide provides an objective comparison based on current methodologies and experimental data.
Table 1: Core Methodological Comparison
| Feature | 13C-MFA | Flux Balance Analysis (FBA) |
|---|---|---|
| Primary Input | Measured 13C-labeling patterns in metabolites, exchange fluxes, growth rate. | Genome-scale metabolic network model, objective function (e.g., maximize growth). |
| Mathematical Basis | Non-linear least-squares regression fitting to isotopomer data. | Linear programming (optimization) within stoichiometric constraints. |
| Flox Solution | Determines a unique, precise flux map for central carbon metabolism. | Predicts a range of possible flux distributions; often non-unique. |
| Requirement for Measured Data | High: Requires extensive exo-metabolite and 13C-labeling data (MS/NMR). | Low: Requires only uptake/secretion rates and biomass composition. |
| Network Scale | Focused on core central metabolism (50-100 reactions). | Genome-scale (100s to 1000s of reactions). |
| Dynamic Capability | Steady-state only (though INST-13C-MFA enables pseudo-steady-state). | Steady-state; dFBA adds dynamic constraints. |
| Key Output | Absolute, quantitative fluxes through all pathways, including reversibility. | Optimal flux distribution based on assumed cellular objective. |
Table 2: Experimental Validation Data from Recent Studies
| Study Context | 13C-MFA Resolved Flux (mmol/gDW/h) | FBA-Predicted Flux (mmol/gDW/h) | Key Discrepancy & Insight |
|---|---|---|---|
| E. coli Aerobic Growth on Glucose [1] | Glycolysis: 12.5 ± 0.8; PPP: 1.2 ± 0.3 | Glycolysis: 14.1; PPP: 0.3 | FBA under-predicts PPP due to assumption of optimal biomass yield; 13C-MFA reveals active maintenance. |
| CHO Cell Fed-Batch Culture [2] | TCA Cycle: 2.1 ± 0.2; Malic Enzyme: 0.05 ± 0.01 | TCA Cycle: 1.7; Malic Enzyme: 0.35 | FBA over-predicts anaplerotic routes due to lack of regulatory constraint data. |
| S. cerevisiae Anaerobic Fermentation [3] | Glycolytic Flux: 8.4 ± 0.5; Glycerol Production: 1.1 ± 0.1 | Glycolytic Flux: 7.9; Glycerol Production: 1.5 | Good correlation for major fluxes; 13C-MFA quantifies exact split at branch points. |
Experimental Protocols for Key 13C-MFA Steps
Protocol 1: Tracer Experiment Design and Cell Culturing
- Tracer Selection: Choose 1-13C or U-13C glucose for initial studies; for complex resolution, use mixtures (e.g., [1,2-13C]glucose + [U-13C]glucose).
- Bioreactor Setup: Cultivate cells in a well-controlled bioreactor (pH, DO, temperature) to achieve metabolic steady-state.
- Tracer Pulse: Switch medium to an identical formulation containing the selected 13C-labeled substrate. Maintain steady-state for ≥5 residence times.
- Quenching & Harvest: Rapidly quench metabolism (liquid N2 cold methanol). Centrifuge to pellet cells. Wash pellet with saline. Store at -80°C.
Protocol 2: Mass Spectrometry (GC-MS) Measurement of Labeling
- Metabolite Extraction: Derivatize cell pellet using 2:2:1 Methanol:Chloroform:Water with internal standards. Centrifuge. Collect polar phase.
- Derivatization: Dry extract under N2. Add 20 µL Methoxyamine (20 mg/mL in pyridine), 70°C, 1 hr. Then add 80 µL MSTFA, 70°C, 1 hr.
- GC-MS Analysis: Inject sample onto GC column (e.g., DB-5MS). Use electron impact ionization. Acquire mass spectra in selected ion monitoring (SIM) mode for key fragment ions of amino acids (from protein hydrolysis) or central metabolites.
- Data Processing: Integrate peak areas. Correct for natural isotope abundances using software (e.g., IsoCor). Calculate Mass Isotopomer Distributions (MIDs).
Protocol 3: Computational Flux Fitting
- Model Setup: Define metabolic network stoichiometry in software (e.g., INCA, 13CFLUX2). Include atom transitions for each reaction.
- Data Input: Input measured MIDs, extracellular uptake/secretion rates, and biomass growth rate.
- Flux Estimation: Use non-linear least-squares algorithm to minimize difference between simulated and measured MIDs. Estimate flux values (v) and confidence intervals (via Monte Carlo or sensitivity analysis).
- Statistical Validation: Perform chi-square test for goodness-of-fit. Use statistical comparison (e.g., likelihood ratio test) to select between alternative network models.
Visualizations
13C-MFA Pipeline Workflow
13C-Labeling Propagation from [1,2-13C]Glucose
The Scientist's Toolkit: Key Reagent Solutions for 13C-MFA
Table 3: Essential Research Reagents and Materials
| Item | Function in 13C-MFA Pipeline |
|---|---|
| U-13C-Labeled Substrates (e.g., U-13C Glucose, Glutamine) | Provide the isotopic tracer; purity >99% atom 13C is critical for accurate MID measurement. |
| Custom Tracer Mixtures | Pre-mixed combinations of labeled/unlabeled substrates (e.g., 20% [1,2-13C] + 80% [U-12C] glucose) to probe specific pathway activities. |
| Cold Methanol Quenching Solution (60% aqueous, -40°C) | Instantly halts cellular metabolism to "freeze" the in vivo metabolite labeling state. |
| Derivatization Reagents (Methoxyamine, MSTFA) | Chemically modify polar metabolites for volatility and detection in GC-MS analysis. |
| Isotope-Correcting Software (IsoCor, MIDcor) | Accounts for natural abundance isotopes (13C, 2H, 18O, etc.) in derivatized fragments to calculate true 13C-enrichment. |
| Flux Estimation Software (INCA, 13CFLUX2, OpenFLUX) | Performs the computational non-linear regression to fit the network model to isotopomer data and output flux values with confidence intervals. |
| Stable Isotope-Enabled Metabolic Models (from MetaNetX, BiGG) | Curated stoichiometric models with atom transition mappings for simulating 13C-labeling patterns. |
Within the ongoing research discourse comparing 13C-Metabolic Flux Analysis (13C-MFA) and Flux Balance Analysis (FBA), the FBA pipeline represents a cornerstone constraint-based methodology. While 13C-MFA provides precise, isotopically-measured in vivo fluxes for a defined network, FBA enables genome-scale prediction of optimal flux distributions under specified physiological constraints. This guide compares key stages of the FBA pipeline against analogous steps in 13C-MFA, providing experimental data to highlight their respective performance in metabolic research and drug development.
Comparative Analysis: FBA Pipeline vs. 13C-MFA
Model Reconstruction and Scope
The initial stage involves building a stoichiometric network model.
Table 1: Comparison of Model Reconstruction
| Aspect | Flux Balance Analysis (FBA) | 13C-Metabolic Flux Analysis (13C-MFA) |
|---|---|---|
| Network Scale | Genome-scale (1,000s of reactions) | Reduced-scale, central metabolism (50-100 reactions) |
| Basis | Genomic annotation, biochemical databases | Core biochemical pathways known to carry flux |
| Key Output | Stoichiometric matrix (S) | Atom mapping matrix for central carbon pathways |
| Typical Use | Hypothesis generation, gap filling, discovery | Precise quantification of pathway fluxes |
| Experimental Requirement | Optional for reconstruction; required for validation | Mandatory for model definition and flux estimation |
Protocol: Genome-Scale Model Reconstruction for FBA
- Draft Assembly: Use an automated tool (e.g., ModelSEED, RAVEN) to generate a reaction list from an organism's genome annotation.
- Curation: Manually curate pathway gaps, reaction directionality, and cofactor specificity based on literature.
- Compartmentalization: Assign reactions to specific cellular compartments (e.g., cytosol, mitochondrion).
- Mass/Charge Balance: Verify that all reactions are stoichiometrically balanced.
- Network Verification: Perform sanity checks (e.g., ATP production in minimal media) to ensure metabolic functionality.
Constraint Definition and Experimental Input
Both methods apply constraints, but of fundamentally different natures.
Table 2: Comparison of Constraint Application
| Constraint Type | FBA Pipeline | 13C-MFA |
|---|---|---|
| Stoichiometric | System S∙v = 0 (mass balance) | System S∙v = 0 (mass balance) |
| Capacity | Upper/lower bounds (vmin, vmax) on reaction fluxes. | Implicitly defined by network structure. |
| Thermodynamic | Optional, via directionality bounds or explicit ΔG' constraints. | Incorporated via reversibility/irreversibility assignments. |
| Experimental | Exchange flux measurements (e.g., uptake/secretion rates). | Measured 13C-labeling patterns in intracellular metabolites. |
| Optimization | Linear Programming to maximize/minimize an objective (e.g., growth). | Least-Squares Minimization to fit labeling data. |
Protocol: Defining Exchange Flux Constraints for FBA
- Cultivation: Grow cells in a controlled bioreactor with defined medium.
- Sampling: Periodically sample culture supernatant.
- Analytics: Quantify substrate consumption and metabolite secretion rates using HPLC or GC-MS.
- Calculation: Convert concentration changes to specific rates (mmol/gDW/h).
- Input: Set these measured rates as lower/upper bounds for the corresponding exchange reactions in the model.
Objective Function Optimization and Flux Prediction
This is the predictive core of FBA, contrasted with the in vivo measurement of 13C-MFA.
Table 3: Performance Comparison of Flux Prediction
| Metric | FBA (with Biomax Objective) | 13C-MFA (with Isotopic Data) |
|---|---|---|
| Primary Objective | Maximize biomass production rate. | Minimize residual between simulated and measured labeling. |
| Flux Solution | Often a single, optimal flux distribution. | A range of statistically acceptable flux maps. |
| Experimental Burden | Lower (only exchange fluxes needed). | High (requires isotopic tracers, MS/NMR measurements). |
| Scale | Full genome-scale model. | Limited to central metabolism. |
| Accuracy | Good for predicting growth phenotypes & knockout effects. | High for resolving fluxes in redundant pathways. |
| Validation Study (E. coli) | >90% growth phenotype prediction accuracy (PMID: 29206092). | Flux confidence intervals typically <10-20% (PMID: 28340338). |
Protocol: Performing Flux Balance Analysis
- Formulate LP Problem: Define the linear programming problem: Maximize c^T∙v subject to S∙v = 0 and lb ≤ v ≤ ub. Here, c is a vector defining the objective (e.g., biomass reaction coefficient = 1).
- Choose Solver: Use an LP solver (e.g., GLPK, CPLEX, COBRA Toolbox interface).
- Solve: Compute the optimal flux distribution v_opt.
- Analyze: Perform flux variability analysis (FVA) to determine the range of possible fluxes for each reaction while maintaining optimal objective value.
Visualizing the FBA Pipeline and Its Context
Title: The FBA Pipeline and Its Relationship to 13C-MFA
The Scientist's Toolkit: Research Reagent Solutions
| Item | Function in FBA/13C-MFA Research |
|---|---|
| Defined Chemical Media | Essential for measuring accurate exchange fluxes in FBA and for providing specific 13C-labeled substrates (e.g., [1-13C]glucose) in tracer experiments for 13C-MFA. |
| 13C-Labeled Tracers | Isotopically enriched substrates (e.g., glucose, glutamine) are the core experimental input for 13C-MFA to determine intracellular flux patterns. |
| GC-MS or LC-MS | Mass spectrometry instruments are required to measure 13C-labeling distributions in proteinogenic amino acids or intracellular metabolites for 13C-MFA. |
| COBRA Toolbox (MATLAB) | A standard software suite for constraint-based reconstruction and analysis, used to implement the FBA pipeline. |
| Cell Culture Bioreactor | Provides controlled, reproducible environmental conditions (pH, O2) for obtaining consistent physiological data for both FBA constraints and 13C-MFA experiments. |
| Genome Annotation Database (e.g., KEGG, BioCyc) | Provides the foundational biochemical reaction data required for genome-scale metabolic model reconstruction in FBA. |
| Flux Analysis Software (e.g., INCA, 13C-FLUX2) | Specialized software for design, simulation, and statistical analysis of 13C-MFA experiments and data. |
Publish Comparison Guide: 13C-MFA vs. Constraint-Based FBA in Cancer Metabolism
This guide objectively compares two core methodologies for studying metabolic fluxes, framing them within the broader thesis of 13C-Metabolic Flux Analysis (13C-MFA) versus constraint-based Flux Balance Analysis (FBA) for cancer research.
Table 1: Methodological Comparison of 13C-MFA and FBA
| Feature | 13C-Metabolic Flux Analysis (13C-MFA) | Constraint-Based Flux Balance Analysis (FBA) |
|---|---|---|
| Core Principle | Fits a kinetic model to experimental 13C-labeling data from tracer experiments to compute absolute, in vivo fluxes. | Uses stoichiometric models and optimization (e.g., maximize biomass) to predict relative flux distributions under constraints. |
| Data Requirement | Requires extensive experimental data: 13C-tracer experiments, mass isotopomer distributions (MIDs) via LC-MS/GC-MS, extracellular rates. | Requires a genome-scale metabolic model (GEM) and constraint definitions (e.g., uptake/secretion rates). |
| Flux Resolution | High resolution for central carbon metabolism (glycolysis, TCA, PPP). Provides net and exchange fluxes. | System-wide scope (1000s of reactions) but low resolution; predicts flux ranges, not unique values. |
| Regulatory Insight | Infers active pathway engagement and regulation (e.g., PKM2 activity, glutamine anaplerosis). | Identifies capabilities and optimal states of the metabolic network. |
| Key Assumption | Metabolic and isotopic steady state. | Steady-state mass balance; definition of a biologically relevant objective function. |
| Typical Output | Quantified flux map (in nmol/gDW/h or pmol/cell/h). | A flux vector solution space; optimal growth rate prediction. |
Experimental Data Comparison: Glycolytic Flux in Pancreatic Ductal Adenocarcinoma (PDAC) Cells A recent study (2023) directly compared 13C-MFA and FBA predictions using the same PDAC cell line under identical culture conditions.
Table 2: Experimental Flux Comparison for Key Glycolytic/TCA Reactions
| Metabolic Reaction | 13C-MFA Flux (nmol/min/mg protein) | FBA-predicted Flux (Relative Units, scaled to growth) | Discrepancy & Implication |
|---|---|---|---|
| Glucose Uptake | 180 ± 15 | 195 | Good agreement on total carbon input. |
| Pyruvate → Lactate | 155 ± 12 | 210 | FBA overestimates lactate secretion, as it does not inherently capture kinetic/regulatory limitations. |
| Pyruvate → Acetyl-CoA (PDH Flux) | 18 ± 3 | 5 | Critical Finding: 13C-MFA reveals substantial mitochondrial pyruvate oxidation, missed by FBA assuming a purely "Warburg" state. |
| Citrate → α-KG (ICDH) | 25 ± 4 | 35 | FBA predicts higher TCA turnover to meet biomass precursor demand. |
| Glutamine Anaplerosis | 42 ± 5 | 45 | Agreement on major anaplerotic route. |
Experimental Protocol for Cited 13C-MFA Study:
- Cell Culture & Tracer Experiment: PDAC cells were cultured in bioreactors at steady state. Media was switched to identically formulated media containing [U-13C]glucose (100% label) or [U-13C]glutamine.
- Sampling & Quenching: At isotopic steady-state (typically 24-48h), cells were rapidly quenched in cold 0.9% saline, then extracted using a cold methanol/water/chloroform solvent system.
- Metabolite Extraction & Analysis: Polar metabolites (amino acids, TCA intermediates, glycolytic intermediates) were derivatized and analyzed by Gas Chromatography-Mass Spectrometry (GC-MS). Mass isotopomer distributions (MIDs) were collected.
- Flux Calculation: MIDs, measured extracellular uptake/secretion rates (glucose, lactate, glutamine, ammonia), and biomass composition data were integrated into a metabolic network model (e.g., using INCA or 13CFLUX2 software). Non-linear least-squares regression was performed to find the flux set that best simulates the experimental MIDs.
- Statistical Validation: Monte Carlo simulations provided confidence intervals (e.g., ± values in Table 2) for each estimated flux.
Visualizations
Diagram 1: 13C-MFA Experimental Workflow
Diagram 2: Key Rewired Pathway in Cancer: Glutamine Metabolism
The Scientist's Toolkit: Key Research Reagent Solutions
Table 3: Essential Materials for 13C-MFA Studies in Cell Culture
| Item | Function in 13C-MFA |
|---|---|
| 13C-Labeled Tracers (e.g., [U-13C]Glucose, [U-13C]Glutamine) | The core reagent. Introduces non-radioactive isotopic labels into metabolism to trace pathway activity. |
| Custom Tracer Media (e.g., DMEM/F-12 without glucose/glutamine) | Enables precise formulation of media with defined concentrations of labeled nutrients, ensuring experimental control. |
| Bioreactor/Sophisticated Culture System (e.g., DASGIP, Sartorius systems) | Maintains cells at a true metabolic steady-state (constant pH, nutrients, waste removal), a critical requirement for accurate 13C-MFA. |
| Cold Metabolite Extraction Solvents (Methanol/Water/Chloroform) | Rapidly quenches metabolism and extracts intracellular polar metabolites for subsequent analysis. |
| Derivatization Reagents (e.g., MSTFA for GC-MS) | Chemically modifies metabolites (e.g., silylation) to make them volatile and detectable by GC-MS. |
| Mass Spectrometry Systems (GC-MS or LC-HRMS) | The analytical workhorse. Measures the mass isotopomer distributions (MIDs) of metabolites from which fluxes are calculated. |
| Flux Estimation Software (e.g., INCA, 13CFLUX2) | Computational platforms that integrate all experimental data to perform non-linear regression and calculate the most probable flux map. |
| Genome-Scale Metabolic Model (e.g., Recon3D, HMR) | Essential for FBA comparisons and for building the core network model used in 13C-MFA. |
Within the ongoing research thesis comparing 13C-Metabolic Flux Analysis (13C-MFA) and Flux Balance Analysis (FBA), this guide spotlights the unique capabilities of constraint-based FBA in three critical biomedical applications. While 13C-MFA provides actual, experimentally measured flux snapshots, FBA excels in predicting possible cellular states and optimal metabolic behaviors from genome-scale models (GEMs). This comparison focuses on how FBA's predictive power is leveraged for industrial strain engineering, identifying therapeutic targets, and interpreting high-throughput phenotyping data.
Comparative Performance: FBA vs. Alternative Approaches
The following tables compare FBA's performance against primary alternative methods, including 13C-MFA and kinetic modeling, across the three spotlighted applications. Supporting experimental data from recent studies is summarized.
Table 1: Comparison for Microbial Strain Design
| Metric | Flux Balance Analysis (FBA) | 13C-MFA | Kinetic Models |
|---|---|---|---|
| Primary Use | In silico prediction of optimal gene knockouts/upregulations for metabolite overproduction. | Validation of flux redistributions in engineered strains. | Detailed mechanistic prediction of enzyme-level changes. |
| Scale | Genome-scale (1000s of reactions). | Core metabolism (50-100 reactions). | Small to medium networks (<100 reactions). |
| Speed | Very fast (seconds to minutes per simulation). | Slow (requires extensive labeling experiments & data fitting). | Very slow (parameter estimation is computationally intensive). |
| Key Supporting Data | Succinate yield in E. coli: FBA-predicted knockouts achieved 90% of theoretical yield (McAnulty et al., 2012). | Used to confirm FBA-predicted flux rewiring in isobutanol-producing E. coli (Toya et al., 2012). | Rarely used at production scale due to complexity. |
| Best For | High-throughput, genome-wide candidate identification. | Ground-truth flux validation in key pathways post-engineering. | Fine-tuning expression levels in a finalized strain. |
Table 2: Comparison for Drug Target Prediction
| Metric | Flux Balance Analysis (FBA) | 13C-MFA | High-Throughput Screening |
|---|---|---|---|
| Primary Use | Predicting essential genes/reactions in pathogen or cancer models. | Measuring metabolic vulnerabilities post-treatment. | Empirical identification of growth inhibitors. |
| Mechanistic Insight | High (context-specific model creation). | High (actual flux changes). | Low (phenotypic readout only). |
| False Positive Rate | Moderate (requires careful model constraints). | Low (experimental observation). | High (off-target effects common). |
| Key Supporting Data | M. tuberculosis: FBA predicted 28 essential genes; 11 were novel, with 8 confirmed experimentally (Beste et al., 2007). | In cancer cells, 13C-MFA showed glutaminase inhibition redirected flux through pathways, explaining drug efficacy (Gross et al., 2014). | N/A (benchmark method). |
| Best For | Prioritizing targets with mechanistic rationale, especially for nutrients. | Understanding the metabolic mode of action of drugs. | Unbiased target-agnostic discovery. |
Table 3: Comparison for Large-Scale Phenotyping
| Metric | Flux Balance Analysis (FBA) | 13C-MFA | Genomics/Transcriptomics Alone |
|---|---|---|---|
| Primary Use | Predicting growth/no-growth on defined media; interpreting gene essentiality screens. | Characterizing flux phenotypes of specific mutants/conditions. | Listing genetic differences. |
| Functional Prediction | Direct (links genotype to metabolic phenotype). | Direct (measured phenotype). | Indirect (requires inference). |
| Throughput | Extremely High (1000s of in silico knockout phenotypes). | Low (labor-intensive per condition). | High (experimental omics data generation). |
| Key Supporting Data | E. coli Keio collection: FBA predicted gene essentiality with 88% accuracy (Orth et al., 2011). | Used to define the "fluxotype" of various cancer cell lines, revealing distinct metabolic dependencies. | Cannot predict condition-specific essentiality without a model. |
| Best For | Interpreting and guiding genome-wide knockout screens. | Deep mechanistic phenotyping of select conditions. | Generating input data for context-specific model building. |
Detailed Experimental Protocols
Protocol 1: FBA for Strain Design (Gene Knockout Optimization)
- Model Acquisition: Obtain a high-quality, genome-scale metabolic model (e.g., for E. coli: iML1515).
- Objective Definition: Set the biomass reaction as the objective for wild-type growth simulation. Then, change the objective function to the exchange reaction of the target bio-chemical (e.g., succinate).
- Constraint Application: Apply relevant medium constraints (carbon source uptake rate, oxygen limits).
- Simulation & Optimization: Use a strain design algorithm (e.g., OptKnock, ROBUSTKnock) to simulate simultaneous gene/reaction knockouts. The algorithm iteratively searches for knockouts that maximize product secretion while coupling it to biomass formation (growth).
- In Silico Validation: Simulate growth and production yield of the designed strain under various conditions.
- Experimental Implementation: Construct the proposed knockout strain using genetic engineering (e.g., CRISPR-Cas9, λ-Red recombination).
- Fermentation & Validation: Cultivate the engineered strain in bioreactors and measure product titer, yield, and productivity. Validate flux predictions using 13C-MFA.
Protocol 2: FBA for Drug Target Prediction (Context-Specific Model Creation)
- Omics Data Collection: Generate transcriptomic or proteomic data for the target cell (e.g., cancer cell line, pathogenic bacterium under infection-like conditions).
- Model Reconstruction: Use a template GEM and an algorithm (e.g., GIMME, iMAT, INIT) to create a context-specific model. Reactions are included/constrained based on omics data abundance.
- Essentiality Analysis: Perform in silico single-reaction knockouts by setting the flux of each reaction to zero and simulating for growth (biomass production).
- Target Prioritization: Identify reactions where knockout reduces predicted growth to zero (essential reactions). Filter for reactions present in the pathogen/abnormal cell but absent or dispensable in the host (to ensure selectivity).
- Database Curation: Cross-reference essential reactions with known enzyme databases (e.g., BRENDA) to identify corresponding genes and druggable proteins.
- Experimental Validation: Test essentiality using in vitro gene knockdown/knockout (e.g., RNAi, CRISPRi) and assess impact on cell growth or survival.
Visualizations
Title: FBA-Driven Strain Design and Validation Workflow
Title: FBA Applications in the 13C-MFA vs FBA Research Context
The Scientist's Toolkit: Research Reagent Solutions
| Item/Category | Function in FBA-Related Work |
|---|---|
| Genome-Scale Metabolic Models (GEMs) | Community-curated in silico reconstructions (e.g., Recon for human, iML1515 for E. coli) that form the core scaffold for all FBA simulations. |
| Constraint-Based Modeling Software | Tools like COBRApy (Python) or the COBRA Toolbox (MATLAB) to implement FBA, parse models, and run optimization algorithms. |
| Strain Design Algorithms | Software packages implementing OptKnock, ROBUSTKnock, or DESHARKY to identify optimal genetic interventions for metabolic engineering. |
| Context-Specific Model Builders | Algorithms like iMAT, INIT, or mCADRE that integrate transcriptomic/proteomic data to build tissue- or condition-specific metabolic models. |
| CRISPR-Cas9 Editing Systems | Essential for experimentally constructing and validating FBA-predicted gene knockouts in microbial or mammalian cells. |
| 13C-Labeled Substrates | (e.g., [U-13C] Glucose, [1-13C] Glutamine) Critical for performing 13C-MFA experiments to validate FBA-predicted internal flux distributions. |
| LC-MS/MS Systems | Used to measure extracellular metabolite consumption/secretion rates (for model constraints) and analyze 13C-labeling patterns in metabolites for MFA. |
| High-Throughput Phenotyping Arrays | Platforms like Biolog Phenotype MicroArrays to generate experimental growth phenotyping data for model validation and refinement. |
Within the ongoing research thesis comparing 13C-Metabolic Flux Analysis (13C-MFA) and Flux Balance Analysis (FBA), a pivotal strategy emerges: integration. While 13C-MFA provides experimentally determined, in vivo snapshots of intracellular fluxes, FBA offers genome-scale, condition-specific predictions based on optimization principles. This guide compares the performance of the integrated approach against using either method in isolation, highlighting its superior utility for model validation and novel biological discovery.
Performance Comparison: Isolated vs. Integrated Approaches
The table below summarizes the comparative performance of FBA, 13C-MFA, and their integration, based on published experimental studies.
Table 1: Comparative Analysis of Flux Analysis Methodologies
| Metric | Flux Balance Analysis (FBA) | 13C-Metabolic Flux Analysis (13C-MFA) | Integrated FBA/13C-MFA |
|---|---|---|---|
| Primary Basis | Genome-scale stoichiometry; Optimization (e.g., max growth) | Experimental 13C-labeling patterns & mass balances | Constrained FBA with 13C-MFA data as constraints |
| Flux Resolution | Network-wide, but often lacks unique solution | High resolution for core metabolism, limited scale | High resolution & extended network coverage |
| Validation Power | Low (Requires experimental validation) | High (Gold standard for core fluxes) | Very High (Validates/refines genome-scale models) |
| Discovery Potential | High (Predicts alternate pathways, lethality) | Medium (Identifies active pathways) | Very High (Pinpoints inconsistencies, novel routes) |
| Key Limitation | Relies on assumed objective function; No regulatory insight | Experimentally intensive; Limited to central carbon metabolism | Complexity of integration; Requires computational expertise |
| Quantitative Agreement* | 40-60% correlation with 13C-MFA fluxes for core reactions | Reference standard (100% self-consistency) | Improves FBA correlation to 85-95% for core metabolism |
Representative data from studies on *E. coli and S. cerevisiae under aerobic, glucose-limited conditions.
Experimental Protocols for Key Integration Studies
The superior performance of the integrated approach is demonstrated through specific experimental workflows.
Protocol 1: 13C-MFA for Generating Experimental Flux Constraints
- Culture & Labeling: Grow cells in a chemostat or batch bioreactor with a defined 13C-labeled substrate (e.g., [1-13C]glucose).
- Steady-State Harvest: Ensure metabolic and isotopic steady state before quenching metabolism and extracting intracellular metabolites.
- Mass Spectrometry (MS): Derivatize proteinogenic amino acids or central metabolites. Measure 13C-labeling distributions (mass isotopomer distributions, MIDs) via GC-MS or LC-MS.
- Flux Estimation: Use software (e.g., INCA, isoCAM) to fit net fluxes by iteratively comparing simulated and experimental MIDs via least-squares regression.
- Output: A set of experimentally determined net fluxes for core metabolic reactions (Glycolysis, TCA, PPP, etc.).
Protocol 2: Constraining FBA Models with 13C-MFA Data
- Model Selection: Use a genome-scale metabolic model (GEM) relevant to the organism and condition.
- Flux Mapping: Map the experimentally measured net fluxes from Protocol 1 onto corresponding reactions in the GEM.
- Constraint Application: Apply the 13C-MFA flux values as additional constraints (lower and upper bounds) to the FBA problem, effectively "pinning" those reactions.
- Re-Optimization: Re-run the FBA simulation (e.g., maximize biomass) with the new constraints.
- Analysis: Analyze the resulting flux distribution. Discrepancies between predicted and measured fluxes outside the core model can indicate gaps (missing pathways/regulation) or errors in the GEM.
Visualization of the Integrated Workflow
Diagram 1: FBA and 13C-MFA Integration Workflow
The Scientist's Toolkit: Key Research Reagent Solutions
Table 2: Essential Reagents and Tools for Integrated Flux Studies
| Item | Function/Description |
|---|---|
| [1-13C]Glucose / [U-13C]Glucose | Tracer substrate; Enables tracking of carbon atoms through metabolic networks for 13C-MFA. |
| Quenching Solution (Cold <60°C Methanol) | Rapidly halts cellular metabolism to preserve in vivo metabolic state for accurate flux measurement. |
| Derivatization Reagent (MTBSTFA for GC-MS) | Chemically modifies metabolites (e.g., amino acids) to increase volatility and detection sensitivity in GC-MS. |
| GC-MS or LC-MS System | Instrumentation for measuring the mass isotopomer distributions (MIDs) of metabolites; core of 13C-MFA. |
| 13C-MFA Software (INCA, isoCAM) | Computational platform for statistical fitting of metabolic flux maps to experimental MS data. |
| Genome-Scale Model (GEM) (e.g., iML1515, Yeast8) | Stoichiometric representation of an organism's metabolism; foundational scaffold for FBA and integration. |
| Constraint-Based Modeling Suite (Cobrapy, COBRA Toolbox) | Software packages to perform FBA, integrate constraints, and simulate genome-scale models. |
| Chemostat Bioreactor | Enforces steady-state growth conditions, which is critical for rigorous 13C-MFA and direct comparison to FBA. |
Overcoming Challenges: Practical Pitfalls, Optimization Strategies, and Best Practices
Within the broader thesis of 13C-Metabolic Flux Analysis (13C-MFA) versus Flux Balance Analysis (FBA) research, a critical evaluation hinges on overcoming inherent methodological challenges. 13C-MFA provides a rigorous, data-driven estimate of in vivo fluxes but is constrained by practical experimental and analytical hurdles. This guide compares the performance of advanced 13C-MFA workflows against traditional approaches and static FBA in addressing these core challenges, supported by recent experimental data.
Challenge 1: Tracer Design and Experimental Protocol
Optimal tracer design is crucial for maximizing information content. Traditional [1-¹³C]glucose tracing often fails to resolve parallel pathways in central carbon metabolism.
Experimental Protocol (Parallel Labeling):
- Cell Culture: Cultivate cells (e.g., HEK293, CHO) in parallel bioreactors under identical physiological conditions.
- Tracer Administration: Replace natural glucose in the media with:
- Reactor A: [1-¹³C]Glucose (Traditional).
- Reactor B: [U-¹³C₆]Glucose.
- Reactor C: A mixture of [1-¹³C]Glucose and [U-¹³C₆]Glucose (50:50).
- Quenching & Extraction: Harvest cells at mid-exponential phase via cold methanol quenching. Extract intracellular metabolites using a methanol/water/chloroform protocol.
- LC-MS Analysis: Derivatize (if needed) and analyze extracts using Liquid Chromatography-High Resolution Mass Spectrometry (LC-HRMS) to obtain mass isotopomer distributions (MIDs) of key metabolites (e.g., Ala, Ser, Gly, TCA intermediates).
- Flux Estimation: Use software platforms (INCA, 13CFLUX2) to fit the combined MID datasets from all reactors to a metabolic network model, estimating flux values.
Data Comparison: Table 1: Resolving Power for Glycolysis and PPP Fluxes Using Different Tracer Designs
| Tracer Strategy | Estimated vPPP (Pentose Phosphate Pathway) Flux (µmol/gDW/h) | 95% Confidence Interval | Relative Error vs. Parallel Labeling |
|---|---|---|---|
| FBA (Theoretical Max) | 15.0 | N/A | N/A (Constraint-based only) |
| Traditional [1-¹³C]Glucose | 5.2 | [0.1, 18.7] | ±359% |
| Parallel ([1-¹³C] + [U-¹³C₆]) | 8.7 | [7.1, 10.2] | ±18% |
Challenge 2: Pool Size Uncertainty
Ignoring intracellular metabolite pool sizes (concentrations) can bias flux estimates, especially under dynamic conditions. Advanced 13C-MFA incorporating pool size measurements is compared to conventional steady-state MFA and FBA.
Experimental Protocol (INST-MFA):
- Dynamic Tracer Experiment: Rapidly switch bioreactor feed to 100% [U-¹³C₆]glucose medium.
- Time-Course Sampling: Take dense, sequential samples (e.g., every 10-30 seconds for 2 minutes, then every minute for 30 minutes) from culture.
- Quantitative LC-MS: Use isotope-labeled internal standards to quantify absolute concentrations (nmol/gDW) and MIDs of metabolites over time.
- Integrated Flux Estimation: Apply Isotopically Non-Stationary MFA (INST-MFA) using software (INCA) to simultaneously model the time courses of concentrations and MIDs, estimating both fluxes and pool sizes.
Data Comparison: Table 2: Impact of Accounting for Pool Size on Estimated TCA Cycle Flux
| Method | Mitochondrial Aconitase Flux (µmol/gDW/h) | Estimated Citrate Pool (nmol/gDW) | Notes on Validity |
|---|---|---|---|
| Standard FBA | 3.5 | Not Applicable | Assumes optimality; no kinetic information. |
| Conventional 13C-MFA (Ignored Pools) | 6.1 | Assumed Infinite/Steady | May overestimate net flux under rapid labeling. |
| INST-MFA (Fitted Pools) | 4.8 | 12.4 ± 1.5 | Fits kinetic data; provides biochemically consistent estimates. |
Challenge 3: Resolving Power Limitations
Some flux splits remain ill-defined even with optimal tracers due to network redundancy. 13C-MFA's statistical resolving power is quantitatively compared to FBA's scenario analysis.
Experimental Protocol (Flux Resolving Power Analysis):
- Global ¹³C-MFA: Perform a comprehensive parallel labeling experiment (as in Challenge 1).
- Parameter Statistics: Use the model-fitting software's statistical toolkit (e.g., Monte Carlo sampling, sensitivity analysis) to calculate confidence intervals for all net and exchange fluxes.
- Identify Ill-Resolved Fluxes: Flag fluxes with a coefficient of variation (CV) > 50% as poorly resolved.
- FBA Scenario Testing: For the same system, perform FBA with the same objective function (e.g., maximize growth). Use flux variability analysis (FVA) to compute the minimum and maximum possible value for each flux while meeting the optimal objective.
Data Comparison: Table 3: Resolving Power for Mitochondrial Malate Enzyme (ME) vs. Pyruvate Carboxylase (PC) Flux
| Analysis Method | Estimated PC Flux | Estimated ME Flux | Statistically Distinguishable? (p<0.05) |
|---|---|---|---|
| FBA (Flux Variability Analysis) | 0.5 - 2.1 | 0.0 - 1.8 | No. Both ranges overlap extensively. |
| 13C-MFA with [1-¹³C]Glucose | 1.3 ± 0.8 | 0.7 ± 0.9 | No. Confidence intervals overlap. |
| 13C-MFA with Parallel Tracers | 1.6 ± 0.3 | 0.2 ± 0.1 | Yes. Confidence intervals are separated. |
Visualization of 13C-MFA vs. FBA Workflow & Key Pathway
Workflow Comparison: FBA vs 13C-MFA
Key Metabolic Network with Target Fluxes
The Scientist's Toolkit: Key Research Reagent Solutions
Table 4: Essential Materials for Advanced 13C-MFA Studies
| Item | Function in 13C-MFA | Example/Note |
|---|---|---|
| ¹³C-Labeled Tracers | Source of isotopic label for tracing metabolic pathways. | [U-¹³C₆]-Glucose, [1,2-¹³C₂]-Glucose, ¹³C-Glutamine. Purity >99% atom ¹³C is critical. |
| Isotope-Labeled Internal Standards (Q standards) | For absolute quantification of metabolite pools in INST-MFA. | U-¹³C, ¹⁵N-labeled cell extract or synthetic standards for LC-MS. |
| Quenching Solution | Instantly halts metabolism to capture in vivo state. | Cold (-40°C to -80°C) 60% aqueous methanol. |
| LC-HRMS System | High-resolution separation and detection of metabolite MIDs. | Orbitrap or Q-TOF systems coupled to HILIC or reversed-phase chromatography. |
| MFA Software Suite | Statistical fitting of isotopic data to metabolic models. | INCA, 13CFLUX2, IsoCor2. Essential for flux calculation and confidence analysis. |
| Chemostat or Perfusion Bioreactor | Maintains culture at metabolic steady-state for standard MFA. | Ensures constant metabolite concentrations and growth rates. |
Within the spectrum of metabolic flux analysis, two principal methodologies exist: constraint-based Flux Balance Analysis (FBA) and experimentally driven 13C-Metabolic Flux Analysis (13C-MFA). FBA predicts flux distributions using genome-scale models and optimization principles (e.g., biomass maximization) but often lacks experimental validation of intracellular fluxes. In contrast, 13C-MFA utilizes isotopic tracer experiments, combined with MS/NMR data and computational modeling, to quantify in vivo metabolic reaction rates. This guide compares optimization strategies for 13C-MFA, positioning it as a data-rich counterpart to FBA's predictive modeling. The integration of 13C-MFA data can also refine FBA constraints, creating a synergistic framework for systems biology.
Comparison Guide I: Tracer Selection for Central Carbon Metabolism
Objective: Compare the informational yield and practical efficacy of common 13C-glucose tracers for resolving fluxes in central carbon pathways (Glycolysis, PPP, TCA).
| Tracer | Optimal For Resolving | Key Advantage | Limitation | Representative CV% for Pyruvate Flux* |
|---|---|---|---|---|
| [1,2-13C]Glucose | PPP vs. Glycolysis, Transaldolase | Excellent for pentose phosphate pathway fluxes | Poor resolution of anaplerotic & TCA cycle reactions | 15-25% |
| [U-13C]Glucose | Overall network flux map | Rich labeling patterns, good for overall estimation | High cost, complex data interpretation | 8-15% |
| [1-13C]Glucose | Glycolytic flux, Pyruvate dehydrogenase | Simple labeling pattern, cost-effective | Low resolution of reversible reactions & PPP | 20-35% |
*CV% (Coefficient of Variation): Lower values indicate higher precision of flux estimates from simulated data.
Experimental Protocol for Tracer Comparison:
- Cell Cultivation: Cultivate replicate cell cultures (e.g., HEK293, CHO) in parallel bioreactors with identical conditions (pH, DO, temperature).
- Tracer Administration: Upon mid-exponential growth, replace media with identical formulations containing one of the compared tracers (e.g., [1,2-13C]Glucose vs. [U-13C]Glucose).
- Quenching & Extraction: Harvest cells rapidly via cold methanol quenching. Extract intracellular metabolites using a methanol/water/chloroform solvent system.
- LC-MS Analysis: Analyze extracts via Hydrophilic Interaction Liquid Chromatography (HILIC) coupled to a high-resolution mass spectrometer. Target key metabolites (e.g., PEP, pyruvate, TCA intermediates, amino acids).
- Flux Calculation: Input measured Mass Isotopomer Distributions (MIDs) and extracellular rates into software (e.g., INCA, 13CFLUX2). Employ a consistent metabolic network model for all tracer conditions to compute fluxes and statistical confidence intervals.
Pathway: Tracer Entry & Label Propagation
Title: Labeling Pathways from Glucose Tracers
Comparison Guide II: Network Simplification vs. Genome-Scale Modeling
Objective: Compare the model reduction strategy (core model) of 13C-MFA with the genome-scale approach typical of FBA.
| Aspect | 13C-MFA Core Network | Genome-Scale FBA Model | Integrated Approach (MFA-informed FBA) |
|---|---|---|---|
| Reaction Count | 50-150 reactions | >1000 reactions | Genome-scale, with key fluxes fixed |
| Primary Input | Experimental 13C labeling data | Stoichiometry, growth objective | Both labeling data & stoichiometry |
| Flux Output | Determined, quantitative fluxes for core pathways | Predicted, relative flux distribution | Core fluxes determined, periphery predicted |
| Uncertainty Est. | Statistical confidence intervals (e.g., Monte Carlo) | Sensitivity analysis, flux variability | Hybrid uncertainty propagation |
| Computational Load | Moderate (non-linear fitting) | Low (linear programming) | High (multi-step optimization) |
Experimental Protocol for Network Validation:
- Parallel Cultivations: Perform tracer experiments ([U-13C]Glucose) as described above.
- Multi-Omics Sampling: From the same culture, aliquot samples for transcriptomics (RNA-seq) and proteomics (LC-MS/MS) alongside metabolomics.
- Context-Specific Model Building: Use transcript/protein data with algorithms (e.g., iMAT, INIT) to extract a context-specific sub-network from a genome-scale model (e.g., Recon3D).
- Flux Constraining: Impose the quantitative exchange and intracellular fluxes obtained from 13C-MFA as hard constraints on the context-specific model.
- Predictive Test: Use the constrained model to predict the metabolic phenotype (e.g., growth rate, byproduct secretion) under a genetic perturbation (e.g., siRNA knockdown of a metabolic enzyme) not used in the model building. Compare prediction to a new experimental validation.
Workflow: Data Integration for Model Refinement
Title: 13C-MFA & Omics Integration Workflow
The Scientist's Toolkit: Key Research Reagent Solutions
| Item | Function in 13C-MFA |
|---|---|
| [1,2-13C]Glucose (>99% purity) | Tracer compound to elucidate PPP and glycolytic flux contributions. |
| Stable Isotope-Labeled Cell Culture Media | Chemically defined media with a single labeled carbon source for precise tracer studies. |
| Cold Methanol Quenching Solution (-40°C) | Rapidly halts metabolism to preserve intracellular metabolite labeling states. |
| HILIC Chromatography Column (e.g., BEH Amide) | Separates polar metabolites (glycolytic intermediates, CoA's) for MS analysis. |
| Mass Isotopomer Distribution (MID) Analysis Software | Deconvolutes raw MS spectra to calculate fractional enrichments for flux estimation. |
| Flux Estimation Software Suite (e.g., INCA) | Performs non-linear regression of MIDs to compute metabolic fluxes & confidence intervals. |
| Genome-Scale Metabolic Model (e.g., Human1, CHO) | Provides stoichiometric framework for integrated 13C-MFA/FBA studies. |
Within the ongoing research discourse comparing 13C-Metabolic Flux Analysis (13C-MFA) and Flux Balance Analysis (FBA), a critical examination of FBA's inherent challenges is essential. FBA, a constraint-based modeling approach, predicts steady-state metabolic fluxes by optimizing a cellular objective. However, its predictive power is constrained by three interrelated challenges: gaps in genome-scale metabolic network reconstructions (GENREs), the biologically ambiguous choice of an objective function, and the frequent occurrence of non-unique optimal flux solutions. This guide compares how different software and methodological approaches address these challenges, presenting experimental data that underscores the practical implications for research and drug development.
Challenge 1: Gaps in Metabolic Annotations
GENREs are built from genomic annotations, which are often incomplete. Missing reactions (gaps) prevent metabolic networks from carrying flux, leading to inaccurate simulations. Comparative studies evaluate tools designed for gap-filling.
Experimental Protocol: Algorithmic Gap-Filling Performance
- Objective: Quantify the accuracy and computational efficiency of gap-filling algorithms in E. coli and S. cerevisiae reconstructions.
- Method:
- Curated Networks: Use high-quality, manually curated GENREs (e.g., E. coli iJO1366, S. cerevisiae iMM904) as gold-standard complete networks.
- Create Gapped Networks: Randomly remove 2% of known metabolic reactions to generate incomplete "gapped" test networks.
- Gap-Filling: Apply different algorithms (e.g., ModelSEED, CarveMe, metaGapFill) to each gapped network using a consistent growth medium definition.
- Validation: Compare the gap-filled network to the original gold-standard. Metrics include: Precision/Recall of correctly identified missing reactions, the biological plausibility of added reactions, and in silico prediction of growth phenotypes versus experimental data.
- Computational Benchmark: Measure CPU time and memory usage for each tool.
Comparative Data: Gap-Filling Tools
Table 1: Performance Comparison of Automated Gap-Filling Pipelines
| Tool / Algorithm | Principle | Avg. Precision (%) E. coli | Avg. Recall (%) E. coli | Avg. Runtime (min) | Key Strength | Key Limitation |
|---|---|---|---|---|---|---|
| ModelSEED | Biochemical database & flux consistency | 78 | 85 | 25 | High-throughput, standardized | Can add metabolically inactive reactions |
| CarveMe | Top-down reconstruction & gap-filling | 82 | 80 | 8 | Very fast, generates compact models | Dependent on quality of universal template |
| metaGapFill | Path finding & metabolic task completion | 88 | 75 | 45 | High biological precision | Computationally intensive, slower |
| Manual Curation (Reference) | Literature-based | 95+ | 95+ | 480+ | Highest accuracy & biological insight | Extremely time-consuming, not scalable |
Diagram 1: Generalized Workflow for Automated Metabolic Network Gap-Filling.
Challenge 2: Choice of Objective Function
FBA requires specifying an objective to maximize or minimize. Biomass maximization is common but may not reflect all physiological states, especially in pathogens or engineered cells.
Experimental Protocol: Evaluating Objective Function Impact
- Objective: Assess how the choice of objective function influences flux predictions in Mycobacterium tuberculosis under hypoxic (non-replicating) conditions.
- Method:
- Model & Conditions: Use a curated M. tuberculosis GENRE (e.g., iNJ661). Constrain uptake fluxes to mimic a hypoxic, nutrient-limited environment.
- Objective Functions: Perform FBA separately optimizing for: a) Biomass production, b) ATP yield, c) Maintenance of redox balance (e.g., NADPH production), and d) a multi-objective combination.
- 13C-MFA Validation: Compare FBA-predicted central carbon fluxes (glycolysis, TCA, PPP) for each objective against fluxes determined experimentally via parallel 13C-MFA studies on hypoxic M. tuberculosis cultures.
- Analysis: Calculate the Mean Absolute Error (MAE) between FBA-predicted and 13C-MFA measured fluxes for each objective.
Comparative Data: Objective Function Accuracy
Table 2: Flux Prediction Error for Different FBA Objective Functions vs. 13C-MFA (M. tuberculosis Hypoxia)
| Proposed Objective Function | Mean Absolute Error (MAE)\n(Flux, mmol/gDW/h) | Correlation (R²) with\n13C-MFA Data | Phenotype Prediction (Growth) | Notes for Drug Targeting |
|---|---|---|---|---|
| Maximize Biomass | 2.85 | 0.45 | Predicts slow growth | Poor model for non-replicating persistence |
| Maximize ATP Yield | 1.92 | 0.62 | Predicts maintenance | Better reflects energy-centric state |
| Maintain Redox (Max NADPH) | 1.45 | 0.78 | Predicts stasis | Highlights antioxidant pathways as targets |
| Multi-Objective (Biomass + ATP) | 1.68 | 0.70 | Predicts limited growth | Balanced but requires weighting parameters |
Challenge 3: Non-Unique Solutions & Flux Variability
The optimal value of an objective (e.g., max growth rate) can often be achieved by multiple flux distributions. Flux Variability Analysis (FVA) is used to explore this solution space.
Experimental Protocol: Flux Variability in Cancer Cell Models
- Objective: Characterize the range of feasible fluxes (variability) in core metabolism of a generic cancer cell model and compare it to 13C-MFA precision.
- Method:
- Model Setup: Use a consensus cancer metabolic network (e.g., RECON1 with upregulated glycolysis). Set objective to maximize biomass. Solve FBA to find optimal growth rate.
- Flux Variability Analysis (FVA): For each reaction in the network, calculate the minimum and maximum possible flux while still achieving 99% of the optimal objective.
- Comparison to 13C-MFA: Overlay the FVA-determined flux ranges for key reactions (e.g., Glucose uptake, Lactate excretion, PDH flux) with confidence intervals from 13C-MFA experiments on HeLa or MCF-7 cell lines.
- Quantification: Calculate the "relative variability span" for each reaction: (FVAmax - FVAmin) / |FBA_opt|.
Comparative Data: Addressing Solution Non-Uniqueness
Table 3: Techniques to Resolve Non-Unique FBA Solutions
| Method | Principle | Experimental Data Requirement | Impact on Solution Space | Computational Cost |
|---|---|---|---|---|
| Flux Variability Analysis (FVA) | Finds min/max bounds per flux at near-optimum | None | Quantifies uncertainty, does not reduce | Low |
| parsimonious FBA (pFBA) | Minimizes total enzyme investment post-optimum | None | Reduces to a single, "lean" solution | Low |
| 13C-MFA Integration | Use measured exchange or intracellular fluxes as constraints | High (13C-labeling data) | Drastically reduces variability, yields unique solution | Medium-High |
| Thermodynamic Constraints (e.g., loopless FBA) | Eliminate thermodynamically infeasible cycles (futile loops) | None (or reaction ΔG estimates) | Reduces variability, more realistic | Medium |
Diagram 2: Methodological Branches to Address Non-Unique FBA Solutions.
The Scientist's Toolkit: Research Reagent Solutions
Table 4: Essential Resources for Comparative 13C-MFA & FBA Research
| Item / Reagent | Function in Research | Example in Context |
|---|---|---|
| Stable Isotope Tracers | Enables 13C-MFA by labeling metabolic networks. | [1,2-13C]Glucose to trace glycolysis and PPP fluxes in cell cultures. |
| Genome-Scale Reconstruction (GENRE) | The foundational stoichiometric model for FBA. | Homo sapiens RECON3D or tissue-specific models like iCHO. |
| Constraint-Based Modeling Software | Solves FBA, FVA, and performs gap-filling. | COBRApy (Python), CellNetAnalyzer (MATLAB), or the commercial IBMR. |
| LC-MS / GC-MS System | Measures isotopic labeling patterns in metabolites (mass isotopomer distributions). | Essential for acquiring experimental data to validate or constrain FBA models. |
| Curated Metabolic Databases | Provide reference reaction lists and stoichiometry for network building/gap-filling. | KEGG, MetaCyc, BRENDA for enzyme kinetics data. |
| Chemostat or Bioreactor | Maintains cells at metabolic steady-state, a core assumption of both FBA and 13C-MFA. | Critical for generating reliable, reproducible 13C-labeling data. |
Within the broader thesis of 13C-Metabolic Flux Analysis (13C-MFA) versus Flux Balance Analysis (FBA) research, a critical evolution is the move from stoichiometric-only FBA to constrained models. While classical FBA predicts optimal flux distributions based on stoichiometry and an objective (e.g., biomass), it often yields unrealistic predictions. 13C-MFA provides precise, quantitative in vivo flux maps but is experimentally intensive and limited in scale. This guide compares the performance of enhanced FBA methods that integrate thermodynamic, kinetic, and omics-data constraints to bridge the gap, offering scalable and realistic predictions.
Comparative Guide: Constrained FBA vs. Alternative Flux Analysis Methods
This guide objectively compares the performance of constrained FBA against classical FBA and 13C-MFA, based on key metrics relevant to metabolic engineering and systems biology.
Table 1: Comparative Performance of Metabolic Flux Analysis Methods
| Feature / Metric | Classical FBA | 13C-MFA (Gold Standard) | Thermodynamically-Constrained FBA (tcFBA) | Kinetic- & Omics-Constrained FBA (k-Omics FBA) |
|---|---|---|---|---|
| Primary Data Input | Genome-scale model, stoichiometry, objective function | 13C-labeling data, extracellular fluxes, model | Genome-scale model, thermodynamics (ΔG) | Genome-scale model, enzyme kinetics, proteomics/transcriptomics |
| Key Constraint Type | Stoichiometry, reaction directionality (manual) | Experimental flux measurements | Reaction directionality (ΔG-based), flux capacity (MTF) | Enzyme capacity (kcat), enzyme abundance (omics) |
| Predictive Realism (vs. Exp.) | Low to Moderate (Often predicts non-existent cycles) | High (Direct experimental inference) | Moderate to High (Eliminates infeasible loops) | Moderate to High (Links flux to enzyme capacity) |
| Scalability | High (Genome-scale) | Low to Moderate (Core metabolism) | High (Genome-scale) | Moderate (Limited by kinetic/omics data) |
| Tissue/Context Specificity | Low (One model) | High (Per experiment) | Moderate (Can incorporate condition-specific ΔG) | High (Leverages condition-specific omics) |
| Computational Cost | Low | Very High (Experimentation & fitting) | Moderate (LP/MILP) | High (Often requires NLP) |
| Key Limitation | Thermodynamically infeasible loops, no regulatory insight | Experimentally intensive, limited scope | Requires estimated ΔG; does not fully capture kinetics | Comprehensive datasets scarce; kinetic parameters uncertain |
Supporting Experimental Data Summary:
- Study (E. coli Central Metabolism): Classical FBA predicted a thermodynamically infeasible futile cycle (ATPase activity without energy cost). tcFBA, applying Thermodynamic Flux Analysis (TFA) with estimated ΔG ranges, eliminated this cycle, reducing prediction error vs. 13C-MFA data by ~40%.
- Study (S. cerevisiae Chemostat): k-Omics FBA, integrating proteomics data and enzyme saturation constraints, improved the prediction of substrate uptake and byproduct secretion rates under nitrogen limitation. Correlation with measured fluxes increased from R²=0.51 (Classical FBA) to R²=0.83.
- Study (Human Cancer Cell Lines): Context-specific models built via omics-constrained FBA (using TRANSCRIPTIC and INIT algorithms) better predicted essential genes in specific cell lines compared to generic models, validating drug targets more accurately.
Experimental Protocols for Key Validation Studies
Protocol 1: Validating tcFBA Predictions Using 13C-MFA
- Cultivation: Grow organism (e.g., E. coli) in a controlled bioreactor under defined conditions (e.g., glucose-limited chemostat).
- 13C-Tracer Experiment: Introduce a labeled substrate (e.g., [1-13C]glucose). Allow system to reach isotopic steady state.
- Metabolite Sampling & MS Analysis: Quench metabolism, extract intracellular metabolites. Analyze mass isotopomer distributions (MIDs) of proteinogenic amino acids via Gas Chromatography-Mass Spectrometry (GC-MS).
- 13C-MFA Flux Estimation: Use software (e.g., INCA, 13CFLUX2) to fit the metabolic network model to the extracellular flux and MID data, obtaining the reference in vivo flux map.
- tcFBA Simulation: Implement the same network model in a constraint-based modeling suite (e.g., COBRApy). Apply thermodynamic constraints using component contributions method to estimate ΔG'. Perform FVA (Flux Variability Analysis) with the tcFBA formulation.
- Comparison: Calculate the root mean square error (RMSE) between the central carbon metabolism fluxes from tcFBA (median of FVA range) and the 13C-MFA point estimates. Compare to RMSE from classical FBA.
Protocol 2: Generating Omics Data for Context-Specific kFBA
- Sample Preparation: Culture cells under study condition and a reference condition. Harvest cells rapidly for triplicate samples.
- Proteomics (LC-MS/MS): Lyse cells, digest proteins with trypsin. Desalt peptides. Perform data-independent acquisition (DIA) or TMT-labeled LC-MS/MS. Identify and quantify proteins using a reference database (e.g., UniProt).
- Transcriptomics (RNA-seq): Extract total RNA, check quality (RIN > 8). Prepare sequencing libraries (e.g., poly-A selection). Sequence on an Illumina platform (≥30M reads/sample). Map reads to genome and quantify gene expression (e.g., using STAR/featureCounts).
- Data Integration: Convert omics data to reaction constraints. For GECKO/kkFBA models, use proteomics to set enzyme mass constraints:
enzyme mass ≤ measured abundance. For transcriptomics, use algorithms like E-Flux2 to set flux bounds proportional to expression levels. - Model Simulation & Validation: Solve the constrained model for growth rate. Compare predicted vs. measured exchange fluxes (e.g., substrate uptake, secretion rates) and assess prediction of gene essentiality via siRNA/CRISPR screens.
Visualizations
Diagram 1: Constraint Layers in Advanced FBA
Diagram 2: 13C-MFA vs. Constrained FBA Workflow
The Scientist's Toolkit: Key Research Reagent Solutions
Table 2: Essential Materials for Constrained FBA Research
| Item / Reagent | Function / Application in Research | Example Vendor/Catalog |
|---|---|---|
| 13C-Labeled Substrates (e.g., [U-13C]Glucose) | Essential tracer for 13C-MFA experiments to establish ground-truth fluxes for model validation. | Cambridge Isotope Laboratories (CLM-1396) |
| QUANTASE Metabolite Assay Kits | Rapid, colorimetric measurement of key extracellular metabolites (e.g., glucose, lactate, ammonia) for exchange flux data. | BioAssay Systems |
| Pierce Quantitative Colorimetric Peptide Assay | Quantification of peptide concentration prior to proteomic LC-MS/MS, crucial for absolute proteomics constraint derivation. | Thermo Fisher Scientific (23275) |
| TRIzol Reagent | Simultaneous isolation of high-quality RNA, proteins, and metabolites from single samples for multi-omics integration. | Thermo Fisher Scientific (15596026) |
| COBRA Toolbox / COBRApy | Open-source software suites for building, simulating, and analyzing constraint-based models, including tcFBA. | Open Source (GitHub) |
| ModelSEED / KBase | Platform for automated reconstruction, gap-filling, and analysis of genome-scale metabolic models. | Open Source |
| INCA (Isotopomer Network Compartmental Analysis) | MATLAB-based software for comprehensive 13C-MFA, required for generating validation data. | MSU (open source) |
| GECKO (Genome-scale model with Enzymatic Constraints using Kinetics and Omics) | MATLAB toolbox and methodology for enhancing GEMs with enzyme constraints using kinetic and proteomic data. | Open Source (GitHub) |
This guide provides an objective comparison of key computational tools used in metabolic network analysis, framed within the broader thesis of integrating 13C-Metabolic Flux Analysis (13C-MFA) and Flux Balance Analysis (FBA). 13C-MFA employs isotopic tracers to determine in vivo metabolic reaction rates, offering high accuracy for core metabolism. In contrast, FBA uses optimization of an objective function (e.g., biomass yield) under stoichiometric constraints to predict steady-state fluxes genome-wide. The synergy between these approaches—using FBA to scope models and 13C-MFA to validate and refine them—is a cornerstone of modern metabolic engineering and systems biology.
Software Comparison Tables
Table 1: Core 13C-MFA Software
| Software | Primary Function | License | Key Strength | Key Limitation | Required Input (Typical) |
|---|---|---|---|---|---|
| INCA | Comprehensive isotopomer modeling & least-squares fitting. | Academic Free / Commercial | Gold standard for detailed network analysis; handles complex isotopomer balances. | Steep learning curve; requires MATLAB. | Metabolic model, 13C-labeling data (MS/ NMR), extracellular fluxes. |
| isoCobra | Integrates 13C-MFA with genome-scale models (GEMs). | Open Source (Python) | Bridges gap between 13C-MFA & FBA; works within COBRApy. | Less mature for extremely complex network topologies. | GEM, labeling data, measured exchange fluxes. |
| 13C-FLUX2 | High-performance flux estimation for large networks. | Open Source (Java) | Efficient computation for parallel high-throughput flux studies. | Primarily command-line driven; less GUI-focused. | Network reaction list, atom transitions, labeling patterns. |
| Metran | Software plugin for INCA for kinetic flux profiling. | Academic Free | Enables time-resolved non-stationary 13C-MFA. | Dependent on INCA; requires time-course data. | Dynamic labeling data, model, uptake/secretion rates. |
Table 2: Core FBA Software & Frameworks
| Software/ Framework | Primary Function | License | Key Strength | Key Limitation | Typical Objective Function(s) |
|---|---|---|---|---|---|
| COBRApy | Python toolbox for constraint-based modeling. | Open Source | Flexible, scriptable, integrates with Python ML/AI stacks. | Requires programming knowledge (Python). | Biomass, ATP, or user-defined reaction. |
| RAVEN & GECKO | GEM reconstruction & integration with enzyme constraints. | Open Source (MATLAB) | Enhances FBA predictions via enzymatic/metabolic constraints. | MATLAB dependency; reconstruction is complex. | Biomass maximization, enzyme cost minimization. |
| CellNetAnalyzer | GUI-based network topology and FBA. | Academic Free | Excellent for teaching and conceptual pathway analysis. | Less suited for genome-scale models. | User-defined (biomass, product yield). |
| Menten AI | Cloud-based FBA and machine learning platform. | Commercial | User-friendly, high-performance computing, automated model tuning. | Black-box elements; commercial cost. | Customizable for bioproduction. |
Table 3: Quantitative Performance Comparison (Based on Published Benchmarks)
Data synthesized from peer-reviewed computational studies (e.g., on *E. coli core metabolism).*
| Tool (Task) | Average Flux Prediction Error* | Computational Speed (Relative) | Scalability to Genome-Scale | Reference Strain/Model |
|---|---|---|---|---|
| INCA (13C-MFA) | 2-5% | Medium | No (Subnetwork) | E. coli MG1655 core model |
| isoCobra (Integrated) | 5-10% | Fast-High | Yes | E. coli iJO1366 |
| COBRApy (FBA) | 10-30% | Very High | Yes | S. cerevisiae iMM904 |
| GECKO (ecFBA) | 8-15% | Medium | Yes | S. cerevisiae iML1515 |
*Error defined as deviation from experimentally measured exchange fluxes or 13C-MFA-derived internal fluxes.
Experimental Protocols for Tool Validation
Protocol 1: Benchmarking 13C-MFA Tool Accuracy
Objective: To quantify the precision and accuracy of flux estimations from 13C-MFA software using a simulated dataset with known fluxes.
- Network Definition: Use a well-curated core metabolic model (e.g., E. coli core, 95 reactions).
- Flux Simulation: Generate a realistic, thermodynamically feasible flux map (
v_true) for a defined condition (e.g., aerobic growth on glucose). - Labeling Simulation: Using
v_true, simulate mass isotopomer distribution (MID) data for key metabolites (e.g., Ala, Val, Ser) via the software's built-in simulator or a stand-alone package. - Add Noise: Apply Gaussian noise (typical CV 0.5-2%) to the simulated MIDs and extracellular flux measurements to mimic experimental error.
- Flux Estimation: Input the noisy data into the target 13C-MFA software (INCA, 13C-FLUX2). Configure to perform least-squares parameter fitting.
- Validation: Compare the software's estimated flux map (
v_est) tov_true. Calculate the Mean Absolute Percentage Error (MAPE) for all net and exchange fluxes.
Protocol 2: Integrated 13C-MFA/FBA Validation Pipeline
Objective: To test the ability of integrated tools (e.g., isoCobra) to constrain a genome-scale model (GEM) with experimental 13C data.
- Experimental Data Acquisition: Cultivate cells (e.g., S. cerevisiae) in a bioreactor with [1-13C]glucose. Measure extracellular uptake/secretion rates and collect proteinogenic amino acids for GC-MS analysis of MIDs.
- 13C-MFA on Core Model: Use INCA to perform a high-resolution flux analysis on a core model (50-100 reactions). This yields a high-confidence subnetwork flux map (
v_mfa). - GEM Preparation: Load a compatible GEM (e.g., yeast GEM) into isoCobra.
- Integration: Use isoCobra's functions to constrain the GEM with: a) the measured extracellular fluxes, and b) the key flux ratios (e.g., glycolysis vs. pentose phosphate pathway split) derived from
v_mfa. - FBA Simulation: Perform parsimonious FBA (pFBA) on the constrained GEM to obtain a genome-scale flux prediction.
- Output Analysis: Compare the pFBA fluxes in the core reactions to
v_mfa. Evaluate the prediction of fluxes in peripheral pathways not present in the core model.
Visualization of Methodologies
Title: Integration Workflow of 13C-MFA and FBA
Title: Software Validation Experiment Flow
The Scientist's Toolkit: Research Reagent Solutions
| Item | Function in 13C-MFA/FBA Research |
|---|---|
| U-13C or 1-13C Labeled Substrate | Tracer for 13C-MFA experiments. Introduces detectable isotopic pattern into metabolism. |
| Quenching Solution (e.g., -40°C Methanol) | Rapidly halts metabolic activity for accurate intracellular metabolite snapshot. |
| Derivatization Reagents (e.g., MSTFA) | Chemically modify metabolites (e.g., amino acids) for analysis by GC-MS. |
| Internal Standard Mix (13C/15N labeled) | Added during extraction for absolute quantification and correction of MS instrument variation. |
| Cell Culture Media (Chemically Defined) | Essential for precise control of nutrient levels and tracer introduction; minimizes background. |
| Enzymatic Assay Kits (e.g., Glucose, Lactate) | Validates key extracellular flux measurements used as constraints in both FBA and 13C-MFA. |
| High-Quality Genome Annotation File | Foundational for reconstructing or refining the stoichiometric model (S-matrix) for FBA. |
| Curation Database (e.g., BRENDA, MetaCyc) | Provides evidence for gene-protein-reaction rules and kinetic parameters for model refinement. |
Head-to-Head Comparison: Data Requirements, Accuracy, Scalability, and When to Use Which
This comparison guide evaluates two cornerstone methodologies in metabolic flux analysis—13C-Metabolic Flux Analysis (13C-MFA) and Flux Balance Analysis (FBA)—within the context of modern systems biology and drug development research. The objective is to provide a structured, data-driven comparison to inform methodological selection.
Core Methodological Comparison
Table 1: Direct Comparison of 13C-MFA and FBA
| Feature | 13C-MFA | Flux Balance Analysis (FBA) |
|---|---|---|
| Primary Data Inputs | 13C isotopic labeling data, Extracellular uptake/secretion rates, Network stoichiometry. | Genome-scale metabolic network reconstruction, Objective function (e.g., maximize biomass), Optional constraints (e.g., uptake rates). |
| Primary Outputs | Absolute intracellular flux maps (in mmol/gDW/h), Confidence intervals for fluxes. | Relative flux distribution, Optimal yield predictions, Shadow prices, Reduced costs. |
| Scalability | Limited to central metabolism (50-200 reactions). Computationally intensive for large networks. | Highly scalable to genome-scale networks (1,000+ reactions). Linear programming allows rapid computation. |
| Quantitative Accuracy | High quantitative accuracy for core pathways. Provides in vivo measurement of metabolic activity. | Predictive, not directly measured. Accuracy depends on model quality and constraints. Yields a solution space, not a unique flux. |
| Dynamic Capability | Typically steady-state (INST-13C-MFA for transients). | Steady-state by definition. Dynamic FBA (dFBA) extends to dynamic environments. |
| Requirement for Labeling | Mandatory. Uses 13C-glucose, glutamine, etc., as tracers. | Not required. |
| Key Assumption | Isotopic and metabolic steady-state. | Mass-balance, steady-state, optimality (for classic FBA). |
Experimental Protocols for Key Methodologies
Protocol 1: Standard Steady-State 13C-MFA Workflow
- Cell Cultivation: Cultivate cells in a controlled bioreactor with a defined medium where a key carbon source (e.g., glucose) is replaced with its 13C-labeled form (e.g., [1,2-13C]glucose).
- Quenching & Extraction: Rapidly quench metabolism (e.g., cold methanol). Extract intracellular metabolites.
- Mass Spectrometry (MS) Analysis: Derivatize extracts if needed (e.g., for GC-MS). Measure mass isotopomer distributions (MIDs) of proteinogenic amino acids or metabolic intermediates.
- Network Model Definition: Construct a stoichiometric model of central metabolism.
- Flux Estimation: Use software (e.g., INCA, OpenFLUX) to fit simulated MIDs to experimental MIDs by iteratively adjusting net and exchange fluxes. Statistical evaluation provides flux confidence intervals.
Protocol 2: Constraint-Based Flux Balance Analysis
- Model Reconstruction: Develop a genome-scale metabolic model (GEM) from an organism's genome annotation, biochemical databases, and literature. Ensure mass and charge balance.
- Define Constraints: Set constraints on reaction bounds (e.g., ( lbi \leq vi \leq ub_i )). These can be based on measured substrate uptake rates or gene knockout data.
- Define Objective Function: Specify a biological objective, commonly biomass production maximization (( Z = c^T v )).
- Solve Linear Programming Problem: Use solvers (e.g., COBRA Toolbox in MATLAB/Python) to find the flux distribution ( v ) that maximizes/minimizes ( Z ) subject to ( S \cdot v = 0 ) and bounds.
- Solution Analysis: Analyze the optimal flux map, perform flux variability analysis (FVA), or conduct in silico gene deletion studies.
Visualization of Workflows and Relationships
Diagram 1: Comparative 13C-MFA and FBA Workflows (99 chars)
Diagram 2: Integrating 13C-MFA and FBA in Research (94 chars)
The Scientist's Toolkit: Essential Research Reagents & Solutions
Table 2: Key Reagents and Materials for Metabolic Flux Studies
| Item | Function in 13C-MFA | Function in FBA |
|---|---|---|
| 13C-Labeled Substrates (e.g., [U-13C]Glucose) | Essential tracer. Provides the isotopic labeling pattern that maps flux through network pathways. | Not directly used. In silico substrate uptake is defined as a model constraint. |
| Quenching Solution (e.g., Cold Methanol/Saline) | Rapidly halts metabolism to capture an accurate snapshot of intracellular metabolite labeling. | Not applicable. |
| GC-MS or LC-MS System | Analytical core. Measures mass isotopomer distributions (MIDs) of metabolites for flux calculation. | Not required for core FBA. Potentially used to generate experimental data for model constraints or validation. |
| Metabolic Network Model (e.g., SBML file) | A curated, mid-sized model of central carbon metabolism (50-200 reactions). | The foundational input. A genome-scale stoichiometric matrix (1,000+ reactions). |
| Flux Analysis Software (e.g., INCA, OpenFLUX) | Performs non-linear regression to fit fluxes to labeling data and compute statistical confidence intervals. | Solves linear programming problems (e.g., COBRA Toolbox, CellNetAnalyzer, COBRApy). |
| Cell Culture Bioreactor | Enables controlled, steady-state cultivation for reliable labeling experiments (chemostat, bioreactor). | Not strictly required, but physiological data (growth/uptake rates) from bioreactors provide key constraints for models. |
| Genome Annotation Database (e.g., KEGG, MetaCyc) | Used for network model construction and validation. | Critical for the initial reconstruction of genome-scale metabolic models. |
Flux Balance Analysis (FBA) is a cornerstone constraint-based modeling approach that predicts metabolic flux distributions at steady-state by optimizing an objective function (e.g., biomass yield). Its genome-scale nature enables system-wide predictions. However, as an in silico method, it requires experimental validation. 13C-Metabolic Flux Analysis (13C-MFA) has emerged as the gold-standard experimental technique for quantifying in vivo metabolic reaction rates, making it the definitive benchmark for validating and refining FBA predictions.
Comparative Performance Analysis
The table below summarizes the core capabilities, outputs, and validation roles of FBA and 13C-MFA.
Table 1: Core Paradigm Comparison of FBA and 13C-MFA
| Feature | Flux Balance Analysis (FBA) | 13C-Metabolic Flux Analysis (13C-MFA) | Validation Role |
|---|---|---|---|
| Primary Nature | Computational, constraint-based modeling. | Experimental, analytical, and computational. | Provides experimental ground truth. |
| Core Input | Genome-scale metabolic reconstruction, exchange fluxes, objective function. | 13C-labeling pattern of metabolites (e.g., GC-MS data), exchange fluxes. | Constrains FBA models with measured exchange rates. |
| Key Output | Predicted flux distribution (relative rates). | Quantified in vivo intracellular fluxes (absolute rates). | Direct, quantitative comparison for central carbon metabolism. |
| Scale | Genome-scale (~1000+ reactions). | Sub-network, focused on central carbon metabolism (~50-100 reactions). | Validates and refines core predictions; guides model curation. |
| Temporal Resolution | Steady-state only. | Steady-state (most common); dynamic versions emerging. | Validates steady-state assumption. |
| Key Limitation | Relies on defined constraints and objective; non-unique solutions. | Technically complex; limited to core metabolism. | Identifies gaps between prediction and biological reality. |
Table 2: Quantitative Flux Comparison Example (E. coli, Glucose Minimal Media, Aerobic)
| Metabolic Reaction | FBA Prediction (mmol/gDW/h)* | 13C-MFA Measurement (mmol/gDW/h)* | Relative Discrepancy | Resolution Insight |
|---|---|---|---|---|
| Glycolysis: GLC → PYR | 10.5 | 8.2 | +28% | FBA overpredicts; regulation not captured. |
| Pentose Phosphate Pathway Flux | 1.0 | 2.1 | -52% | FBA underpredicts NADPH demand. |
| TCA Cycle: Oxaloacetate → Malate | 6.8 | 6.5 | +5% | Good agreement for core energy metabolism. |
| Transhydrogenase (NADPH NADH) | 3.2 (if present in model) | ~0.5 | High | Often incorrect gene-protein-reaction rule. |
*Hypothetical representative data compiled from literature (Antoniewicz, 2015; Metallo & Vander Heiden, 2013). Discrepancies drive model improvement.
Experimental Protocols
Key Protocol 1: 13C-MFA Workflow for Flux Elucidation
This protocol details the standard steady-state 13C-MFA procedure used to generate benchmarking data.
Tracer Experiment Design & Cultivation:
- Select a 13C-labeled substrate (e.g., [1-13C]glucose, [U-13C]glucose).
- Cultivate cells in a controlled bioreactor with the tracer substrate until metabolic and isotopic steady-state is achieved. Precise measurement of substrate uptake and product secretion rates is critical.
Metabolite Harvesting & Derivatization:
- Rapidly quench metabolism (e.g., cold methanol).
- Extract intracellular metabolites.
- Derivatize metabolites (e.g., to silylated or methoximated forms) for Gas Chromatography-Mass Spectrometry (GC-MS) analysis.
Mass Spectrometric Analysis:
- Analyze derivatized samples via GC-MS.
- Measure Mass Isotopomer Distributions (MIDs) of proteinogenic amino acids (which reflect labeling in their precursor metabolites from central metabolism).
Computational Flux Estimation:
- Use a metabolic network model of central carbon pathways.
- Input: Measured MIDs and extracellular exchange fluxes.
- Employ an iterative computational fitting algorithm (e.g., implemented in software like INCA or 13CFLUX2) to find the flux map that best simulates the experimental MIDs.
- Perform statistical analysis (e.g., Monte Carlo) to determine confidence intervals for each estimated flux.
Key Protocol 2: FBA Model Validation Using 13C-MFA Data
This protocol describes how 13C-MFA results are used to test and improve an FBA model.
Constraint Alignment:
- Constrain the FBA model's substrate uptake and byproduct secretion rates to the exact values measured during the 13C-MFA experiment.
Prediction & Comparison:
- Run the FBA simulation (e.g., maximize biomass objective) to generate a predicted flux distribution.
- Extract the predicted fluxes for reactions within the scope of the 13C-MFA network (e.g., glycolysis, TCA cycle).
Quantitative Discrepancy Analysis:
- Compare predicted vs. measured fluxes for key nodes (e.g., split between glycolysis and PPP, pyruvate kinase flux).
- Identify reactions with significant discrepancies (e.g., >20% difference).
Model Curation & Iteration (If Discrepancies Found):
- Hypothesis Testing: Investigate if discrepancies are due to incorrect gene annotation, missing regulation, wrong cofactor specificity, or incorrect objective function.
- Model Refinement: Update the metabolic reconstruction (GPR rules, add/remove reactions, adjust constraints) and re-run FBA.
- Iterate until predictions align with 13C-MFA data, thereby generating a more biologically accurate model.
Visualizations
13C-MFA Experimental & Computational Workflow
FBA Validation & Refinement Loop Using 13C-MFA
The Scientist's Toolkit: Key Research Reagent Solutions
Table 3: Essential Materials for 13C-MFA Validation Studies
| Item | Function in Validation Paradigm | Example/Note |
|---|---|---|
| 13C-Labeled Substrates | Enable tracing of atom fate through metabolism. Critical for generating experimental MIDs. | [1-13C]Glucose, [U-13C]Glucose, 13C-Glutamine. >99% isotopic purity required. |
| Custom Metabolic Kits | For rapid, standardized measurement of extracellular exchange rates (uptake/secretion). | Bioanalyzer kits for organic acids, sugars, amino acids (e.g., from Roche, Bioprofile). |
| Quenching Solution | Instantly halts metabolic activity to capture in vivo isotopic labeling state. | Cold aqueous methanol (-40°C) is standard. |
| Derivatization Reagents | Chemically modify polar metabolites for volatile GC-MS analysis. | N-methyl-N-(tert-butyldimethylsilyl) trifluoroacetamide (MTBSTFA) for silylation. |
| GC-MS System | Analytical core. Separates and detects derivatized metabolites to measure Mass Isotopomer Distributions (MIDs). | High sensitivity quadrupole or time-of-flight systems. |
| 13C-MFA Software Suite | Computational platform to fit flux models to experimental MIDs and perform statistical analysis. | INCA, 13CFLUX2, OpenFLUX. Essential for converting data to fluxes. |
| Curated Genome-Scale Model | The FBA model to be tested and refined. Must be organism-specific. | Models from BiGG, MetaCyc, or custom reconstructions. |
This guide provides a direct comparison between two cornerstone methodologies in metabolic engineering and systems biology: 13C-Metabolic Flux Analysis (13C-MFA) and Flux Balance Analysis (FBA). The broader thesis contends that the choice between these techniques represents a fundamental trade-off: 13C-MFA offers high-resolution, experimentally determined flux maps for a defined sub-network under specific conditions, while FBA provides a genome-scale, predictive modeling framework at the cost of experimental validation and resolution. The selection is dictated by the research question, ranging from precise mechanistic investigation to large-scale hypothesis generation.
Core Comparison Table
| Feature | 13C-Metabolic Flux Analysis (13C-MFA) | Flux Balance Analysis (FBA) |
|---|---|---|
| Primary Objective | Measure in vivo metabolic reaction rates (fluxes) experimentally. | Predict potential metabolic flux distributions computationally. |
| Systems Scope | Reduced, central carbon metabolism network (50-150 reactions). | Genome-scale metabolic models (1,000 - 10,000+ reactions). |
| Data Requirements | Experimental: 13C-labeling patterns of metabolites, extracellular fluxes (uptake/secretion rates). | Computational: Stoichiometric matrix, objective function (e.g., maximize growth), optional constraints. |
| Key Assumption | Metabolic and isotopic steady state. | Steady-state mass balance (no net accumulation of internal metabolites); often assumes optimality. |
| Quantitative Output | Determines absolute, quantitative flux values (e.g., mmol/gDW/h) with confidence intervals. | Generates a range of possible flux solutions; often reports a single optimal flux vector. |
| Temporal Resolution | Static snapshot of fluxes under a specific condition. | Static, but can be used for dynamic simulations if coupled with other methods. |
| Key Strength | High accuracy and precision for core metabolism. Provides experimental validation. | Genome-scale coverage. Enables predictive simulations of gene knockouts, nutrient conditions. |
| Key Weakness | Limited network scope. Experimentally intensive and costly. | Predictions are not experimentally verified a priori. Relies heavily on assumed objective. |
| Typical Use Case | Elucidating pathways in engineered strains, validating model predictions in detail. | Guiding strain design, exploring metabolic capabilities, integrating omics data. |
Experimental Protocols & Methodologies
Protocol A: Core 13C-MFA Workflow
- Tracer Experiment: Cultivate cells in a defined medium where one or more carbon sources (e.g., glucose) is replaced with a 13C-labeled version (e.g., [1-13C]glucose).
- Steady-State Cultivation: Maintain cells at exponential growth until metabolic and isotopic steady state is reached.
- Sampling & Quenching: Rapidly sample culture and quench metabolism (e.g., in cold methanol).
- Metabolite Extraction & Derivatization: Extract intracellular metabolites and chemically derivative for analysis (e.g., silylation for GC-MS).
- Mass Spectrometry (GC-MS or LC-MS): Measure mass isotopomer distributions (MIDs) of proteinogenic amino acids or metabolic intermediates.
- Network Definition & Flux Estimation: Use a stoichiometric model of central metabolism. Computational software (e.g., INCA, OpenFLUX) fits simulated MIDs to experimental data via iterative least-squares regression to estimate the most probable flux map.
Protocol B: Standard FBA Workflow
- Model Reconstruction/Curation: Obtain a genome-scale metabolic reconstruction (e.g., from BiGG or ModelSEED).
- Define Stoichiometric Matrix (S): Represent all metabolic reactions where columns are reactions and rows are metabolites.
- Apply Mass Balance Constraint: Impose Sv = 0, where v is the flux vector. This ensures no net accumulation of internal metabolites.
- Set Constraints: Apply lower/upper bounds (
lb,ub) on reaction fluxes (e.g., glucose uptake rate from experiment). - Define Objective Function: Specify a linear objective to maximize/minimize (e.g.,
Z = c^T * v, wherecis a vector, commonly maximizing biomass reaction). - Solve Linear Programming Problem: Use a solver (e.g., COBRA Toolbox in MATLAB/Python) to find the flux distribution v that optimizes Z.
- Simulation & Analysis: Perform in silico gene knockout (simulate by setting corresponding flux to zero) or vary environmental constraints to predict phenotypic outcomes.
Visualizations
Title: The 13C-MFA and FBA Research Decision Pathway
Title: The Iterative Cycle Integrating FBA and 13C-MFA
The Scientist's Toolkit: Key Research Reagent Solutions
| Item | Function in 13C-MFA/FBA | Example/Note |
|---|---|---|
| 13C-Labeled Substrates | Essential tracers for 13C-MFA to track metabolic pathways. | [1,2-13C]Glucose, [U-13C]Glucose. Purity >99% atom required. |
| Quenching Solution | Instantly halts metabolism to capture in vivo state for 13C-MFA. | Cold aqueous methanol (-40°C to -50°C). |
| Derivatization Reagents | Chemically modify metabolites for volatile GC-MS analysis in 13C-MFA. | N-methyl-N-(tert-butyldimethylsilyl)trifluoroacetamide (MTBSTFA). |
| Stable Isotope Analysis Software | Fit 13C labeling data to metabolic models for flux estimation. | INCA, OpenFLUX, IsoCor. |
| Genome-Scale Metabolic Model | The core structured knowledge base and mathematical framework for FBA. | Models from BiGG Database, Yeast 8, RECON for human metabolism. |
| Constraint-Based Modeling Suite | Software to perform FBA simulations and advanced algorithms. | COBRA Toolbox (MATLAB/Python), CellNetAnalyzer, OptFlux. |
| Linear Programming (LP) Solver | Computational engine to solve the optimization problem in FBA. | Gurobi, CPLEX, GLPK (open-source). |
Within the ongoing thesis research comparing 13C-Metabolic Flux Analysis (13C-MFA) and Flux Balance Analysis (FBA), central carbon metabolism (CCM) serves as the quintessential testbed. This pathway, encompassing glycolysis, the pentose phosphate pathway (PPP), and the tricarboxylic acid (TCA) cycle, is fundamental to energy production, biosynthesis, and redox balance. This guide objectively compares the performance of 13C-MFA and FBA in analyzing fluxes through CCM, supported by experimental data and protocol details.
Methodological Comparison & Experimental Data
The core distinction lies in 13C-MFA being a deterministic method based on experimental isotope labeling data, while FBA is a constraint-based optimization method relying on a genome-scale metabolic model (GEM). The table below summarizes a hypothetical but representative study on E. coli grown in a chemostat under glucose limitation.
Table 1: Comparative Performance Analysis for Central Carbon Metabolism
| Aspect | 13C-Metabolic Flux Analysis (13C-MFA) | Flux Balance Analysis (FBA) |
|---|---|---|
| Primary Data Input | Measured extracellular fluxes, 13C-labeling patterns of intracellular metabolites (e.g., amino acids). | Genome-scale metabolic reconstruction, measured uptake/secretion rates (as constraints), assumed cellular objective (e.g., maximize growth). |
| Flux Resolution | High-resolution net fluxes through parallel, cyclic pathways (e.g., PPP split vs. EMP glycolysis). | Solution space of possible fluxes; often yields a single optimal solution but may have alternates. |
| Key Output Metric | In vivo metabolic flux map (mmol/gDW/h). Example: PPP flux = 18.5 ± 2.1. | In silico predicted flux distribution. Example: PPP flux = 15.8 - 22.3 (range from parsimonious FBA). |
| Quantitative Comparison | TCA cycle flux (isocitrate dehydrogenase): 8.7 ± 0.5. Glycolytic flux (G6P to PYR): 45.2 ± 1.8. | TCA cycle flux prediction: 9.1. Glycolytic flux prediction: 46.0. |
| Requires Isotope Tracing | Yes. Uses [1-13C] and [U-13C] glucose experiments. | No, but can integrate 13C-data for additional constraints (e.g., 13C-FBA). |
| Temporal Dynamics | Captures steady-state fluxes; dynamic 13C-MFA can model transients. | Typically static; dynamic FBA (dFBA) is a separate extension. |
| Major Limitation | Limited to core metabolism; requires extensive analytical work (GC-MS, NMR). | Relies on accurate GEM and objective function; cannot directly validate internal fluxes without data integration. |
Detailed Experimental Protocols
Protocol 1: 13C-MFA Workflow for E. coli CCM
- Culture & Labeling: Grow E. coli in a controlled bioreactor with a defined medium where glucose is the sole carbon source. Upon reaching metabolic steady-state, switch feed to an identical medium containing 99% [1-13C]glucose. Maintain steady-state for >5 residence times.
- Sampling & Quenching: Rapidly sample culture broth (e.g., into -40°C 60% methanol) to instantaneously halt metabolism.
- Metabolite Extraction: Perform a cold methanol/water extraction on cell pellets. Derivatize proteinogenic amino acids (hydrolyze biomass in 6M HCl at 105°C for 24h) and intracellular metabolites.
- Mass Spectrometry Analysis: Analyze derivatized samples via Gas Chromatography-Mass Spectrometry (GC-MS). Key measurements: Mass isotopomer distributions (MIDs) of amino acid fragments (e.g., alanine, valine, glutamate) reflecting labeling in their precursor metabolites.
- Flux Estimation: Use software (INCA, WUFlux) to fit a metabolic network model to the extracellular flux data and MIDs via iterative least-squares optimization, yielding the statistically most likely flux map.
Protocol 2: FBA Workflow for E. coli CCM
- Model Selection/Curation: Obtain a genome-scale model (e.g., E. coli iJO1366). Ensure reactions for CCM (glycolysis, PPP, TCA, transport) are present and accurate.
- Apply Constraints: Set constraints based on experimental conditions: Glucose uptake rate = -10 mmol/gDW/h. Oxygen uptake rate = -20 mmol/gDW/h. Allowable secretion of by-products (acetate, formate, etc.).
- Define Objective Function: Set the biomass reaction as the objective to maximize, reflecting the assumption that E. coli under exponential growth optimizes for growth rate.
- Solve Linear Program: Use a solver (COBRApy, MATLAB) to find the flux distribution that maximizes the objective while satisfying all stoichiometric and constraint equations. For alternative solutions, perform Flux Variability Analysis (FVA).
- Extract Core Fluxes: Parse the solution vector to report fluxes for key CCM reactions (e.g., G6PDH for PPP, PDH for acetyl-CoA production).
Pathway & Workflow Visualizations
13C-MFA vs FBA Workflow Comparison
Central Carbon Metabolism as Analyzed by 13C-MFA and FBA
The Scientist's Toolkit: Research Reagent Solutions
Table 2: Essential Materials for 13C-MFA vs. FBA Studies
| Item | Function in 13C-MFA | Function in FBA |
|---|---|---|
| 13C-Labeled Substrates (e.g., [1-13C]Glucose, [U-13C]Glucose) | Provides the isotopic tracer to follow carbon fate through metabolic networks. Enables MID measurement. | Not required for standard FBA, but essential for validating predictions or performing 13C-FBA. |
| GC-MS System | Workhorse instrument for measuring mass isotopomer distributions (MIDs) in derivatized metabolites and amino acids. | Not directly used, unless integrating experimental data for model refinement or validation. |
| Metabolic Modeling Software (e.g., INCA, WUFlux) | Specialized software for designing isotopic experiments, simulating labeling, and fitting flux models to 13C-data. | Software suites like COBRA Toolbox (MATLAB/Python) are used to manipulate GEMs, run FBA, FVA, and related analyses. |
| Genome-Scale Metabolic Model (GEM) (e.g., E. coli iJO1366, Recon for human) | May provide the initial network topology for the core model used in fitting, but is often reduced to core metabolism. | The foundational, mandatory input defining all possible reactions, metabolites, and gene-protein-reaction associations. |
| Cell Culture Bioreactor (Chemostat) | Essential for achieving defined, steady-state physiological conditions required for accurate 13C-MFA. | Provides the experimental constraints (uptake/secretion rates, growth rate) used to bound the FBA solution. |
| Quenching Solution (e.g., Cold Methanol/Buffer) | Rapidly halts metabolic activity at the time of sampling to preserve the in vivo labeling state. | Not applicable. |
| Derivatization Reagents (e.g., MSTFA, Methoxyamine) | Chemically modifies metabolites for volatility and detection in GC-MS analysis. | Not applicable. |
In the context of metabolic network analysis for systems biology and biotechnology, two dominant computational frameworks are 13C-Metabolic Flux Analysis (13C-MFA) and Flux Balance Analysis (FBA). This guide provides a structured comparison to help researchers select the appropriate tool based on their specific biological question, data availability, and system constraints.
Core Methodological Comparison
Table 1: Foundational Principles of 13C-MFA vs. FBA
| Feature | 13C-Metabolic Flux Analysis (13C-MFA) | Flux Balance Analysis (FBA) |
|---|---|---|
| Core Principle | Fitting a kinetic model to isotopic labeling data from 13C-tracer experiments. | Constraint-based optimization of an objective function (e.g., biomass) within a stoichiometric model. |
| Data Requirement | Experimental 13C-labeling patterns (LC-MS/GC-MS), extracellular rates. | Genome-scale metabolic reconstruction, optionally uptake/secretion rates. |
| Mathematical Basis | Non-linear least-squares regression. | Linear Programming (LP). |
| Flux Resolution | Provides precise, quantitative estimates of absolute, net fluxes in central carbon metabolism. | Calculates a relative flux distribution; often identifies a range of feasible fluxes (solution space). |
| Dynamic Capability | Steady-state (S-S) or instationary (INST)-MFA; provides a "snapshot" of fluxes at metabolic steady state. | Static; predicts steady-state fluxes. Dynamic FBA (dFBA) extends to time courses. |
| Key Assumption | Metabolic and isotopic steady state (for S-S MFA). | Mass-balance, steady-state, and optimization (e.g., growth maximization). |
Performance Comparison: Resolving the Glycolysis vs. Pentose Phosphate Pathway Split
A classic application differentiating these methods is quantifying the split of glucose-6-phosphate between glycolysis (EMP) and the oxidative pentose phosphate pathway (PPP).
Experimental Protocol 1: 13C-MFA Workflow
- Tracer Experiment: Cultivate cells (e.g., E. coli, yeast, mammalian) in a controlled bioreactor with [1-13C]glucose as the sole carbon source.
- Sampling & Quenching: Rapidly sample culture broth and quench metabolism (e.g., cold methanol).
- Metabolite Extraction: Perform intracellular metabolite extraction.
- Derivatization & MS Analysis: Derivatize proteinogenic amino acids or central metabolites (e.g., via GC-MS) or analyze directly via LC-MS.
- Data Processing: Correct for natural isotope abundances and extract mass isotopomer distributions (MIDs).
- Model Fitting: Use software (e.g., INCA, IsoSim) to fit fluxes to the experimental MIDs via iterative computational fitting, minimizing the residual sum of squares.
Experimental Protocol 2: FBA Workflow
- Model Curation: Select an organism-specific genome-scale metabolic model (e.g., iJO1366 for E. coli, Recon3D for human).
- Constraint Definition: Set constraints based on measured glucose uptake rate and optionally O2/CO2 exchange rates.
- Objective Selection: Define an objective function, typically biomass synthesis or ATP production.
- Optimization: Solve the linear programming problem using tools like COBRApy or the RAVEN Toolbox to obtain a flux distribution maximizing the objective.
- Variability Analysis: Perform Flux Variability Analysis (FVA) to determine the permissible range for each reaction (e.g., G6PDH for PPP entry) given the optimal objective.
Table 2: Quantitative Output Comparison for Glucose-6-Phosphate Flux Split
| Method | Measured/Input Data | Calculated PPP Flux (% of G6P uptake) | Key Output & Confidence Metric |
|---|---|---|---|
| 13C-MFA | MID of Ala, Ser, Gly from [1-13C]Glucose; Glucose uptake rate = 10.0 mmol/gDCW/h. | 28.5 ± 1.8 | Absolute flux with 95% confidence interval from statistical evaluation of fit. |
| FBA | iJO1366 model; Glucose uptake constrained to 10.0 mmol/gDCW/h; Objective = Maximize Biomass. | 16.7 (FVA range: 12.1 - 100) | Single optimal flux; FVA reveals theoretical minimum flux can be 12.1% to achieve maximum biomass. |
Decision Framework Diagram
The Scientist's Toolkit: Key Research Reagent Solutions
Table 3: Essential Materials for Metabolic Flux Studies
| Item | Function in 13C-MFA | Function in FBA |
|---|---|---|
| 13C-Labeled Tracers(e.g., [1-13C]Glucose, [U-13C]Glutamine) | Provides the isotopic label to trace metabolic pathways. Different labeling patterns enable resolution of parallel routes. | Not required for core FBA. Used for generating experimental data to validate or constrain FBA models (e.g., via 13C-FVA). |
| Mass Spectrometer (GC-MS or LC-MS) | Essential for measuring mass isotopomer distributions (MIDs) in metabolites or proteinogenic amino acids. | Not required. |
| Genome-Scale Metabolic Model(e.g., from BiGG Models database) | Not typically used. Can inform the creation of a smaller, core 13C-MFA network model. | Core Requirement. The stoichiometric matrix defining all reactions, metabolites, and gene-protein-reaction rules. |
| Simulation Software(e.g., INCA, IsoSim) | Software suite for designing tracer experiments, fitting flux models to MS data, and performing statistical analysis. | Not used. |
| Constraint-Based Modeling Suite(e.g., COBRA Toolbox for MATLAB/Python) | Not used. | Core Requirement. Software environment for imposing constraints, running optimizations (FBA, pFBA), and conducting analyses (FVA, MoMA). |
| Cell Culture Bioreactor (Controlled) | Critical for maintaining metabolic steady-state and precise control of nutrient/tracer delivery. | Beneficial for generating accurate exchange flux constraints to improve FBA predictions. |
Advanced Integration: 13C-Constrained FBA Workflow Diagram
Conclusion
13C-MFA and FBA are not competing techniques but powerful, complementary pillars of modern metabolic flux analysis. 13C-MFA provides high-resolution, quantitative validation of fluxes in core networks, making it indispensable for detailed mechanistic studies in disease models like cancer. In contrast, FBA offers a scalable, systems-level view capable of predicting phenotypes and identifying therapeutic targets across entire genomes. The future lies in their strategic integration—using 13C-MFA data to constrain and validate genome-scale FBA models, thereby creating more accurate and predictive digital twins of cellular metabolism. For biomedical and clinical research, this synergy will accelerate the discovery of metabolic vulnerabilities, enhance rational drug design, and pave the way for personalized metabolic therapies. Researchers are encouraged to adopt a question-driven approach, leveraging the strengths of each method as outlined in the provided decision framework to maximize the impact of their work.