Life Cycle Assessment (LCA) of Biofuel Production Pathways: A Comprehensive Review for Sustainability & Policy Development
This article provides a detailed examination of Life Cycle Assessment (LCA) methodologies applied to diverse biofuel production pathways, including first, second, and third-generation biofuels.
Life Cycle Assessment (LCA) of Biofuel Production Pathways: A Comprehensive Review for Sustainability & Policy Development
Abstract
This article provides a detailed examination of Life Cycle Assessment (LCA) methodologies applied to diverse biofuel production pathways, including first, second, and third-generation biofuels. It explores foundational principles of LCA frameworks, delves into specific methodological approaches for assessing environmental impacts from feedstock cultivation to end-use, addresses common challenges and optimization strategies in biofuel LCAs, and presents a comparative validation of current findings across different feedstocks and conversion technologies. Tailored for researchers, scientists, and policy professionals, this review synthesizes the latest data to inform sustainable biofuel development and evidence-based decision-making in the energy sector.
Understanding Biofuel LCA: Frameworks, Scope, and Environmental Impact Categories
Within the framework of a thesis on the life cycle assessment of different biofuel production pathways, a rigorous, standardized methodological approach is paramount. The International Organization for Standardization (ISO) provides this framework through the ISO 14040 and 14044 standards, which define the principles, structure, and requirements for conducting an LCA. For biofuels, these standards ensure comparability between studies assessing diverse feedstocks (e.g., corn, sugarcane, microalgae, waste oils) and conversion technologies (e.g., transesterification, hydroprocessing, fermentation).
Core LCA Principles and Phases for Biofuel Research LCA is structured into four interlinked phases, as defined by ISO standards.
The Scientist's Toolkit: Essential Research Reagent Solutions for LCA Modeling Conducting a comparative LCA for biofuels relies on specific data and software tools.
| Research Tool / Reagent | Function in Biofuel LCA Research |
|---|---|
| Ecoinvent Database | Comprehensive background life cycle inventory database providing data for upstream processes (e.g., fertilizer production, electricity mixes). |
| GREET Model (Argonne National Lab) | Specialized software and database for transportation fuel LCA, with detailed modules for conventional and alternative fuels. |
| SimaPro / openLCA Software | LCA modeling software used to build product systems, calculate inventories, and perform impact assessments. |
| IPCC GWP 100a Characterization Factors | Standardized factors for converting greenhouse gas emissions (CO2, CH4, N2O) into CO2-equivalents for global warming potential impact. |
| CML or ReCiPe Impact Methodologies | Pre-defined sets of impact category methods (e.g., eutrophication, acidification) for the Life Cycle Impact Assessment (LCIA) phase. |
Publish Comparison Guide: Biodiesel from Soybean vs. Microalgae This guide objectively compares the environmental performance of two biodiesel pathways based on published LCA studies.
Experimental Protocols for Cited Studies:
- System Boundaries & Functional Unit: Cradle-to-gate (well-to-tank) or cradle-to-grave (well-to-wheel). Functional unit is 1 MJ of energy content in the fuel.
- Life Cycle Inventory (LCI): Data collection for soybean pathway includes agricultural inputs (land use change, fertilizers, pesticides), soybean processing, oil extraction, and transesterification. For algae, data includes nutrient (N, P, CO2) inputs, photobioreactor or pond operation, biomass harvesting, oil extraction, and transesterification.
- Life Cycle Impact Assessment (LCIA): Application of the ReCiPe 2016 Midpoint (H) method to calculate impacts for Global Warming Potential (GWP), Freshwater Eutrophication, and Water Consumption.
Quantitative Performance Comparison:
| Impact Category (per 1 MJ Fuel) | Soybean Biodiesel | Microalgae Biodiesel (PBR) | Notes & Key Drivers |
|---|---|---|---|
| Global Warming Potential (g CO2-eq) | 45 - 85 | 60 - 120 (Can be negative with waste CO2) | Soybean: Highly sensitive to land use change emissions. Algae: Dominated by energy for reactor operation and mixing; potential for carbon sequestration if flue gas is used. |
| Freshwater Eutrophication (g P-eq) | 0.003 - 0.008 | 0.010 - 0.030 | Soybean: Driven by fertilizer runoff from cultivation. Algae: Primarily from fertilizer production for nutrient feed. |
| Water Consumption (liters) | 2.5 - 6.0 | 10 - 50 (or higher for raceway ponds) | Soybean: Mainly irrigation water. Algae: High evaporation losses in open ponds; photobioreactors are more conservative but capital-intensive. |
The comparative analysis underscores that no single biofuel pathway outperforms another across all environmental impact categories. The relative performance is critically dependent on specific process parameters (e.g., energy source for algae reactors, inclusion of land use change for soy), which must be transparently documented according to ISO standards to enable meaningful comparison within a comprehensive research thesis.
Within the broader thesis on the life cycle assessment (LCA) of different biofuel production pathways, this guide objectively compares the performance of major biofuel generations. The evaluation focuses on key performance metrics—including feedstock availability, conversion efficiency, GHG reduction potential, and technology readiness level (TRL)—supported by recent experimental data, to inform researchers and industry professionals.
Performance Comparison of Biofuel Pathways
The following table synthesizes quantitative data from recent LCA studies and techno-economic analyses, providing a comparative overview of the major pathways.
Table 1: Comparative Performance Metrics of Biofuel Pathways
| Pathway | Typical Feedstock | Average Fuel Yield (GJ/ha/yr) | Avg. GHG Reduction vs. Gasoline* | Estimated MESP (USD/GGE) | Technology Readiness Level (TRL) | Key Challenges |
|---|---|---|---|---|---|---|
| First-Gen (Conventional) | Corn, Sugarcane, Vegetable Oils | 50 - 100 | 20% - 60% | 2.50 - 4.00 | 9 (Commercial) | Food vs. fuel, land use change |
| Lignocellulosic (2nd Gen) | Agricultural Residues, Energy Crops | 80 - 130 | 70% - 95% | 3.50 - 6.50 | 7-8 (Demo/Early Comm.) | Recalcitrance, pretreatment cost |
| Algal (3rd Gen) | Microalgae (various strains) | 120 - 300 (theoretical) | 50% - 90%* | 8.00 - 15.00+ | 5-6 (Pilot Scale) | Cultivation cost, harvesting energy |
| Waste-to-Fuel (Advanced) | MSW, Waste Fats/Oils, Industrial Waste | Varies Widely | 80% - 100%+ | 3.00 - 7.00 | 6-8 (Varies by tech) | Feedstock consistency, contaminants |
*Range depends on system boundaries, allocation methods, and assumed land use change. Minimum Fuel Selling Price in USD per Gasoline Gallon Equivalent. *Highly sensitive to cultivation system design and energy inputs.
Experimental Data & Methodologies
Supporting data for Table 1 are derived from standardized experimental and LCA protocols. Below are key methodologies.
Life Cycle Assessment (ISO 14040/44) Protocol
Objective: To quantify and compare the environmental impacts, particularly greenhouse gas (GHG) emissions, of different biofuel pathways from feedstock production to end-use (Well-to-Wheels). Methodology:
- Goal & Scope Definition: Define functional unit (e.g., 1 MJ of fuel), system boundaries (cradle-to-grave), and allocation procedures (e.g., energy, economic, displacement).
- Life Cycle Inventory (LCI): Collect data on all material/energy inputs and emissions for each unit process (e.g., fertilizer input for cultivation, electricity for biorefinery).
- Life Cycle Impact Assessment (LCIA): Calculate potential environmental impacts using characterization factors (e.g., IPCC GWP100 for climate change).
- Interpretation: Analyze results, conduct sensitivity analysis on key parameters (e.g., co-product allocation, land use change emissions).
Biomass Saccharification & Fermentation Yield Analysis (for Lignocellulosic)
Objective: To determine the sugar release efficiency and subsequent biofuel yield from pretreated lignocellulosic biomass. Methodology:
- Pretreatment: Subject biomass (e.g., switchgrass, corn stover) to dilute acid, steam explosion, or alkaline pretreatment.
- Enzymatic Hydrolysis: Treat pretreated solids with a commercial cellulase/hemicellulase cocktail (e.g., CTec3) at 50°C, pH 4.8-5.0, for 72-120 hours.
- Sugar Quantification: Analyze hydrolysate via HPLC (Aminex HPX-87P column) to quantify glucose, xylose, and inhibitor (furfural, HMF) concentrations.
- Fermentation: Inoculate hydrolysate with engineered S. cerevisiae or Z. mobilis capable of fermenting C5 and C6 sugars. Measure ethanol/titer via GC or HPLC.
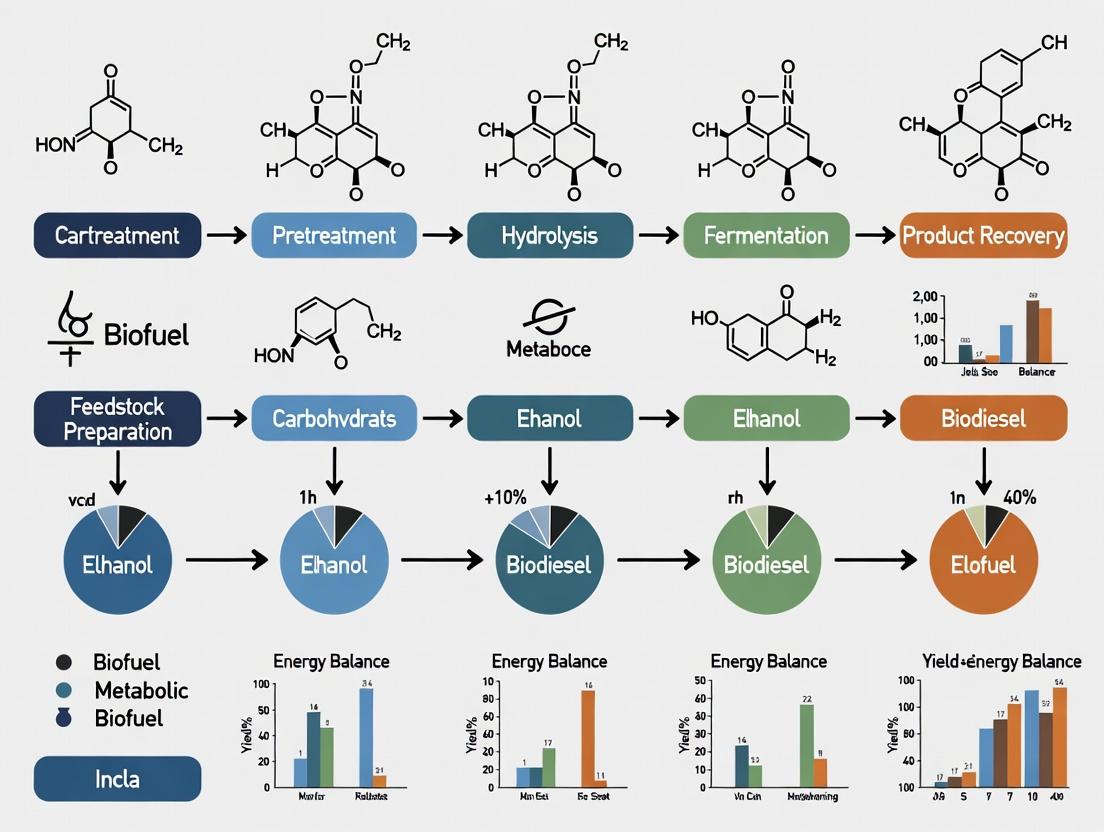
Pathway Diagrams
Title: First-Generation Biofuel Production Pathway
Title: Advanced Biofuel Production Pathways Overview
The Scientist's Toolkit: Key Research Reagent Solutions
Table 2: Essential Reagents and Materials for Biofuel Pathway Research
| Item | Function/Application | Example/Supplier (Illustrative) |
|---|---|---|
| Commercial Cellulase Cocktails | Enzymatic hydrolysis of cellulose to glucose for yield analysis. | CTec3, HTec3 (Novozymes) |
| Engineered Microbial Strains | Ferment mixed sugars (C5/C6) or synthesize advanced biofuels. | S. cerevisiae (C5 capable), Y. lipolytica (lipid producer). |
| Anaerobic Digestion Inoculum | Starter culture for biomethane potential assays from waste. | Digested sludge from wastewater treatment plants. |
| Soxhlet Extraction Apparatus | Standard method for total lipid extraction from algal biomass. | Using solvents like chloroform-methanol (Bligh & Dyer). |
| HPLC Columns & Standards | Quantify sugars, organic acids, and fermentation inhibitors. | Aminex HPX-87H or HPX-87P column (Bio-Rad). |
| GC-MS/FID Systems | Analyze fuel composition, volatile fatty acids, and biogas quality. | Capillary columns (e.g., DB-5ms for hydrocarbons). |
| Microalgae Growth Media | Standardized cultivation for controlled productivity experiments. | BG-11, f/2, or Bold's Basal Medium. |
| LCA Software & Databases | Model and calculate environmental impacts of production pathways. | SimaPro, GaBi, using Ecoinvent or GREET databases. |
Life Cycle Assessment (LCA) is a fundamental tool for quantifying the environmental performance of biofuel production pathways. This comparison guide objectively evaluates four key impact categories—Global Warming Potential (GWP), Land Use, Water Consumption, and Eutrophication—across prominent biofuel alternatives, providing a synthesis of current experimental data within ongoing thesis research.
Comparative Environmental Impact Data
The following tables consolidate quantitative findings from recent LCA studies on major biofuel pathways, including corn ethanol (1G), sugarcane ethanol, soybean biodiesel, and advanced pathways like algal biodiesel and cellulosic ethanol from switchgrass.
Table 1: Global Warming Potential (GWP in kg CO₂-eq per MJ fuel)
| Biofuel Pathway | GWP (Range) | Key Contributing Factors |
|---|---|---|
| Corn Ethanol | 60 - 95 | Fossil inputs in farming, fermentation energy, land use change (LUC) |
| Sugarcane Ethanol | 25 - 40 | Bagasse cogeneration, high yield, but potential LUC |
| Soybean Biodiesel | 50 - 85 | Fertilizer use, processing energy, direct LUC |
| Algal Biodiesel | 30 - 120 | High energy for cultivation, dewatering, and extraction |
| Cellulosic Ethanol | 10 - 35 | Low-input feedstock, process energy source, negligible LUC |
Table 2: Land Use (m²·year per MJ fuel)
| Biofuel Pathway | Land Use (Range) | Notes |
|---|---|---|
| Corn Ethanol | 0.8 - 1.5 | High fertilizer demand, annual crop |
| Sugarcane Ethanol | 0.2 - 0.5 | High perennial yield, but potential for soil degradation |
| Soybean Biodiesel | 2.5 - 4.0 | Low oil yield per hectare |
| Algal Biodiesel | 0.1 - 0.5 | Very high theoretical yield, but pilot-scale data varies |
| Cellulosic Ethanol | 0.3 - 0.7 | Perennial grass on marginal land possible |
Table 3: Water Consumption (Liters per MJ fuel)
| Biofuel Pathway | Water Consumption (Range) | Blue vs. Green Water Split |
|---|---|---|
| Corn Ethanol | 50 - 250 | Primarily irrigation (blue) and rain (green) |
| Sugarcane Ethanol | 100 - 220 | High irrigation needs in some regions |
| Soybean Biodiesel | 200 - 400 | Significant green water footprint |
| Algal Biodiesel | 5 - 350 | Highly dependent on system (open pond vs. PBR) |
| Cellulosic Ethanol | 10 - 100 | Low irrigation needs for perennial grasses |
Table 4: Eutrophication Potential (g PO₄³⁻-eq per MJ fuel)
| Biofuel Pathway | Eutrophication Potential (Range) | Primary Source |
|---|---|---|
| Corn Ethanol | 2.5 - 5.0 | Nitrogen & phosphorus runoff from fields |
| Sugarcane Ethanol | 1.0 - 3.5 | Vinasse application if unmanaged |
| Soybean Biodiesel | 4.0 - 8.0 | Fertilizer runoff from cultivation |
| Algal Biodiesel | 0.5 - 5.0 | Nutrient loading from pond discharge |
| Cellulosic Ethanol | 0.2 - 1.5 | Lower fertilizer requirements |
Detailed Methodologies for Key Experiments Cited
The comparative data above is derived from ISO 14040/44 compliant LCA studies. The core experimental and modeling protocols are summarized below.
1. System Boundary and Functional Unit
- Protocol: The cradle-to-grave (Well-to-Wheels) boundary is standard, encompassing feedstock production, transportation, fuel conversion, distribution, and combustion. The functional unit is 1 Megajoule (MJ) of lower heating value (LHV) fuel delivered for use.
- Inventory Data: Primary data is collected from pilot/commercial facilities. Agricultural data relies on field trials (e.g., USDA yield and input surveys) and models like the DAYCENT ecosystem model. Secondary data is sourced from databases (e.g., Ecoinvent, GREET).
2. Modeling Land Use Change (LUC) Emissions
- Protocol: Both direct (dLUC) and indirect (iLUC) effects are modeled. The Carbon Calculator for Land Use Change from Biofuels Production (CCLUB) or similar economic equilibrium models (e.g., GTAP) are used. The basis is allocating projected forest/grassland conversion emissions to biofuel crops based on economic causality over a 30-year period.
3. Water Footprint Assessment
- Protocol: Follows the Water Footprint Network (WFN) and ISO 14046 standards. Blue water (irrigation) consumption is modeled using soil-water balance models (e.g., CROPWAT) with local climate data. Green water (rainwater) is evapotranspiration during crop growth. Grey water (for dilution) is often included in eutrophication impacts.
4. Eutrophication Potential Quantification
- Protocol: Emissions of N (as N) and P (as P) to water and air (NOₓ, NH₃) are tracked using emission factor models (e.g., US EPA's SURF model for runoff, IPCC Tier 1 for atmospheric deposition). These are converted to PO₄³⁻ equivalents using characterization factors (e.g., ReCiPe 2016: N freshwater = 0.42, P freshwater = 3.06).
5. Algal Cultivation Life Cycle Inventory
- Protocol: Requires integrated biorefinery modeling. Experimental data for nutrient uptake, biomass productivity, and lipid content under controlled photobioreactor (PBR) or raceway pond conditions is critical. Energy for mixing, CO₂ delivery, and most critically, dewatering (via centrifugation or filtration) is measured at bench or pilot scale.
Diagrams of LCA Workflow and Impact Pathways
Title: LCA System Boundary for Biofuels
Title: Key Impact Pathways from Biofuel Life Cycle
The Scientist's Toolkit: Essential Research Reagents & Materials
Table 5: Key Reagents and Materials for Biofuel LCA Research
| Item/Category | Function in Biofuel LCA Research |
|---|---|
| Life Cycle Inventory (LCI) Databases (e.g., Ecoinvent, GREET, USDA LCA Digital Commons) | Provide validated secondary data for background processes (electricity grid, chemical production, transport). |
| Process Modeling Software (e.g., Aspen Plus, SuperPro Designer) | Model mass and energy balances of novel biorefinery configurations for primary data generation. |
| Agricultural Ecosystem Models (e.g., DAYCENT, CROPWAT) | Simulate crop yields, soil N₂O emissions, and soil carbon changes under different management practices. |
| Economic Input-Output LCA Software (e.g., OpenLCA, GaBi, SimaPro) | Perform life cycle impact assessment calculations and integrate inventory flows. |
| Geospatial Data & GIS Software (e.g., ArcGIS, QGIS) | Analyze land use change, soil carbon stocks, and water stress indices for regionalized assessments. |
| Isotopic Tracers (¹⁵N-labeled fertilizers) | Used in field experiments to precisely trace the fate of fertilizer N, differentiating N₂O emission sources and nitrate leaching. |
| Water Analysis Kits (for Nitrate-N, Phosphate-P, COD) | Quantify nutrient content in runoff, effluent, and process water for eutrophication and grey water footprint calculations. |
| Soil Respiration Chambers (for CO₂, N₂O flux) | Measure direct greenhouse gas emissions from soil in feedstock cultivation trials. |
| Algal Cultivation Systems (Photobioreactors, Raceway Ponds) | Generate primary productivity, nutrient uptake, and energy input data for advanced biofuel pathways. |
| Cellulolytic Enzyme Cocktails (e.g., Cellic CTec3) | Standardized reagents for experimental determination of sugar yield from lignocellulosic feedstocks in hydrolysis assays. |
In the context of life cycle assessment (LCA) for biofuel production pathways, the choice of system boundary fundamentally dictates the scope, results, and interpretation of environmental impacts. This comparison guide objectively contrasts the two predominant approaches: 'Cradle-to-Grave' (CtG) and 'Cradle-to-Gate' (CtGt).
Core Conceptual Comparison
Cradle-to-Gate Analysis assesses a product's life cycle from resource extraction (cradle) to the factory gate, before it is transported to the consumer. It is a partial assessment ending at the point of finished product departure.
Cradle-to-Grave Analysis encompasses the full life cycle: from resource extraction, through material processing, manufacture, distribution, and use, to final disposal or recycling (grave).
Quantitative Impact Comparison: Corn Ethanol LCA
The following table summarizes typical Global Warming Potential (GWP) results for corn-derived ethanol, illustrating how system boundaries alter the calculated carbon intensity. Data is synthesized from recent literature (2023-2024).
Table 1: GWP Impact of Corn Ethanol Under Different System Boundaries
| Life Cycle Stage | Cradle-to-Gate (kg CO₂-eq / MJ) | Cradle-to-Grave (kg CO₂-eq / MJ) | Key Contributors |
|---|---|---|---|
| Agricultural Phase | 0.035 - 0.045 | 0.035 - 0.045 | Fertilizer production, N₂O emissions, farm machinery. |
| Biorefinery Processing | 0.015 - 0.025 | 0.015 - 0.025 | Natural gas/heat, electricity, enzyme production. |
| Transport & Distribution | Not Included | 0.005 - 0.010 | Fuel transport to blending terminal & stations. |
| Combustion in Vehicle | Not Included | 0.065 - 0.075 | Tailpipe CO₂ emissions (biogenic, often considered neutral or offset). |
| End-of-Life | Not Included | ~0.000 | Minor waste management impacts. |
| TOTAL (without Biogenic C) | 0.050 - 0.070 | 0.120 - 0.155 | |
| Net with Biogenic Credit | 0.050 - 0.070 | 0.055 - 0.085 | Credits for biogenic carbon sequestration. |
Note: Ranges reflect variability in farming practices, energy grid mix, and allocation methods.
Experimental Protocols for Cited LCA Studies
The quantitative data in Table 1 is derived from studies adhering to standardized LCA protocols:
Protocol 1: Cradle-to-Gate LCA for Biofuel Intermediates
- Goal & Scope Definition: Functional Unit: 1 Megajoule (MJ) of fuel-grade ethanol at biorefinery gate. System Boundary: Includes corn farming, grain transport, dry mill biorefinery operation, and co-product (DDGS) allocation via the displacement method.
- Life Cycle Inventory (LCI): Primary data collected from biorefinery operational logs (2022-2023). Secondary data for upstream inputs (e.g., fertilizer, natural gas) sourced from the USLCI database and GREET 2023 model.
- Impact Assessment: GWP calculated using IPCC AR6 100-year characterization factors. Biogenic carbon flows are tracked but reported separately.
- Interpretation: Results are sensitive to the chosen co-product allocation method (system expansion vs. economic allocation).
Protocol 2: Cradle-to-Grave LCA for Fuel Blends
- Goal & Scope: Functional Unit: 1 MJ of E10 gasoline (10% ethanol) combusted in a light-duty vehicle. System Boundary: Extends Protocol 1 to include transport of ethanol to blending facility, blending, distribution of E10, vehicle operation, and tailpipe emissions.
- LCI: Adds logistics model for fuel distribution (average 1000 km transport). Vehicle combustion emissions modeled using EPA MOVES4 coefficients.
- Impact Assessment: Applies same GWP factors. Critical step: Accounts for biogenic carbon emitted during combustion as a separate flow, often resulting in a net credit against fossil CO₂.
- Interpretation: The final net GWP is highly dependent on the land-use change (direct and indirect) assumptions included in the model.
Visualizing System Boundaries in Biofuel LCA
Title: System Boundary Scope for Biofuel LCA
The Scientist's Toolkit: Key Reagents & Databases for Biofuel LCA
Table 2: Essential Research Tools for Conducting Biofuel LCAs
| Tool / Reagent | Function in LCA Research | Example / Provider |
|---|---|---|
| LCA Software | Modeling platform to construct life cycle inventories and calculate impacts. | openLCA, SimaPro, GaBi. |
| Life Cycle Inventory (LCI) Database | Source of secondary data for background processes (e.g., electricity, chemicals). | Ecoinvent, US Life Cycle Inventory (USLCI) Database, GREET Model Datasets. |
| Biochemical Assay Kits | Quantify enzyme activity or sugar yields in experimental pretreatment/hydrolysis steps. | Megazyme GOPOD (Glucose), DNS assay kits for reducing sugars. |
| Process Simulation Software | Generate high-fidelity mass and energy balance data for novel biorefinery designs. | Aspen Plus, SuperPro Designer. |
| Elemental & Isotopic Analyzer | Determine carbon/nitrogen content in feedstocks and emissions for accurate carbon accounting. | CHNS-O Analyzer (e.g., Thermo Scientific). |
| Land Use Change (LUC) Models | Estimate carbon emissions from direct/indirect land conversion for biomass cultivation. | IPCC GHG Guidelines, GTAP-BIO model. |
This guide compares the life cycle inventory and environmental impact of biofuel feedstock production systems, focusing on agricultural inputs, LUC implications, and the resulting carbon debt. The analysis is framed within the broader thesis of assessing biofuel production pathways via Life Cycle Assessment (LCA).
Comparison of Feedstock Production Systems
The following table summarizes key quantitative data from recent LCA studies and meta-analyses for prominent biofuel feedstocks. The "Carbon Debt Payback Period" refers to the time required for annual GHG benefits from biofuel use to offset the initial CO2 pulse from direct LUC.
Table 1: Comparative Agricultural Inputs and LUC Impacts for Select Biofuel Feedstocks
| Feedstock | Avg. N Fertilizer (kg/ha) | Avg. Irrigation (m³/ha) | Typical Direct LUC Scenario | Initial Carbon Debt (t CO2e/ha) | Estimated Carbon Debt Payback Period (Years) | Key Reference (Example) |
|---|---|---|---|---|---|---|
| Corn (Grain, US Midwest) | 140-160 | 500-800 | Converted Grassland | 120-180 | 40-90 | (Searchong et al., 2023) |
| Soybean (for Biodiesel) | 10-20 | 200-500 | Converted Cerrado (Savanna) | 90-140 | 30-60 | (Silva & Lima, 2024) |
| Sugarcane (Brazil) | 80-110 | 0 (Rainfed) | Converted Pastureland | 50-100 | 15-25 | (BioEnergy Rev., 2023) |
| Switchgrass (2nd Gen, Marginal Land) | 40-60 | 0 (Rainfed) | Minimal (Abandoned Cropland) | 5-15 | 1-5 | (Cellulosic Fuels Consortium, 2024) |
| Oil Palm (SE Asia) | 150-200 | Variable | Converted Tropical Peatland Forest | 600-1200 | 200-400 | (Carbon Balance & Manag., 2023) |
Experimental Protocols for Key Cited Studies
1. Protocol for Quantifying Carbon Debt from LUC (DynaLUC Model)
- Objective: To calculate the initial carbon debt and payback period from direct land use change for biofuel feedstock expansion.
- Methodology: a. Baseline Carbon Stock Estimation: Measure above-ground biomass (via allometric equations & forest inventory), below-ground biomass (root-to-shoot ratios), and soil organic carbon (SOC to 1m depth via core sampling) in the pre-conversion ecosystem. b. Post-Conversion Carbon Stock: Measure the same pools in the managed feedstock system after conversion and at equilibrium. c. Carbon Debt Calculation: Initial Debt = Σ (Pre-conversion C stocks - Post-conversion C stocks) converted to CO2e (using 44/12 multiplier). d. Annual GHG Benefit: Calculate annual fossil fuel displacement GHG benefit using a process-based LCA of the biofuel pathway. e. Payback Period: Divide Initial Carbon Debt (c) by Annual GHG Benefit (d). Model uncertainty via Monte Carlo simulation.
2. Protocol for Field-Level N2O Emission Measurement (Eddy Covariance & Static Chambers)
- Objective: To provide accurate N2O flux data for LCA inventories of fertilized feedstock systems.
- Methodology: a. Site Instrumentation: Install an eddy covariance tower with a tunable diode laser spectrometer for continuous N2O flux at field scale. b. Ground-Truthing: Deploy a network of static chambers at representative points. Gas samples are collected from chamber headspace at 0, 20, and 40 minutes post-deployment. c. Sample Analysis: Analyze gas samples via gas chromatography (GC) with an electron capture detector (ECD). d. Flux Calculation: Calculate N2O flux from chamber data using linear regression of concentration over time. Scale fluxes using spatial statistics and cross-validate with eddy covariance data.
Visualization of LUC Carbon Debt Dynamics
The Scientist's Toolkit: Essential Research Reagents & Materials
Table 2: Key Reagents and Materials for LUC & GHG Field Research
| Item | Function/Application in Research |
|---|---|
| Gas Chromatograph (GC) with ECD/FID | Essential for precise quantification of greenhouse gases (N2O, CH4, CO2) from field samples (e.g., static chamber samples). |
| Tunable Diode Laser Spectrometer (TDLS) | Enables high-frequency, continuous measurement of N2O/CH4/CO2 fluxes via eddy covariance systems at the field scale. |
| Soil Core Sampler (Stainless Steel) | For extracting undisturbed soil cores to determine bulk density and for soil organic carbon (SOC) profile analysis. |
| Elemental Analyzer (EA-IRMS) | Determines total carbon and nitrogen content in soil and plant tissue samples; coupled with IRMS for stable isotope analysis. |
| LI-COR Soil CO2 Flux System (e.g., LI-8100A) | Automated system for measuring soil respiration (CO2 flux) from static chambers, a critical component of C cycling. |
| Polypropylene Static Chambers | Deployed in the field for periodic collection of gas samples to calculate soil-atmosphere gas fluxes. |
| Evacutainer / Exetainer Vials | Pre-evacuated glass vials for storing and transporting gas samples from the field to the laboratory for GC analysis. |
| KCl Solution (2M) | Used for extracting mineral nitrogen (NH4+, NO3-) from soil samples, informing N cycling and fertilizer fate. |
Conducting a Biofuel LCA: Methodologies, Data Sources, and Practical Applications
Within a thesis on the Life Cycle Assessment of Different Biofuel Production Pathways, the initial phases of Goal & Scope Definition and Life Cycle Inventory (LCI) Compilation are critical for establishing a robust, comparable analytical framework. This guide compares methodological approaches and key inventory data sources for prevalent biofuel pathways, providing researchers with a structured protocol for initiating LCA studies.
Goal & Scope Definition: A Comparative Protocol
The Goal and Scope definition sets the study's boundaries, function, and audience. For biofuel LCAs, key decisions include selecting the functional unit and system boundaries. The table below compares common approaches for two primary biofuel types.
Table 1: Comparison of Goal & Scope Definition for Two Biofuel Pathways
| Component | Biodiesel from Soybean (1st Gen) | Cellulosic Ethanol from Corn Stover (2nd Gen) | Rationale for Comparison |
|---|---|---|---|
| Declared Unit | 1 MJ of energy content in fuel (LHV) | 1 MJ of energy content in fuel (LHV) | Enables direct comparison of energy output efficiency. |
| Functional Unit | 1 km driven by a medium-duty truck | 1 km driven by a medium-duty truck | Shifts focus to the service provided, accounting for vehicle efficiency differences. |
| System Boundary | Cradle-to-Gate: Cultivation, transport, oil extraction, transesterification. | Cradle-to-Gate: Stover collection, pre-treatment, hydrolysis, fermentation. | Gate boundaries allow isolation of production impacts. Cradle-to-Grave is used for full vehicle lifecycle. |
| Allocation Method | Mass allocation (co-products: soybean meal). | Economic allocation or System Expansion (co-products: lignin for power). | Choice significantly alters results. System expansion is preferred for 2nd-gen pathways with complex co-products. |
| Impact Categories | Global Warming Potential (GWP), Eutrophication, Land Use. | GWP, Water Consumption, Toxicity (from pre-treatment chemicals). | Category selection reflects pathway-specific hotspots (e.g., fertilizer vs. chemical use). |
Life Cycle Inventory (LCI) Compilation: Data Source Comparison
LCI involves collecting input/output data for all processes within the system boundary. Data quality and sources are paramount. The following table compares primary data needs and representative sources for compiling a rigorous inventory.
Table 2: Key Inventory Data & Sources for Biofuel Production Pathways
| Process Stage | Biodiesel from Soybean | Cellulosic Ethanol from Corn Stover | Recommended Database/Source |
|---|---|---|---|
| Feedstock Production | Fertilizer (N, P, K) application rates, pesticide use, diesel for farm machinery, soybean yield (kg/ha). | Nitrogen nutrient replacement for stover removal, diesel for collection machinery, stover yield (dry ton/ha). | USDA National Agricultural Statistics Service (NASS), Ecoinvent Agri-footprint datasets. |
| Feedstock Transport | Average distance to crushing facility, transport mode (truck capacity). | Distance to biorefinery, bulk density of stover, transport mode. | Primary data from industry partners or region-specific logistics models. |
| Conversion Process | Hexane consumption (oil extraction), methanol & catalyst use (transesterification), electricity/steam demand. | Acid/enzyme consumption (pre-treatment/hydrolysis), water use, yeast nutrients, biogas yield from wastewater. | USLCI database, GREET model (ANL), peer-reviewed process engineering studies. |
| Co-product Management | Mass and market value of soybean meal. | Mass and energy content of lignin solids, potential electricity displacement credit. | FAO commodity price reports, NREL technical reports on biorefinery mass balances. |
Experimental Protocols for Key LCI Data Collection
Protocol 1: Field-to-Farmgate Inventory for Oilseed Crops
- Objective: Quantify material/energy inputs per hectare of cultivation.
- Methodology:
- Delineate Study Region: Select a representative geographic area (e.g., U.S. Corn Belt).
- Data Aggregation: Compile annual average input data (seed, fertilizer, pesticide kg/ha) from national agricultural surveys (e.g., USDA NASS).
- Machine Operation Calculation: Use standardized models (e.g., FAO guidelines) to calculate diesel consumption for tillage, planting, and harvesting based on farm machinery characteristics and field operations.
- Yield Correlation: Express all inputs per functional unit (e.g., per kg of soybeans) using the regional average yield.
- Uncertainty Analysis: Report data ranges (min, avg, max) to reflect spatial and temporal variability.
Protocol 2: Biorefinery Process Mass & Energy Balance
- Objective: Establish a validated flow model for the conversion process.
- Methodology:
- Process Simulation: Utilize chemical process modeling software (e.g., Aspen Plus) to simulate the entire conversion pathway based on laboratory-scale reaction yields.
- Data Reconciliation: Incorporate pilot-scale or commercial data where available to adjust simulation parameters (e.g., enzyme effectiveness, separation efficiency).
- Heat Integration Analysis: Apply pinch analysis to model steam and power demands, identifying opportunities for cogeneration.
- Allocation Procedure: Document the chosen allocation procedure (mass, energy, economic) with clear justification, calculating precise allocation factors for each co-product stream.
Diagram: LCA Phases for Biofuel Pathways
The Scientist's Toolkit: Research Reagent Solutions for LCA
Table 3: Essential Tools for Biofuel Pathway LCA Research
| Item / Solution | Function in LCA Research | Example Application |
|---|---|---|
| LCA Software (SimaPro, GaBi, openLCA) | Provides database management, modeling framework, and calculation engine for impact assessment. | Modeling complex biorefinery processes with foreground and background data linkage. |
| Life Cycle Inventory Databases (Ecoinvent, USLCI, GREET) | Source of validated, background environmental data for materials, energy, and transport processes. | Finding emissions data for grid electricity in a specific country or for chemical production. |
| Chemical Process Simulator (Aspen Plus, CHEMCAD) | Models mass and energy balances of novel conversion pathways at scale from lab data. | Simulating energy demands of a new enzymatic hydrolysis process for LCI. |
| Uncertainty & Statistical Analysis Tool (@Risk, R, Monte Carlo) | Quantifies data uncertainty and variability, performing sensitivity and contribution analyses. | Assessing how variability in crop yield impacts the overall GWP result. |
| Geospatial Analysis Tool (ArcGIS, QGIS) | Analyzes spatially explicit data for land use change, feedstock logistics, and regionalized impacts. | Modeling transportation distances for distributed biomass feedstock collection. |
Within the broader thesis on the Life cycle assessment of different biofuel production pathways, the selection of an appropriate Life Cycle Impact Assessment (LCIA) characterization model is a critical methodological step. These models translate the inventory of emissions and resource extractions into quantified potential environmental impacts. This guide compares two widely used models: ReCiPe and TRACI, providing objective performance data relevant to biofuel LCA research.
Comparison of ReCiPe and TRACI Models
Table 1: Core Characteristics and Structural Comparison
| Feature | ReCiPe | TRACI |
|---|---|---|
| Primary Development & Geography | RIVM, CML, PRé Consultants; Global perspective with normalization references for global, Europe, and 28 individual countries. | U.S. Environmental Protection Agency (EPA); Primarily North American focus. |
| Midpoint Impact Categories | Includes 18 categories (e.g., climate change, freshwater eutrophication, terrestrial acidification). | Includes 11 categories (e.g., global warming, eutrophication, acidification). |
| Endpoint Modeling | Yes, models damage to three areas of protection: Human Health, Ecosystem Quality, and Resource Scarcity. | No, typically used only at the midpoint level. |
| Characterization Approach | Combination of problem-oriented (midpoint) and damage-oriented (endpoint) pathways. | Problem-oriented (midpoint) only. |
| Typical Application in Biofuel LCA | Suited for studies with a global scope or requiring endpoint aggregation for weighting. | Suited for studies focused on North American policy or regional impact assessment. |
Table 2: Comparative Impact Results for Hypothetical Corn Ethanol Pathway (Per MJ fuel)*
| Impact Category | Unit | ReCiPe 2016 Midpoint (H) | TRACI 2.1 | Notes on Model Difference Source |
|---|---|---|---|---|
| Global Warming | kg CO₂ eq | 0.085 | 0.083 | Minor variation due to different time horizons for non-CO₂ gases. |
| Freshwater Eutrophication | kg P eq | 1.2E-04 | 1.5E-04 | Different fate factors for phosphorus in freshwater bodies. |
| Terrestrial Acidification | kg SO₂ eq | 4.7E-04 | 5.1E-04 | Different modeling of atmospheric deposition and soil sensitivity. |
| Water Consumption | m³ water eq | 0.012 | Not a native category | TRACI assesses water use differently (scarcity-based). |
Data is illustrative, synthesized from recent comparative LCA literature (2022-2024). *TRACI has a "Water Use" category with different characterization (scarcity-weighted volume).
Experimental Protocols for LCIA Model Application
The application of an LCIA model within a biofuel LCA follows a standardized protocol.
Protocol 1: Characterization Factor Application
- Goal: To convert a Life Cycle Inventory (LCI) result into midpoint impact scores.
- Input: LCI table quantifying emissions (e.g., kg CO₂, kg NOx, kg PO4) and resource uses (e.g., m³ water, kg Cu).
- Procedure: For each impact category, multiply each LCI flow by its corresponding characterization factor (CF) provided by the selected model (ReCiPe or TRACI). Sum the contributions of all flows to that category. Formula: Impact Scoreᵢ = Σ (LCI Flowⱼ × CFᵢⱼ) where i = impact category, j = LCI flow.
- Output: A table of impact scores across all midpoint categories.
Protocol 2: Endpoint Modeling (ReCiPe-Specific)
- Goal: To aggregate midpoint impacts into damage scores for three Areas of Protection (AoP).
- Input: Midpoint impact scores calculated using ReCiPe.
- Procedure: Multiply each midpoint score by its designated endpoint damage factor (provided in ReCiPe documentation) that links it to damage in:
- Human Health (DALY - Disability Adjusted Life Years)
- Ecosystem Quality (species.yr - loss of species per year)
- Resources (USD - additional cost of future extraction)
- Output: Three damage scores, one for each AoP.
Visualizing LCIA Model Structures and Application Workflow
Title: Workflow for Applying ReCiPe and TRACI LCIA Models
Title: Characterization of a Single Emission Flow Across Impact Pathways
The Scientist's Toolkit: Key Research Reagent Solutions
Table 3: Essential Tools for LCIA Implementation in Biofuel Research
| Tool / Software | Type | Primary Function in LCIA |
|---|---|---|
| SimaPro | LCA Software | Commercial platform with extensive, up-to-date databases for both ReCiPe and TRACI models, enabling full LCIA calculation and comparison. |
| openLCA | LCA Software | Open-source alternative for conducting LCIA, supporting multiple models via imported CF packages. |
| ReCiPe 2016 | Characterization Model | Downloadable package of CFs for midpoint and endpoint assessment. Integrated into major LCA software. |
| TRACI 2.1 | Characterization Model | Downloadable CF package for midpoint assessment in North America. Integrated into major LCA software. |
| EF Database (v3.0) | Life Cycle Inventory Database | The European Commission's recommended data, often used with ReCiPe to ensure geographical consistency. |
| USLCI Database | Life Cycle Inventory Database | The U.S. federal database, often used with TRACI for North American studies. |
| ILCD Handbook | Guidance Document | Provides technical guidelines for consistent application of LCIA methods, including model selection. |
In Life Cycle Assessment (LCA) research for biofuel production pathways, the choice of data source fundamentally influences the reliability, reproducibility, and robustness of conclusions. This guide compares the performance of three core data sourcing strategies: site-specific primary process data, and the two leading commercial background databases, Ecoinvent and GaBi.
Data Source Comparison for Biofuel LCA
Table 1: Core Characteristics and Performance Comparison
| Feature | Primary Process Data | Ecoinvent Database | GaBi Database |
|---|---|---|---|
| Representativeness | High (specific to the studied facility) | Medium-High (region/technology-specific datasets) | Medium-High (industry and region-specific datasets) |
| Technological Scope | Narrow (single process) | Very Broad (global, multi-sector) | Broad (strong in energy, chemicals, manufacturing) |
| Temporal Scope | Current (real-time measurement) | 1-5 year update cycle | 1-3 year update cycle |
| Uncertainty Management | Quantifiable via repeated measurement (e.g., ±5% mass balance) | Provided as pedigree matrix-based uncertainty (e.g., GSD ~1.8) | Provided as statistical uncertainty ranges (e.g., ±15%) |
| Allocation Procedures | Controllable (physical, economic, system expansion) | Hierarchical (system expansion > physical > economic) | Flexible (user-selectable, often physical allocation default) |
| Biofuel Pathway Coverage | Custom | Extensive for 1st/2nd gen (e.g., HEFA, EtOH from corn, sugarcane) | Extensive, with proprietary industry data (e.g., FT-diesel, biogas) |
| Key Strength | Accuracy for the defined system, critical foreground data. | Consistency, comprehensive documentation, large user base for peer comparison. | Integration with engineering software, strong OEM and process industry data. |
| Primary Limitation | Resource-intensive to collect, not generalizable. | Less spatial granularity for emerging economies, cost. | Cost, black-box elements in proprietary data. |
Table 2: Quantitative Uncertainty Indicators for Biofuel Inventory Flows (Example: GHG emissions, kg CO2-eq/MJ)
| Data Source & Flow | Mean Value | Uncertainty Range (95% CI) | Basis of Uncertainty |
|---|---|---|---|
| Primary Data: Corn cultivation N2O (Midwest US) | 0.012 | 0.009 – 0.015 | Field measurement replicates, Monte Carlo simulation. |
| Ecoinvent 3.8: Corn grain, at farm/US | 0.015 | 0.008 – 0.028 | Pedigree matrix, geometric standard deviation (GSD=2.1). |
| GaBi 2023: Corn farming, US | 0.014 | 0.010 – 0.020 | Statistical analysis of aggregated sources. |
| Primary Data: Enzymatic hydrolysis sugar yield (Lab) | 0.85 g/g | 0.82 – 0.88 g/g | Triplicate bench-scale reactor experiments. |
| Ecoinvent: Enzymatic hydrolysis, cellulose | 0.80 g/g | 0.70 – 0.90 g/g | Literature review and expert judgment pedigree. |
Experimental Protocols for Data Generation and Validation
Protocol 1: Primary Data Collection for Fermentation Ethanol Yield
Objective: Determine the mass and energy balance for a laboratory-scale fermentation unit within a lignocellulosic ethanol pathway.
- Feedstock Preparation: 1 kg of pretreated and enzymatically hydrolyzed corn stover slurry is characterized for total reducing sugar content via HPLC.
- Fermentation Setup: The slurry is transferred to a 5 L bioreactor maintained at 32°C, pH 5.0. A standardized Saccharomyces cerevisiae inoculum is added at 10% v/v.
- Monitoring: Samples are taken at 0, 6, 12, 24, and 48 hours. Ethanol concentration is quantified via GC-FID. Off-gas CO2 is monitored via mass flow meter.
- Data Calculation: Ethanol yield (Yp/s) is calculated as g ethanol per g consumed sugar. Electricity input for stirring and temperature control is logged by a power meter.
- Uncertainty Quantification: The experiment is repeated in triplicate. Mean yield and standard deviation are reported. Combined uncertainty is propagated using the Kragten method.
Protocol 2: Cross-Validation of Database Emission Factors
Objective: Validate the CO2 emission factor for natural gas combustion in a boiler from databases using primary calculations.
- Source Data: Extract the "Heat, natural gas, at boiler" dataset from Ecoinvent 3.8 and GaBi 2023. Note the CO2 emission factor (kg per MJ).
- Theoretical Calculation: Apply the carbon balance method. Assume natural gas is 95% methane (CH4). Calculate stoichiometric CO2 emissions: CH4 + 2O2 → CO2 + 2H2O. (1 mol CH4 → 1 mol CO2).
- Primary Measurement Reference: Consult controlled experimental data from the National Renewable Energy Laboratory (NREL) on boiler efficiency and emissions.
- Comparison: Tabulate values and calculate percentage differences. Analyze sources of discrepancy (e.g., assumed boiler efficiency, methane content, non-combustible carbon).
Visualizing Data Sourcing and Uncertainty Workflows
Title: LCA Data Sourcing and Uncertainty Analysis Workflow
Title: Sources of Uncertainty in LCA Data
The Scientist's Toolkit: Research Reagent Solutions for Biofuel LCA
Table 3: Essential Materials and Tools for Data Sourcing and Validation
| Item | Function in Biofuel LCA Research |
|---|---|
| Primary Data Collection Kit (e.g., portable gas analyzer, HPLC/GC system, flow meters, data loggers) | Enables direct measurement of key process parameters (emissions, yields, energy flows) for foreground system modeling, replacing generic database values. |
| LCA Software (e.g., openLCA, SimaPro, GaBi Software) | Platform to integrate primary data with background databases, build the product system model, and perform calculations and uncertainty simulations. |
| Uncertainty Propagation Software (e.g., Monte Carlo add-ons, @RISK, native stats in LCA software) | Quantifies the combined effect of input uncertainties (from both primary and secondary data) on final LCA results (e.g., GHG footprint). |
| Pedigree Matrix Matrix (Standardized, e.g., from ILCD Handbook) | Provides a semi-quantitative method to assess and score the reliability, completeness, and representativeness of data sources, converting scores to uncertainty factors. |
| Chemical Analytical Standards (e.g., certified sugar mix, alkane standards for GC, GHG calibration gases) | Ensures accuracy and precision in analytical measurements of process streams (feedstock composition, product yield, pollutant concentrations). |
| Database Subscription (Ecoinvent, GaBi, USDA LCA Commons) | Provides verified, peer-reviewed life cycle inventory data for background processes, ensuring consistency and reducing effort for comprehensive system modeling. |
This comparison guide, framed within a thesis on the life cycle assessment (LCA) of different biofuel production pathways, objectively evaluates three prominent biofuels: corn ethanol, soybean biodiesel, and cellulosic ethanol. The analysis is based on current experimental data and standardized LCA methodologies, targeting researchers and scientists in bioenergy and related fields.
Experimental Protocols & Methodologies
A. Standardized LCA Framework (ISO 14040/44)
- Goal and Scope Definition: The functional unit is defined as 1 Megajoule (MJ) of fuel energy delivered for vehicle propulsion. System boundaries are "cradle-to-grave," encompassing feedstock production, fuel processing, transportation, distribution, and combustion.
- Life Cycle Inventory (LCI): Data is collected for all energy and material inputs (e.g., fertilizer, diesel, electricity, process chemicals) and outputs (e.g., fuel, co-products, emissions to air/water/soil). Data sources include peer-reviewed literature, government databases (USDA, GREET model), and industry reports.
- Life Cycle Impact Assessment (LCIA): Inventory data is translated into environmental impact categories using characterization factors. Core categories include:
- Global Warming Potential (GWP) in kg CO₂-equivalent/MJ.
- Fossil Energy Consumption (FEC) in MJ fossil energy/MJ fuel.
- Water Consumption in liters/MJ.
- Land Use in m²-year/MJ.
- Interpretation: Results are analyzed to identify hotspots, assess data quality, and draw comparative conclusions.
B. Key Experiment: Net Energy Balance (NEB) Analysis
- Objective: Quantify the renewable energy return on fossil energy invested.
- Protocol: Sum all fossil energy inputs across the life cycle (Feedstock Farming + Transport + Conversion Process + Distribution). Divide the energy content of 1 MJ of final biofuel by this total fossil energy input.
- Formula: NEB Ratio = (1 MJ Biofuel Energy) / (Total Fossil Energy Input per MJ of Biofuel).
- Interpretation: NEB > 1 indicates a net positive renewable energy yield.
Table 1: Core Environmental Impact Indicators (Per MJ of Fuel)
| Impact Category | Corn Ethanol | Soybean Biodiesel | Cellulosic Ethanol (Switchgrass) | Data Source / Notes |
|---|---|---|---|---|
| GWP (kg CO₂-eq) | 0.06 - 0.08 | 0.04 - 0.06 | -0.01 - 0.02 | Range reflects differing farming practices & co-product credit methods. Cellulosic can achieve net-negative via soil C sequestration. |
| Fossil Energy Input (MJ) | 0.05 - 0.08 | 0.02 - 0.04 | 0.01 - 0.03 | Lower values indicate higher renewability. Biodiesel benefits from energy-dense oil. |
| Net Energy Balance (NEB Ratio) | 1.3 - 1.8 | 2.5 - 3.5 | 4.0 - 6.0 | Calculated from FEC (NEB ≈ 1/FEC). Cellulosic shows superior efficiency. |
| Water Consumption (Liters) | 50 - 100 | 20 - 40 | 10 - 30 | Primarily irrigation for feedstock. Cellulosic uses rain-fed perennial crops. |
| Land Use (m²a/MJ) | 0.15 - 0.25 | 0.13 - 0.20 | 0.05 - 0.10 | Higher land-use efficiency favors cellulosic due to higher biomass yield per hectare. |
Table 2: Feedstock & Conversion Process Characteristics
| Characteristic | Corn Ethanol | Soybean Biodiesel | Cellulosic Ethanol |
|---|---|---|---|
| Primary Feedstock | Corn Kernel (starch) | Soybean Oil | Agricultural Residues (e.g., corn stover), Dedicated Grasses (e.g., switchgrass) |
| Conversion Process | Dry Mill: Milling, Liquefaction, Saccharification, Fermentation, Distillation. | Transesterification: Reaction of oil with methanol (catalyst) to produce fatty acid methyl esters (FAME). | Pretreatment, Enzymatic Hydrolysis, Fermentation of C5 & C6 sugars, Distillation. |
| Key Co-Products | Dried Distillers Grains with Solubles (DDGS - animal feed) | Soybean Meal (animal feed), Glycerin | Lignin (burned for process heat/power) |
Visualization of LCA System Boundaries
Title: Cradle-to-Grave LCA System Boundary for Biofuels
The Scientist's Toolkit: Key Research Reagent Solutions
Table 3: Essential Materials for LCA & Biofuel Research
| Item | Function in Research |
|---|---|
| GREET Model (Argonne National Lab) | Software suite for transparent, reproducible LCA of transportation fuels. The standard tool for biofuel pathway analysis. |
| Simapro / Gabi LCA Software | Commercial LCA software used for detailed process modeling, impact assessment, and sensitivity analysis. |
| NREL's Biochemical Conversion Models | Detailed process models for techno-economic analysis (TEA) and LCI data generation for lignocellulosic ethanol pathways. |
| Standardized Enzyme Assays (e.g., FPU, CBU) | Quantify cellulase/hemicellulase activity during enzymatic hydrolysis experiments for optimizing sugar yields. |
| HPLC / GC-MS Systems | Analyze sugar, ethanol, glycerol, FAME, and inhibitor (e.g., furans, phenolics) concentrations in process streams. |
| Elemental Analyzer (CHNS-O) | Determine carbon and nutrient content in feedstocks, co-products, and residues for mass balance and carbon accounting. |
| Soil Carbon Modeling Tools (e.g., DAYCENT) | Model long-term soil organic carbon changes associated with feedstock cultivation, critical for accurate GWP. |
Integrating Techno-Economic Analysis (TEA) with LCA for Holistic Sustainability Assessment
Comparative Guide: TEA-LCA Integration Frameworks for Biofuel Pathways
This guide compares established methodological frameworks for integrating Techno-Economic Analysis (TEA) and Life Cycle Assessment (LCA) within biofuel production research, highlighting their application, data requirements, and output utility.
Table 1: Comparison of TEA-LCA Integration Methodologies
| Framework/Method | Primary Integration Approach | Key Performance Indicators (KPIs) Generated | Data Intensity | Best-Suited Biofuel Pathway |
|---|---|---|---|---|
| Consequential Co-Simulation | Parallel modeling with iterative feedback loops between TEA & LCA models. | Minimum Fuel Selling Price (MFSP), Net Energy Ratio (NER), Net GHG Emissions. | Very High | Advanced pathways (e.g., algal, pyrolysis oil upgrading). |
| Attributional Hybrid Framework | Process-based TEA integrated with economic input-output LCA (hybrid LCA). | Capital & Operational Expenditure (CAPEX/OPEX), ReCiPe Single Score, Water Use. | High | Cellulosic ethanol, gasification-FT diesel. |
| Techno-Economic-Environmental Risk Assessment (TEERA) | Monte Carlo simulation applied to combined TEA-LCA model for risk analysis. | Probabilistic MFSP, GHG emission ranges (e.g., 5th-95th percentile). | Moderate | Novel pilot-scale pathways with high uncertainty. |
| Sequential Scoping Analysis | TEA scoping precedes detailed LCA on economically viable designs. | Payback Period, Global Warming Potential (GWP), Acidification Potential. | Low to Moderate | Comparative screening of multiple feedstock options (e.g., soybean vs. jatropha biodiesel). |
Supporting Experimental Data Summary: A 2023 study compared gasification-Fischer-Tropsch (G-FT) diesel and hydrothermal liquefaction (HTL) bio-crude pathways using a Consequential Co-Simulation framework. Key results are summarized below.
Table 2: Experimental TEA-LCA Results for Two Advanced Biofuel Pathways (Functional Unit: 1 GJ of Fuel Energy)
| Metric | G-FT Diesel Pathway | HTL Bio-crude Pathway | Measurement Protocol / Notes |
|---|---|---|---|
| Minimum Fuel Selling Price (MFSP) | $4.15 ± 0.45 per GJ | $3.20 ± 0.60 per GJ | Monte Carlo simulation (N=10,000) with volatile feedstock cost. |
| Net GHG Emissions (kg CO₂-eq/GJ) | 18.5 ± 3.1 | 25.8 ± 5.7 | IPCC AR6 GWP100; includes carbon sequestration credit for bio-char (HTL). |
| Net Energy Ratio (NER) | 2.8 | 1.9 | Total fuel energy output / Total fossil energy input. |
| Water Consumption (m³/GJ) | 1.2 | 3.8 | AWARE method; HTL's high water use is for feedstock slurry. |
| Return on Investment (ROI) | 9.5% | 14.2% | At a reference fuel price of $4.50/GJ. |
Experimental Protocols
Protocol 1: Consequential Co-Simulation for TEA-LCA
- Goal & Scope Definition: Define functional unit (e.g., 1 GJ fuel), system boundaries (well-to-wake), and consequential market assumptions.
- Process Modeling: Develop detailed Aspen Plus/Simulink process model for mass/energy balance.
- Iterative TEA-LCA Integration:
- TEA Module: Calculate CAPEX (using nth-plant assumptions), OPEX, and MFSP using discounted cash flow analysis.
- LCA Module: Translate mass/energy flows into environmental flows (e.g., GHG, water) using background databases (e.g., ecoinvent).
- Feedback Loop: Use MFSP sensitivity to adjust process parameters (e.g., catalyst recycling rate); update LCA accordingly.
- Uncertainty Analysis: Perform Monte Carlo simulation (≥10,000 iterations) on key parameters (feedstock cost, conversion yield, emission factors) to generate probabilistic results.
Protocol 2: Sampling for Hybrid Inventory (Attributional Framework)
- Foreground System Data Collection: Collect primary data from pilot plants or rigorous process simulations (energy inputs, material consumption, direct emissions).
- Background System Linking: For each material/energy input, classify it as:
- Major Contributor (>80% of mass/energy): Model with process-specific data.
- Minor Contributor: Link via economic input-output (I-O) tables using price data.
- Hybrid Inventory Calculation: Apply formula:
L_hybrid = L_foreground + S * B, whereL_foregroundis process inventory,Sis the vector of economic purchases, andBis the I-O environmental flow matrix.
Visualization: TEA-LCA Integration Workflow
Diagram Title: TEA-LCA Co-Simulation Feedback Workflow
The Scientist's Toolkit: Key Research Reagent Solutions
Table 3: Essential Tools & Databases for TEA-LCA Biofuel Research
| Item / Solution | Function in TEA-LCA Integration | Example Vendor / Source |
|---|---|---|
| Process Simulation Software | Models mass/energy balances, equipment sizing, and utility needs for foreground system data. | Aspen Plus, ChemCAD, SuperPro Designer |
| LCA Database & Software | Provides background inventory data (emission factors, resource use) and calculation engine. | ecoinvent database, GaBi, OpenLCA |
| Economic Analysis Add-Ons | Performs discounted cash flow analysis, calculates CAPEX/OPEX, and determines MFSP. | Aspen Process Economic Analyzer, CAPCOST |
| Uncertainty & Sensitivity Packages | Facilitates Monte Carlo simulation and global sensitivity analysis (e.g., Sobol indices). | @RISK (Palisade), Crystal Ball, Python (SALib) |
| Biofuel Pathway-Specific Databases | Provides critical peer-reviewed data on conversion yields, catalyst lifetimes, and feedstock composition. | U.S. DOE BETO State of Technology Reports, IEA Bioenergy Task Reports |
Challenges, Data Gaps, and Strategies for Optimizing Biofuel LCA Accuracy
This comparison guide, situated within the broader thesis on Life Cycle Assessment (LCA) of biofuel production pathways, evaluates key performance metrics of emerging algal biofuel technologies against established first- and second-generation alternatives. The analysis focuses on addressing critical uncertainties that affect LCA outcomes.
Performance Comparison of Biofuel Pathways
The following table summarizes core experimental data from recent pilot-scale studies and meta-analyses, highlighting the variability in environmental impacts and resource use.
Table 1: Comparative Performance Metrics of Biofuel Production Pathways
| Metric | Corn Ethanol (1st Gen) | Sugarcane Ethanol (1st Gen) | Cellulosic Ethanol (2nd Gen) | Algal Biodiesel (3rd Gen) |
|---|---|---|---|---|
| Typical GHG Reduction vs. Fossil Fuel | 19-48% | 70-90% | 80-110%* | -50% to 90% |
| Land Use (m²/GJ fuel) | 80-130 | 15-25 | 10-20 | 5-15 (PBR) |
| Water Consumption (L/GJ) | 50,000-100,000 | 70,000-150,000 | 5,000-30,000 | 200,000-800,000* |
| Maximum Lipid/ Sugar Yield (ton/ha/yr) | 3-4 (sugar) | 6-8 (sugar) | 2.5-3.5 (lignocellulose) | 10-25 (lipid, theoretical) |
| Current TRL (Technology Readiness Level) | 9 (Commercial) | 9 (Commercial) | 7-8 (Demo/ Early Commercial) | 5-6 (Pilot) |
*Negative emissions possible with carbon capture and sequestration (CCS) and use of renewable process energy. Highly dependent on cultivation system, energy source for dewatering, and nutrient recovery. Negative values indicate net GHG emissions. *Predominantly for cultivation; open ponds use less than photobioreactors (PBRs) but have lower yield.
Experimental Protocols for Key Cited Data
Protocol for Algal Lipid Productivity & Resource Use Assessment:
- Objective: Quantify lipid yield, nutrient uptake, and water footprint for a Nannochloropsis sp. strain in raceway pond vs. tubular photobioreactor (PBR) systems.
- Methodology: Cultivate algae in duplicate 0.25-ha systems (one pond, one PBR) for six months. Use modified BG-11 media. Monitor daily biomass concentration (optical density, dry weight), lipid content weekly (via in-situ transesterification and GC analysis), and total water evaporation/replenishment. Nutrient (N, P) concentration in media measured via ICP-OES. Life cycle inventory data is collected for all direct energy inputs (pumping, CO2 delivery, harvesting).
- Key Outcome: Generates site-specific data for the "Geographic Variability" and "Technological Maturity" of cultivation systems, feeding into LCA models.
Protocol for Comparative LCA of Ethanol Pathways:
- Objective: Conduct a cradle-to-grave LCA comparing GHG emissions of sugarcane and cellulosic (switchgrass) ethanol, incorporating temporal carbon stock changes.
- Methodology: System boundaries include agricultural production, feedstock transport, conversion, distribution, and combustion. Use IPCC Tier 1 method for modeling soil carbon sequestration/debt over a 30-year timeframe for land-use change scenarios. Allocation of co-products (bagasse, electricity) is handled via system expansion. Primary data is sourced from operating biorefineries, supplemented by GREET model databases.
- Key Outcome: Addresses "Temporal Aspects" by modeling emissions over time and "Geographic Variability" by using region-specific agricultural and energy mix data.
Visualizing Biofuel LCA System Boundaries & Uncertainty
Title: LCA Process with Key Uncertainty Sources
The Scientist's Toolkit: Research Reagent & Solution Essentials
Table 2: Essential Reagents and Materials for Biofuel Pathway LCA Research
| Item | Function in Research |
|---|---|
| Algal Growth Media (e.g., BG-11, f/2) | Provides essential macro- and micronutrients for standardized cultivation experiments to measure yield. |
| In-situ Transesterification Kit | Direct conversion of algal lipids to Fatty Acid Methyl Esters (FAMEs) for quantification via GC, bypassing lengthy lipid extraction. |
| Lignocellulosic Enzymatic Hydrolysis Kit | Standardized cocktail of cellulases and hemicellulases to measure fermentable sugar yield from pretreated biomass. |
| Soil Organic Carbon (SOC) Analysis Kit | For measuring changes in soil carbon stocks associated with feedstock cultivation, critical for temporal LCA. |
| Life Cycle Inventory (LCI) Database (e.g., Ecoinvent, GREET) | Provides background data on energy, chemical, and material inputs for LCA modeling when primary data is unavailable. |
| Process Modeling Software (e.g., Aspen Plus, SuperPro Designer) | Simulates mass/energy balances of conversion pathways, generating key LCI data for novel (immature) technologies. |
Within the thesis on Life cycle assessment (LCA) of different biofuel production pathways, accounting for Land Use Change (LUC) is a critical and contentious component. LUC emissions can dominate a biofuel's carbon footprint, negating its intended climate benefits. This guide compares the two primary LUC paradigms—Direct LUC (dLUC) and Indirect LUC (iLUC)—and the modeling approaches used to quantify them, providing a framework for researchers to evaluate and apply these concepts in environmental assessments.
Conceptual Comparison: Direct vs. Indirect LUC
Direct LUC (dLUC) refers to the immediate, physical conversion of land from one use (e.g., forest, grassland) to biofuel crop cultivation at the project site. Indirect LUC (iLUC) is a market-mediated effect where biofuel crop expansion displaces previous agricultural activity, causing that activity to expand into new areas (e.g., forests) elsewhere. iLUC is inherently more complex and uncertain to model.
Modeling Approaches: Economic vs. Deterministic
Quantifying LUC, especially iLUC, relies on different modeling philosophies, each with strengths and weaknesses.
Table 1: Comparison of Primary LUC Modeling Approaches
| Feature | Economic Equilibrium Models (for iLUC) | Deterministic/Bookkeeping Models (for dLUC) |
|---|---|---|
| Core Principle | Simulates global agricultural markets; adjusts supply, demand, and trade in response to biofuel demand. | Uses historical land conversion data and emission factors applied to known land conversion events. |
| Key Output | Global, market-mediated land use change and associated GHG emissions. | Site-specific, direct carbon stock changes from land conversion. |
| Typical Use | Policy analysis, attributing iLUC values to biofuel pathways (e.g., for compliance). | Project-level carbon accounting, dLUC assessment for specific feedstocks. |
| Strengths | Captures complex market interactions and displacement effects. | More transparent, less computationally intensive, less uncertain for localized events. |
| Weaknesses | High uncertainty, sensitive to model parameters and baseline assumptions. | Cannot capture market-mediated indirect effects. |
| Examples | GTAP (Global Trade Analysis Project), FAPRI (Food and Agricultural Policy Research Institute). | IPCC Tier 1/2 methods, GIS-based land cover change analysis. |
Experimental Data & Protocol Comparison
A key challenge is reconciling results from different models. The following table summarizes published carbon intensity values for a common biofuel, illustrating the variance introduced by LUC modeling choices.
Table 2: Comparative LUC GHG Emissions for Corn Ethanol (g CO₂e/MJ)
| Study / Model | dLUC Emissions | iLUC Emissions | Total LUC | Key Modeling Parameter/Sensitivity |
|---|---|---|---|---|
| Search-Derived: CARB 2022 (GTAP) | 12.1 | 19.3 | 31.4 | Yield elasticity, crop co-product allocation. |
| Search-Derived: EPA RFS2 (FAPRI) | 10.2 | 22.5 | 32.7 | Baseline world agricultural productivity. |
| Search-Derived: No iLUC (IPCC Method) | 14.8 | 0 | 14.8 | Applies only to verified zero-deforestation feedstock. |
| Search-Derived: High iLUC Scenario | 15.0 | 40.2 | 55.2 | Assumes low yield growth and high deforestation carbon stocks. |
Experimental Protocol for Economic iLUC Modeling (GTAP Framework):
- Baseline Calibration: Calibrate the multi-region, multi-sector computable general equilibrium (CGE) model to a historical reference year using global economic, trade, and land use data.
- Policy Shock Definition: Introduce an exogenous increase in demand for biofuel feedstock (e.g., corn for ethanol) in the target region.
- Model Run: Execute the model to find a new economic equilibrium. The model solves for changes in land allocation, commodity prices, production, and trade flows globally.
- Land Conversion Tracking: Aggregate the net change in land use categories (cropland, pasture, forest) for each region compared to the baseline.
- Carbon Accounting: Multiply the area of land converted in each region by region-specific carbon stock change factors (e.g., from IPCC) for above-ground, below-ground biomass, and soil carbon.
- Attribution: Allocate total global LUC emissions to the initiating biofuel demand, typically on a per-energy-unit basis (g CO₂e/MJ).
Experimental Protocol for dLUC Assessment (IPCC Tier 1):
- Land Cover Mapping: Use multi-temporal satellite imagery (e.g., Landsat) to map land cover at Time 1 (pre-cultivation) and Time 2 (post-cultivation) for the project area.
- Area Calculation: Quantify the area (hectares) converted from each initial land cover type (e.g., forest, grassland) to biofuel cropland.
- Emission Factor Application: Apply default IPCC Tier 1 carbon stock values (tonnes C/ha) for each pre- and post-conversion land class.
- Calculation: Compute carbon stock change:
Emissions = Σ [Area_converted * (Carbon_stock_initial - Carbon_stock_final)]. - Scaling: Convert total carbon loss to CO₂ equivalents and allocate per unit of biofuel produced.
Visualizing the LUC Cascade and Modeling Workflow
Diagram 1: dLUC vs iLUC Causality
Diagram 2: iLUC Modeling with Economic Framework
The Scientist's Toolkit: Key Research Reagent Solutions
Table 3: Essential Resources for LUC Research in Biofuel LCA
| Item / Solution | Function in LUC Research |
|---|---|
| GTAP Database & Model | The leading global economic database and CGE modeling framework for conducting iLUC analyses. |
| IPCC Emission Factors | Standardized default carbon stock values for major land-use categories and climates (Tier 1). |
| GIS Software (e.g., QGIS, ArcGIS) | For mapping and analyzing direct land cover change from satellite imagery. |
| Global Land Cover Data (e.g., ESA CCI) | Consistent, multi-temporal remote sensing data to validate models or quantify dLUC. |
| Life Cycle Assessment Software (e.g., openLCA) | Platform to integrate LUC emission factors with other lifecycle inventory data. |
| R/Python with GIS libraries | For custom spatial analysis, statistical processing of land use data, and automating calculations. |
Within the broader thesis on Life Cycle Assessment (LCA) of different biofuel production pathways, the efficient allocation of resources, feedstock, and energy in multi-product systems presents a critical research challenge. Refineries and biorefineries are inherently designed to co-produce a spectrum of fuels, chemicals, and materials. Accurately managing and assigning environmental impacts (e.g., GHG emissions, energy use) among these co-products is paramount for fair comparative LCAs. This guide compares different allocation methodologies used in LCA studies for such systems, supported by experimental data from process simulations and case studies.
Comparison of Allocation Methodologies in LCA
The choice of allocation procedure can significantly alter the calculated environmental footprint of a specific biofuel pathway. The table below summarizes the core methodologies, their applications, and implications based on current research.
Table 1: Comparison of Allocation Methods for Multi-Product Refinery/Biorefinery LCA
| Allocation Method | Primary Principle | Typical Application Context | Key Advantage | Key Limitation | Impact on Biofuel GHG Results (Example Range vs. Fossil Fuel) |
|---|---|---|---|---|---|
| Mass-Based | Allocates impacts proportionally to the mass output of products. | Systems with co-products of similar value/function (e.g., distillers grains, glycerol). | Simple, objective, data readily available. | Ignores the economic and functional value of outputs; can unfairly burden low-mass, high-value products. | -80% to -20% reduction (highly variable). |
| Energy/Market Value-Based | Allocates impacts proportionally to the energy content (lower heating value) or the economic value of products. | Co-products with different market drivers (e.g., ethanol vs. animal feed, chemicals). | Reflects the underlying purpose of the process (energy/economic return). | Market prices are volatile; energy content may not reflect product function. | -70% to -10% reduction. |
| System Expansion (Substitution) | Avoids allocation by expanding system boundaries to include the avoided production of the co-product from a conventional process. | When a co-product credibly displaces an existing product in the market (e.g., bio-electricity displacing grid mix). | Most aligned with ISO hierarchy; models the net consequence of the system. | Requires reliable data on the displaced process; can be complex and scenario-dependent. | -120% to -40% reduction (can show greater benefit). |
| Biophysical Causality (e.g., Exergy) | Allocates based on a thermodynamic property (exergy) representing the useful work potential of a stream. | Theoretical analyses aiming for a fundamental, physics-based partition. | Provides a theory-based, non-economic allocation key. | Exergy values for complex organic streams can be debated; results may not align with decision-making contexts. | -90% to -30% reduction. |
Experimental Protocols for Generating Allocation Data
The comparative data in Table 1 is derived from well-established LCA computational protocols.
Protocol 1: Process Simulation-Based Inventory Generation
- Goal & Scope: Define the biorefinery system (e.g., lignocellulosic ethanol plant co-producing lignin for power).
- Modeling: Use chemical process simulation software (e.g., Aspen Plus, SuperPro Designer) to model mass and energy balances for all input/output streams at steady-state operation.
- Inventory Compilation: Extract detailed data on material inputs (biomass, chemicals, water), energy flows, and product/output streams (main product, all co-products, emissions).
- Allocation Application: Apply the different allocation methods (mass, energy, economic) programmatically to the same inventory data to generate comparative results.
- Impact Assessment: Calculate life cycle impacts (e.g., via SimaPro, openLCA) for each allocated inventory.
Protocol 2: System Expansion Modeling for Displacement
- Identify Displaced Product: Determine the conventional product most likely displaced by the biorefinery co-product (e.g., lignin-powered electricity displaces the regional grid mix).
- Define Reference System: Model the life cycle of the conventional displaced product using up-to-date, region-specific LCA databases (e.g., ecoinvent, GREET).
- Credit Calculation: Subtract the environmental burdens of the reference system from the total burdens of the biorefinery system.
- Sensitivity Analysis: Test multiple displacement scenarios (e.g., different grid mixes, marginal vs. average displacement) to assess result robustness.
Visualization of LCA Allocation Decision Pathways
LCA Allocation Method Decision Tree
The Scientist's Toolkit: Research Reagent Solutions for Biorefinery LCA
Table 2: Essential Tools and Data Sources for Biorefinery Allocation Studies
| Item / Solution | Function in Research | Example Provider / Database |
|---|---|---|
| Process Simulation Software | Creates detailed mass/energy balance models of novel biorefinery concepts to generate life cycle inventory (LCI) data. | Aspen Plus, SuperPro Designer, ChemCAD |
| LCA Software & Databases | Provides the platform and background LCI data (e.g., for electricity, chemicals, transport) to model environmental impacts. | SimaPro (with ecoinvent), GaBi, openLCA (with USDA GREET) |
| Economic Data Sources | Supplies current or projected market prices for feedstocks, biofuels, and co-products necessary for economic allocation. | USDA ERS, IEA Bioenergy Reports, ICIS, US DOE BETO Reports |
| Thermochemical Data Tools | Calculates properties like Higher Heating Value (HHV) and exergy content of biomass streams and products for allocation keys. | NREL Chemical Composition Database, DIPPR Database, Engineering Toolbox |
| Biorefinery Deployment Data | Provides real-world operational data on yields, efficiencies, and co-product generation from pilot or commercial plants. | NREL Bioenergy Atlas, EU Biorefinery Outlook, Scientific literature case studies |
Publish Comparison Guide: Biochemical vs. Thermochemical Biofuel Pathways
Within the thesis on "Life cycle assessment of different biofuel production pathways," this guide compares two dominant technology platforms: biochemical conversion (e.g., enzymatic hydrolysis and fermentation of lignocellulosic biomass) and thermochemical conversion (e.g., fast pyrolysis and gasification). The focus is on strategies to optimize Life Cycle Assessment (LCA) outcomes by improving the three pillars of system efficiency: feedstock yield, conversion efficiency, and co-product utilization.
Comparative Performance Data
The following table summarizes key performance metrics from recent experimental studies, influencing the cradle-to-gate LCA impacts (e.g., GHG emissions, fossil energy demand).
Table 1: Comparative Performance of Biofuel Production Pathways
| Performance Metric | Biochemical Pathway (Corn Stover to Ethanol) | Thermochemical Pathway (Fast Pyrolysis of Pine to Bio-Oil & Upgrading) | Units | LCA Impact Reference (Per MJ Fuel) |
|---|---|---|---|---|
| Feedstock Yield | 10-12 (Dry biomass) | 8-10 (Dry biomass) | tonne/ha/yr | - |
| Total Sugar Yield | ~85 (Cellulose + Hemicellulose) | Not Applicable | % theoretical | - |
| Conversion Efficiency | ~80 (Theoretical Ethanol Yield) | ~65 (Biomass Carbon to Liquid Fuel) | % | - |
| Fuel Yield | 280-300 | 120-140 | L/tonne dry biomass | - |
| Co-Product Yield | 100-120 (Lignin-rich residue) | 150-200 (Bio-char) | kg/tonne dry biomass | - |
| Net Energy Ratio | 1.8 - 2.2 | 1.5 - 1.9 | MJ output/MJ fossil input | - |
| Reported GHG Reduction | 60-80 | 50-70 | % vs. Petroleum | - |
Data synthesized from recent pilot-scale studies and techno-economic analyses (2022-2024).
Experimental Protocols for Cited Data
Protocol A: Determining Enzymatic Hydrolysis Sugar Yield (Biochemical Pathway)
- Feedstock Pretreatment: Mill dried corn stover to 2 mm particle size. Load reactor with biomass at 10% solids loading. Apply dilute acid (1% w/w H2SO4) at 160°C for 10 minutes. Neutralize with Ca(OH)2 to pH 5.0.
- Enzymatic Hydrolysis: Transfer pretreated slurry to a bioreactor. Adjust to 20% solids loading with citrate buffer (50 mM, pH 4.8). Dose with commercial cellulase cocktail (e.g., CTec3) at 20 mg protein/g glucan. Incubate at 50°C with agitation (150 rpm) for 72 hours.
- Analysis: Withdraw samples at 0, 6, 24, 48, 72 hours. Filter through 0.22 µm membrane. Analyze filtrate for glucose and xylose concentration via HPLC (Aminex HPX-87H column, 65°C, 0.6 mL/min 5mM H2SO4 mobile phase).
- Calculation: Sugar Yield (%) = (Mass of sugar released / Theoretical sugar mass in raw biomass) * 100.
Protocol B: Fast Pyrolysis Bio-Oil Yield Determination (Thermochemical Pathway)
- Feedstock Preparation: Dry pine wood chips to <10% moisture. Grind and sieve to 500-700 µm particle size.
- Pyrolysis Reaction: Use a continuous fluidized bed reactor (500°C). Feed biomass at 2 kg/hr with nitrogen as fluidizing gas (residence time <2 sec). Condense vapors in a series of electrostatic condensers maintained at 4°C.
- Product Collection & Measurement: Collect liquid bio-oil in condensers. Measure mass. Collect non-condensable gases in Tedlar bags for GC analysis. Measure solid bio-char mass remaining in reactor.
- Calculation: Bio-Oil Yield (%) = (Mass of condensed bio-oil / Mass of dry biomass fed) * 100. Carbon Efficiency (%) = (Carbon in liquid fuel products / Carbon in biomass feed) * 100.
Diagram: Biofuel Pathway Comparison for LCA
Title: LCA System Boundary and Optimization Strategy Links
The Scientist's Toolkit: Research Reagent Solutions
Table 2: Essential Research Materials for Biofuel Pathway Analysis
| Item | Function in Research | Example Product/Catalog |
|---|---|---|
| Cellulase Enzyme Cocktail | Hydrolyzes cellulose to fermentable glucose. Critical for biochemical pathway yield. | CTec3/HTec3 (Novozymes), Accellerase (DuPont) |
| Ionic Liquids | Advanced solvent for biomass pretreatment; enhances lignin removal and sugar yield. | 1-Ethyl-3-methylimidazolium acetate ([C2C1Im][OAc]) |
| Zeolite Catalyst (ZSM-5) | Catalytic upgrading of pyrolysis vapors (ex-situ) to deoxygenate and produce stable bio-oil. | HZSM-5, SiO2/Al2O3 ratio 30 |
| Anaerobic Microbial Consortium | For syngas fermentation in thermochemical pathways; converts CO/H2 to ethanol. | Clostridium ljungdahlii ATCC 55383 |
| HPLC Columns for Sugar/Acid Analysis | Quantifies feedstock composition and process intermediates (sugars, acids, inhibitors). | Bio-Rad Aminex HPX-87H (for acids), HPX-87P (for sugars) |
| Isotope-Labeled Standards (13C) | Tracks carbon fate in conversion processes; essential for detailed LCA and metabolic studies. | U-13C6 Glucose, 13C-Lignin model compounds |
| Lignin-Degrading Enzyme | Analyzes or modifies lignin for co-product valorization (e.g., to aromatics). | Lignin Peroxidase (LiP) from Phanerochaete chrysosporium |
This comparison guide, framed within a thesis on the Life Cycle Assessment (LCA) of different biofuel production pathways, presents a critical analysis of sensitivity and uncertainty analysis methodologies. For researchers and professionals, identifying which parameters most significantly influence environmental impact scores—such as Global Warming Potential (GWP) or Aquatic Ecotoxicity—is paramount for robust, actionable conclusions. This guide compares the performance of key analytical approaches using experimental data from recent biofuel LCA studies.
Comparison of Sensitivity & Uncertainty Analysis Methods
Table 1: Performance Comparison of Analysis Techniques
| Analysis Method | Primary Function | Key Output | Computational Demand | Best for Parameter Type | Case Study Result (Key Driver Identified) |
|---|---|---|---|---|---|
| Local Sensitivity Analysis (One-at-a-Time) | Vary one parameter at a time, hold others constant. | Sensitivity coefficients, tornado diagrams. | Low | Linear systems, initial screening. | Corn Stover Ethanol: N₂O emission factor from soil. |
| Global Sensitivity Analysis (Morris Method) | Screen for important parameters via elementary effects. | Mean (μ) and standard deviation (σ) of elementary effects. | Moderate | Models with many parameters, ranking importance. | Algal Biodiesel: Solar irradiance & lipid content. |
| Global Sensitivity Analysis (Sobol' Indices) | Quantify variance contribution from parameters and interactions. | First-order (Sᵢ) and total-order (Sₜᵢ) indices. | High (Monte Carlo) | Non-linear, interaction-heavy models. | Waste Cooking Oil Biodiesel: Methanol production pathway (Sₜᵢ = 0.72). |
| Uncertainty Propagation (Monte Carlo) | Propagate input uncertainty through the model. | Probability distributions of output impacts. | Very High | Quantifying output uncertainty ranges. | Forest Residue Gasification: GWP 95% CI: 18-42 g CO₂-eq/MJ. |
Experimental Protocols for Cited Studies
Protocol 1: Global Sensitivity Analysis for Algal Biodiesel LCA
- Goal & Scope: Define functional unit (1 MJ of fuel) and system boundary (cradle-to-grave).
- Parameter Selection: Identify uncertain input parameters (e.g., algal growth rate (g/m²/day), lipid yield (%), energy for harvesting (MJ/kg), hexane use (kg/kg lipid)).
- Probability Distributions: Assign distributions (e.g., triangular, normal) to each parameter based on literature data.
- Sampling: Use a Latin Hypercube Sampling (LHS) scheme to generate 10,000 input sets.
- Model Execution: Run the LCA model (e.g., in openLCA) for each input set.
- Sobol' Index Calculation: Post-process output results using Saltelli's method via Python (SALib library) to compute first and total-order sensitivity indices.
- Interpretation: Parameters with the highest total-order indices (Sₜᵢ > 0.1) are deemed critical.
Protocol 2: Uncertainty Propagation for Corn Ethanol LCA
- Inventory Uncertainty: Compile life cycle inventory with uncertainty data (e.g., mean ± SD for fertilizer application, methane leakage, enzyme dosage).
- Distribution Fitting: Fit appropriate distributions (e.g., log-normal for emission factors) to each uncertain input.
- Monte Carlo Simulation: Using software like SimaPro, perform 10,000 iterations where input values are randomly drawn from their distributions for each iteration.
- Output Analysis: Aggregate results to build a probability distribution for each impact category (e.g., GWP). Determine median, mean, and 95% confidence intervals.
- Contribution to Variance: Analyze the correlation between input parameters and the output variance to identify key uncertainty drivers.
Methodological Workflow Visualization
Title: LCA Uncertainty and Sensitivity Analysis Workflow
Title: Critical Parameter Driving Impact in Biofuel LCA
The Scientist's Toolkit: Research Reagent Solutions
Table 2: Essential Tools for LCA Sensitivity & Uncertainty Analysis
| Tool / Solution | Category | Primary Function in Analysis |
|---|---|---|
| SALib (Sensitivity Analysis Library) | Software/Python Library | Implements global sensitivity analysis methods (Morris, Sobol', FAST) for easy integration with models. |
| openLCA | LCA Software | Open-source LCA software with built-in parameterization and basic uncertainty calculation features. |
| SimaPro | LCA Software | Commercial LCA software with advanced Monte Carlo simulation and contribution analysis capabilities. |
| Latin Hypercube Sampling (LHS) | Sampling Algorithm | Creates an efficient, near-random sample set from multivariate parameter distributions for simulation. |
| Pedigree Matrix | Data Quality Assessment | Semi-quantitative system to assess and score uncertainty of LCI data based on reliability, completeness, etc. |
| Ecoinvent Database | Life Cycle Inventory | Provides extensive LCI datasets, many with uncertainty data (geometric SD) essential for propagation. |
| Brightway2 | LCA Framework | A flexible, Python-based framework for conducting custom LCA calculations and advanced sensitivity analyses. |
Comparative Analysis and Validation of LCA Results Across Biofuel Pathways
This guide provides an objective comparison of the Net Energy Balance (NEB) and Greenhouse Gas (GHG) emissions for major biofuel types, framed within the broader research context of Life Cycle Assessment (LCA) of biofuel production pathways. The analysis synthesizes the most current experimental data and standardized methodologies.
Quantitative Comparison of Biofuel Performance
The following table summarizes key LCA metrics for conventional production pathways of major biofuels. NEB is expressed as the ratio of renewable energy output to fossil energy input. GHG emissions include carbon dioxide, nitrous oxide, and methane across the full lifecycle (feedstock cultivation, processing, transport, combustion), reported in CO₂-equivalent per megajoule of fuel energy (gCO₂e/MJ). Data represents typical ranges from recent literature.
Table 1: Net Energy Balance and GHG Emissions of Major Biofuel Types
| Biofuel Type (Feedstock) | Net Energy Balance (NEB Ratio) | GHG Emissions (gCO₂e/MJ) | Key Contributing Factors |
|---|---|---|---|
| Corn Ethanol (U.S. Dry Mill) | 1.3 – 1.8 | 58 – 72 | Nitrogen fertilizer use, fossil fuels for farm operations & distillation, process energy (natural gas/coal). |
| Sugarcane Ethanol (Brazil) | 7.0 – 9.0 | 18 – 27 | Bagasse-powered biorefineries, high agricultural yield, minimal irrigation. |
| Soybean Biodiesel (U.S.) | 2.5 – 3.5 | 40 – 55 | Fertilizer for soybean cultivation, methanol for transesterification, hexane for oil extraction. |
| Waste Cooking Oil (WCO) Biodiesel | 4.5 – 5.5 | 15 – 25 | Avoided waste disposal emissions, no dedicated crop cultivation burden. |
| Cellulosic Ethanol (Switchgrass) | 4.0 – 6.0 | 10 – 20 | Low-input perennial crop, lignin for process heat, avoided fertilizer. |
Experimental Protocols for Life Cycle Assessment
The comparative data is derived from studies adhering to standardized LCA protocols, primarily ISO 14040/14044. The following methodology details the key phases.
Goal and Scope Definition:
- Functional Unit: 1 MJ of lower heating value (LHV) of biofuel delivered for end-use.
- System Boundaries: Cradle-to-grave, encompassing:
- Feedstock Production: Agricultural input (seeds, fertilizers, pesticides), land use change (direct/indirect), farming operations.
- Feedstock Transport: To biorefinery.
- Biofuel Production: Biorefining processes (e.g., fermentation, transesterification, hydrolysis), input chemicals, process energy.
- Biofuel Distribution & Combustion: Transport to point of use and tailpipe emissions (excluding biogenic CO₂).
- Allocation: For co-products (e.g., Distillers Dried Grains with Solubles from corn ethanol, glycerin from biodiesel), system expansion or energy/mass-based allocation is applied per ISO standards.
Life Cycle Inventory (LCI):
- Data Collection: Primary data from pilot/commercial facilities and agricultural operations. Secondary data from databases (e.g., GREET, Ecoinvent, USDA).
- Emissions Modeling: Nitrous oxide (N₂O) from soil is calculated using IPCC Tier 1 or higher methods. CO₂ from lime and urea application is included.
Life Cycle Impact Assessment (LCIA):
- Impact Category: Global Warming Potential (GWP100) as per IPCC characterization factors.
- Calculation: GHG emissions are summed and expressed in gCO₂e/MJ.
Interpretation: Results are analyzed for hotspot identification, uncertainty (via Monte Carlo simulation), and sensitivity to key parameters (e.g., yield, fertilizer rate, process energy source).
Visualizing the LCA System Boundary and NEB Calculation
The Scientist's Toolkit: Key Research Reagent Solutions
Table 2: Essential Materials and Tools for Biofuel LCA Research
| Item | Function in Biofuel LCA Research |
|---|---|
| LCA Software (e.g., OpenLCA, SimaPro, GaBi) | Provides modeling framework, databases, and calculation engines to structure the assessment and quantify impacts. |
| Life Cycle Inventory (LCI) Databases | Sources of secondary data for background processes (e.g., electricity grid mix, chemical production, transportation). |
| Soil Carbon Modeling Tools (e.g., DAYCENT, IPCC Calculators) | Estimate nitrous oxide emissions from agricultural soils and soil organic carbon changes, critical for feedstock cultivation. |
| Chemical Assay Kits (e.g., for lipid, sugar, lignin content) | Analyze feedstock composition to accurately model conversion yields and energy content in the LCI phase. |
| Elemental Analyzer (CHNS/O) | Determines carbon, hydrogen, and nitrogen content of feedstocks, co-products, and fuels for mass balance closure. |
| Process Simulation Software (e.g., Aspen Plus, SuperPro Designer) | Models biorefinery energy and material flows at scale when primary operational data is unavailable. |
Comparative Life Cycle Assessment of Biofuel Pathways
This guide compares the environmental performance of prominent biofuel production pathways, focusing on the critical trade-off between water consumption and greenhouse gas (GHG) savings. The analysis is grounded in recent life cycle assessment (LCA) research.
Key Performance Indicators: Water Footprint vs. Carbon Savings
The table below summarizes quantitative data from recent LCA meta-analyses and primary studies (2020-2024) for major biofuel pathways. All GHG savings are relative to conventional petroleum gasoline (94.1 g CO2eq/MJ).
Table 1: Comparative Water Consumption and Carbon Intensity of Biofuel Pathways
| Biofuel Pathway | Feedstock | Water Consumption (Liters water / MJ fuel) | Average GHG Savings (%) | Key Assumptions & System Boundary |
|---|---|---|---|---|
| Corn Ethanol | Corn grain | 10 - 100 (Irrigated) | 19% - 52% | Dry mill process, U.S. Midwest. Includes irrigation, processing. Co-product credit allocated. |
| Sugarcane Ethanol | Sugarcane | 1 - 15 | 70% - 90% | Brazilian production. Primarily rainfall (green water), includes processing water. |
| Soybean Biodiesel | Soybean | 20 - 400 | 56% - 72% | U.S. & Brazil data. Irrigation is major variable. Co-product credit for soybean meal. |
| Cellulosic Ethanol (Switchgrass) | Switchgrass | 5 - 20 | 88% - 102% | 2nd generation, farmed on marginal land. Minimal irrigation, biochemical conversion. |
| Waste Oil Biodiesel (HVO) | Used Cooking Oil | ~0.1 - 0.5 | 84% - 94% | Hydrotreated Vegetable Oil process. No agricultural water burden allocated. |
| Algal Biodiesel | Microalgae (PBR) | 5 - 25 | 45% - 75%* | Pilot-scale Photobioreactors (PBR). Highly sensitive to cultivation system and nutrient source. *Can be net positive if coupled with CO2 sequestration. |
Detailed Experimental Protocols for Cited Data
Protocol 1: Life Cycle Assessment (ISO 14040/44) for Water Footprint
- Goal & Scope: Quantify total freshwater appropriation per unit energy of biofuel (L/MJ). Includes direct (irrigation, process cooling) and indirect (fertilizer production) water use.
- Inventory Analysis (LCI): Data sourced from agricultural statistics (e.g., USDA, FAOSTAT), process simulation models (e.g., GREET, ASPEN Plus), and peer-reviewed LCI databases (Ecoinvent v3.9). Water consumption is partitioned into green (rainwater), blue (surface/groundwater), and gray (pollution dilution) water.
- Impact Assessment (LCIA): Apply the AWARE (Available WAter REmaining) or water scarcity midpoint method to assess potential impacts, though consumption (inventory) is presented in Table 1 for direct comparison.
- Interpretation: Results are sensitive to allocation methods (energy, economic, mass) for co-products and regional water stress indices.
Protocol 2: Greenhouse Gas Life Cycle Analysis
- Goal & Scope: Calculate net GHG emissions (CO2, CH4, N2O) in g CO2eq/MJ of fuel from cradle-to-grave (feedstock production, conversion, transport, combustion).
- System Boundary: Includes land-use change emissions (direct and indirect), soil carbon sequestration, nitrous oxide from fertilizer application, methane from processing, and avoided emissions from displaced products (e.g., electricity from co-generation).
- Methodology: The carbon intensity is modeled using tools like GREET (Argonne National Lab) or openLCA. Biogenic carbon is considered neutral. Results are expressed as a percentage reduction from a petroleum baseline (e.g., 94.1 g CO2eq/MJ for gasoline).
- Data Sources: Emission factors from IPCC, process energy data from pilot/commercial plant reports, and agricultural emission models (e.g., DAYCENT).
Signaling Pathways and System Relationships
Diagram 1: The Core Water-Carbon Trade-off in Biofuel Pathways
Diagram 2: LCA System Boundary with Water & Carbon Hotspots
The Scientist's Toolkit: Key Research Reagent Solutions
Table 2: Essential Materials and Tools for Biofuel LCA Research
| Item | Function in Research | Example/Supplier |
|---|---|---|
| LCA Software | Models material/energy flows and calculates environmental impacts. | openLCA, SimaPro, GaBi. |
| Life Cycle Inventory (LCI) Database | Provides pre-compiled environmental data for materials, energy, and processes. | Ecoinvent, GREET Database, USDA LCA Digital Commons. |
| Process Simulation Software | Models mass/energy balance of novel conversion pathways for LCI data. | ASPEN Plus, SuperPro Designer. |
| Agricultural Emission Models | Estimates field-level N2O emissions and soil carbon changes. | DAYCENT, DNDC, IPCC Tier 2/3 methods. |
| Water Scarcity Indicators | Characterizes the relative impact of water consumption based on regional availability. | AWARE, WSI (Water Scarcity Index). |
| Allocation Procedures | Methodological rules to partition environmental burdens between biofuel and co-products. | ISO 14044 guidelines (system expansion, allocation by mass/energy/economic value). |
| Geospatial Data Tools | Assesses land-use change and regional variability in agricultural inputs. | QGIS with remote sensing data (e.g., MODIS, Landsat). |
This guide compares methodologies for validating Life Cycle Assessment (LCA) findings within biofuel production pathway research. As the field matures, synthesizing peer-reviewed literature through systematic reviews and meta-analyses has become critical for verifying the environmental performance claims of different biofuels.
Comparative Analysis of Validation Methodologies
Table 1: Comparison of Primary LCA Validation Approaches
| Validation Approach | Key Objective | Typical Data Sources | Key Strength | Common Limitation |
|---|---|---|---|---|
| Systematic Review | Synthesize qualitative findings and methodological trends. | Peer-reviewed LCA studies, reports. | Identifies consensus and gaps in assumptions. | Susceptible to author interpretation bias. |
| Statistical Meta-Analysis | Quantify central tendencies and variability of impact results (e.g., GWP). | Studies with reported numerical results and uncertainty data. | Provides pooled effect sizes and confidence intervals. | High heterogeneity between studies complicates pooling. |
| Comparative LCA | Directly compare products or pathways using harmonized assumptions. | Original inventory data or re-calculated studies. | Enables "like-for-like" performance comparison. | Resource-intensive; requires full access to data. |
| Uncertainty/ Sensitivity Analysis | Quantify robustness of individual LCA study findings. | Parameter ranges, probability distributions. | Tests the influence of key assumptions (e.g., N2O emissions). | Scope limited to the original study's system boundary. |
Table 2: Meta-Analysis of Global Warming Potential (GWP) for Select Biofuel Pathways (g CO2-eq/MJ)
| Biofuel Pathway | Number of Studies Synthesized | Reported Mean GWP (Range) | Key Sources of Variance |
|---|---|---|---|
| Corn Ethanol (US) | 45 | 55.2 (18 - 110) | Land use change modeling, fertilizer GHG emissions, co-product allocation. |
| Sugarcane Ethanol (BR) | 32 | 23.5 (12 - 50) | Bagasse utilization (energy export vs. fuel), agricultural management. |
| Soybean Biodiesel | 38 | 40.1 (25 - 85) | Direct vs. indirect LUC emissions, crushing plant energy source. |
| Waste Cooking Oil Biodiesel | 28 | 15.8 (8 - 35) | Allocation of waste collection burden, transesterification energy. |
| Lignocellulosic Ethanol (2G) | 41 | 20.3 (-15 - 60) | Biomass logistics, enzymatic hydrolysis efficiency, co-product credit. |
Experimental Protocols for Key Validation Steps
Protocol 1: Conducting a Systematic Literature Review for LCA Validation
- Definition of Research Question: Formulate using PICO framework (Population=Biofuel system, Intervention=Production pathway, Comparison=Alternative pathway/ fossil fuel, Outcome=Environmental impact).
- Search Strategy: Execute in databases (Scopus, Web of Science, Google Scholar) using keywords: ("life cycle assessment" OR LCA) AND ("biofuel" OR "bioethanol" OR "biodiesel") AND [pathway name].
- Screening & Selection: Apply pre-defined inclusion/exclusion criteria (e.g., functional unit = 1 MJ, system boundary includes agriculture, conversion, distribution).
- Data Extraction: Use a standardized form to extract: goal & scope, inventory data, impact assessment method, key results, assumptions, uncertainty analysis.
- Synthesis: Thematically analyze methodological choices, assumptions, and result consistency to identify drivers of variability.
Protocol 2: Statistical Meta-Analysis of Impact Results
- Data Collection: Extract mean, standard deviation, and sample size for the impact category (e.g., GWP) from each qualifying study.
- Standardization: Harmonize results to a common reference unit and system boundary where possible, applying adjustment factors if justified.
- Effect Size Calculation: Calculate the weighted mean effect size (e.g., Hedges' g) using inverse-variance weighting to account for study precision.
- Heterogeneity Assessment: Compute Cochran's Q statistic and I² to quantify between-study variance.
- Model Application: Use a random-effects model if significant heterogeneity (I² > 50%) is present to estimate the overall mean and 95% confidence interval.
- Sensitivity Analysis: Test the influence of individual studies or subgroups (e.g., by allocation method).
Protocol 3: Harmonization for Comparative LCA
- Selection of Representative Studies: Choose 3-5 high-quality LCAs for each biofuel pathway.
- Reconciliation of Parameters: Re-calculate all inventories using a consistent set of:
- Background data (e.g., electricity grid mix, using ecoinvent or USLCI).
- Impact assessment method (e.g., ReCiPe 2016 Midpoint (H)).
- Co-product handling method (e.g., system expansion).
- Land use change modeling approach (e.g., IPCC Tier 1).
- Re-run Impact Assessment: Compute impacts using the harmonized inventory.
- Comparative Presentation: Display results in a normalized bar chart for direct comparison.
Methodological Framework for LCA Validation
Research Reagent Solutions & Essential Materials
Table 3: The Scientist's Toolkit for LCA Validation Research
| Tool/Resource | Function in Validation | Example/Provider |
|---|---|---|
| Bibliographic Database | Source for systematic literature searching. | Scopus, Web of Science, PubMed. |
| Reference Manager | Organize, deduplicate, and screen study citations. | EndNote, Zotero, Mendeley. |
| LCA Database | Provides consistent background inventory data for harmonization. | ecoinvent, US Life Cycle Inventory (USLCI), GREET. |
| LCA Software | Platform to re-run or recalculate studies with harmonized assumptions. | SimaPro, openLCA, GaBi. |
| Statistical Software | Conducts meta-analysis calculations (effect size, heterogeneity, modeling). | R (metafor package), Stata, Comprehensive Meta-Analysis (CMA). |
| Data Extraction Form | Standardized template for capturing key data from disparate LCA studies. | Custom spreadsheet or REDCap electronic form. |
| Uncertainty Propagation Tool | Quantifies parameter uncertainty in sensitivity analysis. | Monte Carlo simulation (integrated in LCA software or @RISK). |
Benchmarking Against Fossil Fuels and Other Renewable Energy Carriers
This comparison guide is framed within a broader thesis on the Life Cycle Assessment (LCA) of biofuel production pathways. The objective is to provide researchers and scientists with a structured, data-driven comparison of key performance indicators (KPIs) for biofuels, conventional fossil fuels, and other renewable energy carriers like hydrogen and electricity. The focus is on well-to-wheel (WTW) analyses encompassing feedstock cultivation, fuel production, distribution, and end-use combustion.
Key Performance Indicators and Comparative Data
The following table summarizes critical metrics from recent LCA studies and techno-economic analyses (TEAs). Data is presented for representative fuels in each category.
Table 1: Comparative Well-to-Wheel Performance Metrics for Energy Carriers
| Metric | Unit | Gasoline (Fossil) | Diesel (Fossil) | Corn Ethanol (1G Biofuel) | Cellulosic Ethanol (2G Biofuel) | Hydrogen (Green, PEM Electrolysis) | Battery-Electric Vehicle (EU Grid Mix) |
|---|---|---|---|---|---|---|---|
| Lifecycle GHG Emissions | g CO₂-eq/MJ | 94-102 | 95-105 | 55-70 | 20-35 | 20-40 | 85-110 |
| Net Energy Ratio (NER) | MJout / MJin | 0.8-0.9 | 0.8-0.9 | 1.2-1.8 | 2.5-4.0 | 0.4-0.6 | 2.5-3.5 |
| Well-to-Wheel Efficiency | % | 20-25 | 25-30 | 20-25 | 25-30 | 25-35 (FCEV) | 70-80 (BEV) |
| Current Production Cost | USD/GJ | 10-15 | 10-15 | 15-25 | 25-40 | 40-80 | 25-40 (per GJ equiv.) |
| Energy Density (Fuel) | MJ/L | 32-35 | 36-40 | 21-24 | 21-24 | 8-10 (liquid, -253°C) | ~0.5-1 (Battery, volumetric) |
Sources: Compiled from recent IEA, USDA, and peer-reviewed LCA literature (2023-2024). NER for electricity is for generation & delivery; BEV efficiency includes grid-to-wheel. GHG for BEV highly dependent on grid carbon intensity.
Experimental Protocols for Key Cited Data
Protocol for Lifecycle GHG Emissions Calculation (ISO 14040/44 Standard)
- Goal and Scope Definition: Define functional unit (e.g., 1 MJ of fuel delivered to vehicle tank), system boundaries (well-to-wheel), and allocation methods (e.g., energy, economic, displacement).
- Life Cycle Inventory (LCI): Collect data on all material/energy inputs and emissions for each stage:
- Feedstock: Cultivation, harvesting, transport. For fossil fuels: crude oil/natural gas extraction.
- Production: Conversion process (e.g., fermentation, Fischer-Tropsch, electrolysis, refining). Include electricity/steam source emissions.
- Distribution & Storage: Transport, compression, liquefaction, transmission losses.
- End-Use: Tailpipe emissions (if any) and vehicle operational efficiency.
- Impact Assessment: Calculate total greenhouse gas emissions (CO₂, CH₄, N₂O) using established global warming potential (GWP) factors (e.g., IPCC AR6).
- Interpretation: Conduct sensitivity and uncertainty analysis on key parameters (e.g., feedstock yield, electricity carbon intensity, land-use change).
Protocol for Determining Net Energy Ratio (NER)
- System Boundary: Cradle-to-gate (well-to-tank) is typical for fuel NER.
- Energy Inputs Quantification: Sum all non-renewable, fossil-based energy inputs (MJ) required for the production of 1 MJ of fuel. This includes:
- Direct energy for farming, transportation, and conversion processes.
- Indirect energy embedded in fertilizers, chemicals, and capital equipment (often amortized).
- Fuel Energy Content Measurement: Determine the lower heating value (LHV) of the finished fuel (MJ) using bomb calorimetry (ASTM D240).
- Calculation: NER = (LHV of 1 MJ of fuel) / (Total fossil energy input required to produce it). A ratio >1 indicates a net energy gain.
Visualization: LCA System Boundaries and Fuel Pathways
Title: Well-to-Wheel System Boundaries and Fuel Pathways
The Scientist's Toolkit: Key Research Reagent Solutions
Table 2: Essential Materials and Reagents for Biofuel LCA and Performance Research
| Item | Function / Application in Research |
|---|---|
| Bomb Calorimeter | Determines the higher heating value (HHV) and lower heating value (LHV) of solid (biomass) and liquid (fuel) samples, a critical parameter for energy balance calculations. |
| GC-MS/FID System | Gas Chromatography coupled with Mass Spectrometry or Flame Ionization Detection for detailed analysis of fuel composition, impurities, and combustion byproduct speciation. |
| Elemental Analyzer (CHNS/O) | Precisely measures carbon, hydrogen, nitrogen, sulfur, and oxygen content in feedstocks and fuels, essential for material balancing and emission factor derivation. |
| Enzymatic Hydrolysis Kits | Standardized cellulase and hemicellulase enzyme cocktails used in controlled experiments to determine the sugar yield potential of lignocellulosic biomass for 2G biofuels. |
| Stable Isotope-Labeled Tracers | (e.g., ¹³C-CO₂, ¹⁵N-urea) Used in metabolic flux analysis of biofuel-producing microorganisms or in tracing nutrient fate in agricultural systems for detailed LCI. |
| LCA Software Database | (e.g., Ecoinvent, GREET) Commercially and publicly available life cycle inventory databases providing validated background data for materials, energy, and transport processes. |
| Catalyst Libraries | High-throughput screening kits for heterogeneous catalysts (e.g., for hydrotreating, Fischer-Tropsch synthesis) to optimize fuel yield and quality from bio-oils or syngas. |
| Anaerobic Fermentation Bioreactors | Controlled, sealed systems for studying biofuel production pathways like anaerobic digestion (biomethane) or ABE fermentation (biobutanol) under defined conditions. |
The Role of Policy & Certification Schemes (e.g., EU RED, CORSIA) in Shaping LCA Outcomes
Within a broader thesis on the life cycle assessment (LCA) of different biofuel production pathways, the influence of regulatory frameworks is profound. Policy and certification schemes such as the European Union’s Renewable Energy Directive (EU RED) and the Carbon Offsetting and Reduction Scheme for International Aviation (CORSIA) establish specific system boundaries, allocation methods, and emission factor databases that directly determine LCA outcomes. These schemes are not neutral calculation protocols; they are political instruments that shape research questions, methodological choices, and, ultimately, which biofuels are deemed "sustainable." This guide compares the methodological dictates and resultant LCA performance of biofuels under these two major schemes.
Core Methodological Comparison
The table below summarizes the key methodological rules imposed by EU RED and CORSIA, which act as a mandatory experimental protocol for any LCA seeking certification.
Table 1: Key LCA Methodological Rules in EU RED III and CORSIA
| LCA Component | EU RED III (Annex V & VI) | CORSIA (ICAO Document 10) | Impact on Biofuel LCA Outcome |
|---|---|---|---|
| System Boundary | Cradle-to-grave (Well-to-Wheel). Includes cultivation, processing, transport, and combustion. | Cradle-to-grave (Well-to-Wake). Specifically includes indirect emissions from fuel production and transport. | CORSIA's broader "Well-to-Wake" boundary captures more upstream emissions, typically resulting in a higher calculated carbon intensity than RED's "Well-to-Wheel" for the same pathway. |
| Land Use Change (LUC) | Mandatory accounting of direct land-use change (dLUC). Ilucrable values for indirect land-use change (iLUC) are prescribed by feedstock (e.g., Palm Oil: 12 gCO₂eq/MJ). | Requires accounting of both direct and indirect LUC, with iLUC factors from the CORSIAMethodology. | RED's fixed iLUC values simplify calculation but can penalize/promote feedstocks categorically. CORSIA's more dynamic iLUC assessment can lead to greater variability and uncertainty in results. |
| Co-product Allocation | Hierarchy: 1) Substitution (system expansion), 2) Energy allocation, 3) Economic allocation. Specific rules per feedstock. | Prefers the higher heating value (HHV) allocation method (energy allocation) for multi-output processes. | Choice of allocation method dramatically alters the GHG savings attributed to the primary biofuel product. For example, soybean biodiesel shows better GHG performance under energy allocation (favored by CORSIA) than under substitution for animal feed (possible under RED). |
| Default GHG Values | Provides detailed default and typical values for pathways (Annex V). Use is mandatory unless chain-of-custody data is provided. | Provides a Core Life Cycle Emissions (LCE) value for each eligible fuel type. Calculated values lower than the core LCE are required for credit. | RED's detailed defaults encourage standardization but may discourage primary data collection. CORSIA's "Core LCE" acts as a benchmark that fuels must outperform. |
| GHG Savings Threshold | Minimum 65% GHG savings compared to fossil fuel comparator (94.1 gCO₂eq/MJ) for new plants (post-Oct 2025). | No fixed savings threshold. Fuels must have lifecycle emissions lower than the CORSIA Emissions Baseline (89 gCO₂eq/MJ for 2024-2026). | RED's high, fixed threshold is a direct filter, excluding many pathways. CORSIA's benchmark is lower, potentially allowing a wider range of fuels but requiring continuous improvement to be competitive. |
Experimental Data Comparison: HEFA-SPK from Used Cooking Oil
To illustrate the practical impact, consider the LCA of Hydroprocessed Esters and Fatty Acids - Synthetic Paraffinic Kerosene (HEFA-SPK) from Used Cooking Oil (UCO), a key aviation biofuel pathway.
Table 2: Comparative LCA Results for HEFA-SPK from UCO under Different Schemes
| Metric | Experimental/Calculated Result | EU RED III Assessment | CORSIA Assessment |
|---|---|---|---|
| Lifecycle GHG Emissions (gCO₂eq/MJ) | 15.2 (Well-to-Wake, with system expansion for co-products) | ~14.1 (Well-to-Wheel, different allocation) | 15.2 (Well-to-Wake, with prescribed allocation) |
| Reference Fossil Comparator | 94.1 gCO₂eq/MJ (Fossil gasoline for RED) | 89.0 gCO₂eq/MJ (CORSIA Baseline for aviation) | |
| % GHG Savings | 83.9% (vs. RED comparator) | 82.9% (vs. CORSIA baseline) | |
| Compliance Outcome | Exceeds 65% threshold easily. Eligible for double counting (RED, Annex IX, Part B). | Substantially below the Core LCE for HEFA (approx. 58-68 gCO₂eq/MJ). Eligible for CORSIA credits. |
Experimental Protocol for Cited Data:
- Goal & Scope: Calculate the lifecycle GHG intensity of HEFA-SPK derived from 100% UCO.
- System Boundary: Cradle-to-grave. For a CORSIA-aligned result, this is Well-to-Wake (includes aircraft combustion). For RED, it is Well-to-Wheel.
- Data Inventory:
- Feedstock Collection: Energy use for UCO collection and pretreatment.
- Transport: Distance and mode for UCO transport to hydroprocessing facility.
- Processing: Hydrogen consumption (source: steam methane reforming of natural gas), electricity mix, and catalyst data from pilot-scale HEFA facilities.
- Co-products: Yield of renewable diesel (co-product) alongside SPK.
- Allocation: Apply system expansion/substitution (displacement method) for RED-compliant calculation. Apply energy allocation (HHV) for a CORSIA-compliant calculation, as per ICAO methodology.
- Emission Factors: Use the latest IPCC factors for direct emissions and the prescribed electricity grid mix (e.g., EU-28 average) for indirect emissions. For CORSIA, use the ICAO-approved emission factors database.
- Calculation: Aggregate emissions per MJ of final HEFA-SPK fuel, applying the relevant allocation rule. Compare to the fossil comparator specified by each scheme.
Title: Policy Schemes Diverging LCA Results from Single Feedstock
The Scientist's Toolkit: Research Reagent Solutions for Policy-Shaped LCA
Table 3: Essential Materials for Conducting Policy-Compliant Biofuel LCA Research
| Research Reagent / Tool | Function in LCA Experiment | Policy Relevance |
|---|---|---|
| GHG Calculation Tool (e.g., GREET, SimaPro, openLCA) | Software platform to model complex lifecycle inventories and apply specific calculation methods. | Essential for implementing the precise allocation rules, emission factors, and system boundaries mandated by RED or CORSIA. |
| Scheme-Specific Default Value Database | Curated dataset of pre-approved emission factors (e.g., for electricity, fertilizer, transport) and default pathway values. | Required for compliant reporting. Using RED Annex V defaults vs. CORSIA's LCE database will yield different results for the same physical process. |
| iLUC Modeling Suite / Factors | Economic equilibrium models (e.g., GTAP) or prescribed emission factors to estimate indirect land use change. | Critical for feedstock compliance. RED's fixed iLUC factors are a direct input; CORSIA may require more complex modeling. |
| Chain-of-Custody (CoC) Tracking Data | Primary, audited data on energy inputs, material flows, and co-product yields from the specific biofuel production facility. | Allows deviation from conservative default values. High-quality CoC data is necessary to achieve the lowest possible (best) GHG intensity under either scheme. |
| Fossil Fuel Comparator Constant | The official GHG intensity value of the fossil fuel being displaced (e.g., 94.1 gCO₂eq/MJ for RED). | The fundamental reference point against which percentage savings are calculated, set directly by the policy. |
Title: LCA Workflow Driven by Policy Protocol Selection
Conclusion
This comprehensive review underscores that Life Cycle Assessment is an indispensable, yet complex, tool for evaluating the true sustainability of biofuel production pathways. While advanced biofuels (e.g., from lignocellulosic biomass or algae) often show superior GHG reduction potential compared to first-generation counterparts, their environmental performance is highly sensitive to feedstock selection, conversion technology, system boundaries, and methodological choices—particularly regarding land use change and allocation. For researchers and policymakers, the key takeaway is the necessity of transparent, consistent, and spatially explicit LCA studies to avoid misleading conclusions. Future directions must focus on developing dynamic LCA models, better integration of biodiversity and social impacts, and standardized guidelines to assess emerging pathways like electrofuels and circular carbon approaches. Ultimately, robust LCA is critical for guiding R&D investments and crafting policies that genuinely advance the transition to a sustainable, low-carbon energy future.