FACS Biosensors: Next-Generation Tools for Real-Time Cellular Analysis and High-Throughput Screening
This article provides a comprehensive guide to Fluorescence-Activated Cell Sorting (FACS) biosensors for biomedical researchers.
FACS Biosensors: Next-Generation Tools for Real-Time Cellular Analysis and High-Throughput Screening
Abstract
This article provides a comprehensive guide to Fluorescence-Activated Cell Sorting (FACS) biosensors for biomedical researchers. We explore the foundational principles of genetically-encoded and chemical biosensors compatible with FACS, detailing their design and mechanisms. The core of the article presents practical methodologies for biosensor integration into FACS workflows, including assay development and applications in drug discovery, immunology, and synthetic biology. We address common technical challenges and optimization strategies for signal-to-noise ratio, dynamic range, and sorting fidelity. Finally, we compare FACS biosensor approaches to alternative technologies and discuss validation frameworks to ensure data reliability. This resource equips scientists to leverage FACS biosensors for advanced, high-content functional screening.
What Are FACS Biosensors? Core Principles and Sensor Architectures
Flow Cytometry has evolved from a tool for quantifying static surface markers into a dynamic platform for measuring real-time cellular function. This evolution is driven by FACS biosensors—molecular probes that convert intracellular biochemical activity into a quantifiable fluorescent signal sortable at high speed. This document provides application notes and protocols for implementing functional biosensors within a broader FACS-based research thesis.
Application Notes: Key Biosensor Classes & Quantitative Data
Functional biosensors are broadly categorized by their target signaling process. The following table summarizes core biosensor classes, their readouts, and key performance metrics.
Table 1: Core Classes of Functional FACS Biosensors
| Biosensor Class | Measured Function | Typical Design | Dynamic Range (Fold-Change) | Temporal Resolution | Primary Application in Drug Screening |
|---|---|---|---|---|---|
| FRET-Based Kinase | Kinase activity (e.g., PKA, ERK, Akt) | Donor/acceptor FP linked by kinase substrate | 1.5 - 3.0 | Minutes to Hours | Pathway inhibition/activation by targeted therapies |
| Transcription Factor (TF) Reporters | TF activation (e.g., NF-κB, NFAT, STAT) | Response element driving FP | 10 - 100+ | Hours | Immunomodulator screening, cytokine signaling |
| Caspase Activity | Apoptosis induction | FRET pair separated by caspase cleavage site | 2.0 - 5.0 (loss of FRET) | 1-4 Hours | Efficacy of chemotherapeutics, on-target toxicity |
| GEVIs (Genetically Encoded Voltage Indicators) | Membrane potential | Voltage-sensitive domain fused to FP | 2-10% ΔF/F per 100mV | Milliseconds | Cardiotoxicity, neuronal function screening |
| Calcium Indicators | Intracellular Ca2+ flux | Calmodulin/M13 domain fused to FP (e.g., GCaMP) | 5 - 20 | Seconds to Minutes | GPCR functional activity, T-cell activation |
| Redox Sensors | ROS (e.g., H2O2, glutathione) | Redox-sensitive cysteines in roGFP | 2.0 - 4.0 (ratiometric) | Minutes | Oxidative stress induced by therapies |
Detailed Experimental Protocols
Protocol 1: FRET-Based ERK Kinase Activity Biosensor Assay
Objective: To quantify ERK pathway modulation by MEK inhibitors in live cells via FACS. Reagents: pCAG-EKAREV-NLS plasmid (FRET-based ERK biosensor), HEK293T or relevant cancer cell line, Lipofectamine 3000, FBS-free medium, PD0325901 (MEK inhibitor), Phorbol 12-myristate 13-acetate (PMA, activator), 1x PBS.
Procedure:
- Cell Preparation & Transfection: Seed 5 x 10^5 cells per well in a 6-well plate. After 24h, transfert with 2.5 µg of EKAREV plasmid using Lipofectamine 3000 per manufacturer's protocol.
- Biosensor Expression: Incubate transfected cells for 24-48h at 37°C, 5% CO2.
- Stimulation & Inhibition:
- Prepare two sets of cells: one for inhibitor (10 µM PD0325901 in serum-free medium, 2h pre-treatment) and one for vehicle control (DMSO).
- Stimulate both sets with 100 nM PMA for 30 minutes.
- FACS Analysis & Sorting:
- Harvest cells with gentle trypsin, quench with complete medium, and resuspend in FACS buffer (PBS + 2% FBS).
- Analyze on a flow cytometer equipped with 405nm, 488nm, and 561nm lasers.
- FRET Ratio Calculation: Use 405nm excitation, collect emissions at 525/50nm (donor, mCerulean) and 585/29nm (acceptor, Venus). Calculate the ratiometric FRET (Venus/mCerulean) for each cell.
- Gating & Sorting: Gate on live, single cells. Sort the top and bottom 10% of FRET ratio populations for downstream transcriptomic analysis.
Protocol 2: NF-κB Transcriptional Reporter Assay for Drug Screening
Objective: To identify modulators of inflammatory signaling in a pooled format. Reagents: Lentiviral NF-κB-RE-GFP reporter construct, Target cells (e.g., THP-1), Polybrene (8 µg/mL), TNFα, Test compound library, Puromycin. Procedure:
- Stable Cell Line Generation: Transduce target cells with NF-κB reporter lentivirus in the presence of Polybrene via spinfection (2000 x g, 90 min, 32°C). Select with 2 µg/mL puromycin for 7 days.
- Validation: Treat an aliquot with 20 ng/mL TNFα for 6h. >50% of cells should be GFP+ by FACS.
- Pooled Compound Screening:
- Seed stable cells at 5,000 cells/well in 384-well plates containing test compounds (10 µM final concentration). Include TNFα (20 ng/mL) controls and DMSO controls.
- Incubate for 16h.
- Add DAPI (1 µg/mL) live-dead stain, and analyze on a high-throughput sampler (HTS) flow cytometer.
- Analysis: Gate on live (DAPI-) cells. Quantify the geometric mean fluorescence intensity (gMFI) of GFP and the %GFP+ cells.
- Hit Identification: Compounds causing a >3 SD shift in gMFI from the DMSO+TNFα control are considered hits for inhibition (or activation in absence of TNFα).
The Scientist's Toolkit: Essential Research Reagents
Table 2: Key Reagent Solutions for FACS Biosensor Research
| Reagent / Material | Function & Rationale |
|---|---|
| Genetically-Encoded Biosensor Plasmids (e.g., EKAREV, GCaMP6f, roGFP2-Orp1) | Core molecular tool. Lentiviral versions enable stable cell line generation for consistent assays. |
| Lipofectamine 3000 / JetOPTIMUS | High-efficiency transfection reagents for hard-to-transfect primary or suspension cells. |
| FACS Buffer (PBS + 2% FBS + 1mM EDTA) | Maintains cell viability, prevents clumping, and reduces non-specific binding during sort. |
| DAPI or Propidium Iodide (PI) | Vital DNA dye for excluding dead cells from analysis, critical for accurate functional readouts. |
| Pharmacologic Agonists/Antagonists (e.g., PMA, Ionomycin, Staurosporine, specific kinase inhibitors) | System controls for validating biosensor response and specificity. |
| CellTrace Violet / CFSE | Proliferation dyes for tracking cell divisions in parallel with functional biosensor readouts. |
| BD Cytofix/Cytoperm Buffer | Optional fixation post-sort for intracellular staining of downstream markers while retaining biosensor signal (for some FPs). |
| High-Speed Cell Sorter with 4+ Lasers & 405nm Violet Laser | Essential hardware. Enables ratiometric FRET measurements and multi-parameter analysis. |
Pathway & Workflow Visualizations
Diagram 1: Signaling to FACS Readout Pathways
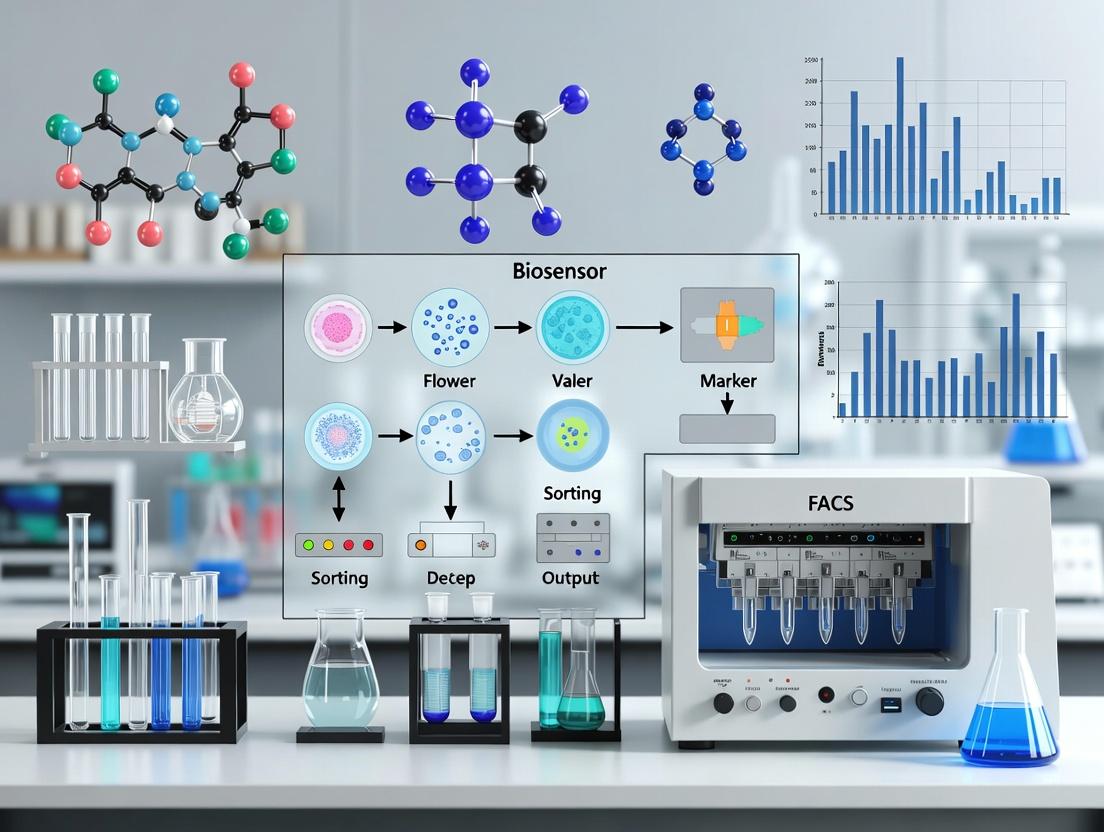
Diagram 2: FACS Biosensor Experimental Workflow
Application Notes
Fluorescent biosensors for Fluorescence-Activated Cell Sorting (FACS) represent a transformative tool in functional cell biology and drug discovery. By genetically encoding a fluorescent protein whose emission is modulated by a specific cellular activity—such as kinase activity, second messenger concentration, or metabolite levels—researchers can move beyond static, surface-marker-based sorting to isolate live cells based on their dynamic functional state. This enables the identification of rare cell populations with aberrant signaling in disease models, the screening for genetic modifiers of pathways, and the isolation of cells responding to drug candidates in a high-throughput manner. The core advantage lies in the direct, quantitative, and sortable link between a molecular event and a fluorescent signal, allowing for the enrichment of cells based on biochemical function.
Key Quantitative Performance Metrics
The efficacy of a FACS biosensor experiment is defined by several key parameters. The table below summarizes critical metrics for evaluation.
Table 1: Key Performance Metrics for FACS Biosensor Experiments
| Metric | Definition | Typical Target/Example Values | Impact on Sorting |
|---|---|---|---|
| Dynamic Range (R) | Ratio of fluorescence intensity in the fully active (ON) state to the inactive (OFF) state. | 2-fold to >10-fold (e.g., 5.0 for a high-performance Ca²⁺ sensor) | Higher R enables clearer separation of positive and negative populations. |
| Brightness | Product of the extinction coefficient and quantum yield of the biosensor. | Varies widely; e.g., EGFP: ~34,000 M⁻¹cm⁻¹ * 0.60 QY. | Higher brightness improves signal-to-noise, crucial for detecting low-abundance targets. |
| Response Time (τ) | Time required for the biosensor to reach half-maximal response after stimulus. | ms (Ca²⁺, voltage) to minutes (transcription-based reporters). | Determines suitability for sorting rapid kinetic events. |
| Z'-Factor | Statistical parameter for assay quality in HTS; assesses separation band and data variability. | Z' > 0.5 is acceptable for screening; >0.7 is excellent. | High Z' indicates robust population separation, enabling reliable sorting gates. |
| Photostability | Resistance to photobleaching under laser illumination. | Half-life of fluorescence under defined illumination. | Critical for maintaining signal integrity during extended sorting sessions. |
| Cellular Perturbation | Degree to which the biosensor affects the native cellular process it measures. | Minimized via optimization of expression level and targeting. | High perturbation reduces physiological relevance. |
Experimental Protocols
Protocol 1: Lentiviral Transduction & Stable Cell Line Generation for Biosensor Expression
Objective: To generate a homogeneous, stably expressing cell population for consistent FACS biosensor assays.
Materials:
- Biosensor lentiviral construct (e.g., in FUW or pLVX backbone)
- 293T packaging cells
- Polyethylenimine (PEI) transfection reagent
- Target cell line (e.g., HEK293, primary T cells)
- Polybrene (for non-adherent/slowly dividing cells)
- Puromycin or appropriate selection antibiotic
Procedure:
- Day 1: Seed 293T cells in a 6-well plate to reach 70-80% confluency the next day.
- Day 2: Transfect using PEI. For one well, mix 1.5 µg of biosensor plasmid, 1.0 µg of psPAX2 (packaging), and 0.5 µg of pMD2.G (VSV-G envelope) in 150 µL Opti-MEM. Add 9 µL of 1 mg/mL PEI, vortex, incubate 15 min, then add dropwise to cells.
- Day 3 & 4: Replace medium with fresh complete growth medium. Harvest viral supernatant at 48h and 72h post-transfection, pool, filter through a 0.45 µm filter, and either use immediately or aliquot and store at -80°C.
- Transduction: Plate target cells in a 24-well plate. Add viral supernatant (diluted 1:1-1:4 with fresh medium) and 4-8 µg/mL polybrene. Centrifuge at 800 x g for 30 min at 32°C (spinoculation) to enhance infection.
- Selection: 48h post-transduction, begin selection with the appropriate antibiotic (e.g., 1-2 µg/mL puromycin). Maintain selection for 5-7 days until all cells in an untransduced control well are dead.
- Validation: Confirm biosensor expression and functionality via fluorescence microscopy and flow cytometry before sorting experiments.
Protocol 2: FACS-Based Sorting of Cells Based on Real-Time Kinase Activity
Objective: To isolate live cells exhibiting high or low activity of a specific kinase (e.g., PKA, ERK) using a FRET-based biosensor.
Materials:
- Stable cell line expressing a FRET-based kinase biosensor (e.g., AKAR for PKA)
- Stimuli/inhibitors (e.g., Forskolin/IBMX for PKA activation; H-89 for inhibition)
- FACS buffer: PBS (Ca²⁺/Mg²⁺ free) + 2% FBS + 25 mM HEPES
- Cell dissociation reagent (e.g., TrypLE, Accutase)
- 5 mL FACS tubes with cell strainer caps
- High-speed cell sorter equipped with 405nm, 488nm, and 561nm lasers and appropriate filters (e.g., 530/30 BP for CFP, 585/15 BP for YFP FRET).
Procedure:
- Stimulation & Preparation:
- Seed cells in a 6-cm dish 24h prior. On the day, treat cells with desired stimulus or inhibitor for a defined time (e.g., 10 min forskolin/IBMX).
- Gently dissociate cells into a single-cell suspension using TrypLE. Quench with complete medium.
- Centrifuge (300 x g, 5 min), wash once with FACS buffer, and resuspend in 1-2 mL of cold FACS buffer. Keep on ice.
Instrument Setup & Compensation:
- Create a FRET ratio parameter (e.g., YFP/CFP).
- Run unstimulated control cells. Adjust voltages so the CFP and YFP signals are on-scale.
- Using single-color controls (CFP-only, YFP-only cells), set fluorescence compensation to eliminate spectral bleed-through.
Gating and Sorting Strategy:
- Create a dot plot of FSC-A vs. SSC-A. Gate on the main population of live, single cells (P1).
- From P1, create FSC-H vs. FSC-W to gate on singlets (P2).
- From P2, display CFP vs. YFP fluorescence. Create a new plot of the FRET ratio (YFP/CFP) vs. cell count.
- Run the stimulated control sample. The FRET ratio histogram will shift. Define sorting gates: "High Activity" (top 10-20% ratio) and "Low Activity" (bottom 10-20% ratio).
Collection:
- Set up the sorter to sort directly into collection tubes containing recovery medium (e.g., complete medium + 20% FBS).
- Sort the defined populations at a conservative event rate to ensure purity (>90% target purity mode).
- Post-sort, centrifuge collected cells and plate in appropriate medium for downstream analysis (e.g., RNA-seq, functional assays).
Visualization Diagrams
Diagram Title: FRET Biosensor Activation Pathway for FACS
Diagram Title: FACS Biosensor Experiment Workflow
The Scientist's Toolkit: Research Reagent Solutions
Table 2: Essential Materials for FACS Biosensor Research
| Item | Function in Experiment | Example Product/Catalog # (Illustrative) |
|---|---|---|
| Genetically-Encoded Biosensor Plasmid | Core reagent that encodes the fluorescent protein(s) linked to a sensing domain (e.g., kinase substrate, ligand-binding domain). | Addgene: #122040 (AKAR4-NES, PKA sensor), #61556 (GCaMP6f, Ca²⁺ sensor). |
| Lentiviral Packaging Plasmids | Required for producing replication-incompetent lentivirus to stably introduce the biosensor into target cells. | Addgene: #12259 (psPAX2), #12260 (pMD2.G). |
| Polyethylenimine (PEI) Max | High-efficiency, low-cost cationic polymer for transient transfection of packaging cells. | Polysciences: #24765-1. |
| Polybrene (Hexadimethrine Bromide) | A cationic polymer that enhances viral transduction efficiency by neutralizing charge repulsion. | Sigma-Aldrich: #H9268. |
| Puromycin Dihydrochloride | Selection antibiotic for mammalian cells. Cells expressing a puromycin resistance gene (common in lentiviral vectors) survive. | Thermo Fisher: #A1113803. |
| Cell Dissociation Reagent (Enzyme-Free) | Gentle detachment agent to create high-viability single-cell suspensions for sorting, preserving biosensor integrity. | Gibco TrypLE Express Enzyme. |
| FACS Buffer (Sterile) | Ice-cold, protein-supplemented, buffered saline to maintain cell viability and prevent clumping during sorting. | DIY: 1x PBS (no Ca²⁺/Mg²⁺), 2% FBS, 25 mM HEPES, 1 mM EDTA (optional). |
| Validated Pathway Modulators | Pharmacological tools to activate or inhibit the target pathway for establishing biosensor dynamic range and controls. | e.g., Forskolin (PKA activator, Tocris #1099), H-89 (PKA inhibitor, Tocris #2910). |
| Compensation Beads | Antibody-capture beads used to set up accurate spectral compensation on the flow cytometer, critical for ratiometric measurements. | Thermo Fisher UltraComp eBeads. |
Application Notes for FACS-Based Biosensor Research
Biosensors engineered from genetically-encoded components are pivotal tools in modern cell biology and drug discovery, particularly when coupled with Fluorescence Activated Cell Sorting (FACS). This technology enables the isolation of rare cell populations based on dynamic physiological responses, facilitating high-throughput screening and deep mechanistic studies.
Genetically-Encoded FRET Biosensors
FRET (Förster Resonance Energy Transfer) biosensors consist of a sensing domain flanked by two fluorescent proteins (donor and acceptor). Conformational changes upon analyte binding or modification alter the distance/orientation between the fluorophores, changing FRET efficiency. FACS can sort cells based on donor/acceptor emission ratios, reporting real-time activity of kinases, proteases, or second messengers.
Key Quantitative Parameters for FACS Gating:
| Parameter | Typical Range/Value | Impact on FACS |
|---|---|---|
| Dynamic Range (ΔR/R0) | 10% - 500% | Determines sort window resolution. |
| Brightness (Donor Mature FP) | >20,000 M⁻¹cm⁻¹ | Critical for signal-to-noise in flow. |
| Response Time (t½) | Seconds to minutes | Dictates incubation/stimulation protocol. |
| Affinity (Kd) | nM to µM range | Must match physiological analyte concentration. |
| Photostability (t½ bleach) | >10 seconds | Essential for prolonged sorting sessions. |
Intein-Based Biosensors
Inteins are "protein introns" that catalyze self-excision and ligation of flanking exteins. Engineered conditional inteins splice only in the presence of a target molecule, leading to the reconstitution of a reporter protein (e.g., GFP). This irreversible switch is ideal for FACS-based selection of cells where a transient event triggers a permanent fluorescent signal.
Performance Metrics for Intein Switches:
| Metric | Specification | FACS Relevance |
|---|---|---|
| Splicing Efficiency | 70-99% | Directly correlates with fluorescence output. |
| Leakiness (Background) | <5% splicing in OFF state | Reduces false-positive sorts. |
| Induction Fold-Change | 10x to >1000x | Enables clear population separation. |
| Activation Kinetics | Hours post-induction | Determines pre-sort incubation time. |
Translocation Biosensors
These biosensors report the movement of a fluorescently tagged protein between cellular compartments (e.g., cytosol to nucleus). FACS quantification requires ratiometric measurement or complementary markers. They are used for studying transcription factor activation, signaling pathway endpoints, or drug-induced relocalization.
Quantifiable Translocation Parameters:
| Parameter | Measurement Method | FACS-Compatible Output |
|---|---|---|
| Nuclear-to-Cytosolic Ratio (N:C) | Image analysis derived; simulated via 2-channel fluorescence. | Ratio of nuclear marker (H2B-mCherry) to cytosolic sensor (FP). |
| Translocation Kinetics | Time-lapse imaging. | Time-point sampling for sort. |
| Population Heterogeneity | Coefficient of Variation (CV) of N:C ratio. | Defines sort gate width. |
Detailed Protocols
Protocol 1: FACS-Based Screening Using a FRET Biosensor for Kinase Activity
Objective: Isolate cell populations with high/low ERK/MAPK activity using the FRET biosensor EKAR. Materials: See Scientist's Toolkit below. Procedure:
- Cell Preparation: Seed HEK293T cells expressing EKAR-EV (optimized variant) at 50% confluency in a 10 cm dish 24h pre-sort.
- Stimulation: Prior to sorting, treat cells with 10% FBS (activation) or 10 µM U0126 MEK inhibitor (inhibition) for 30 minutes. Include an unstimulated control.
- Harvesting: Trypsinize cells, quench with complete medium, pellet, and resuspend in 2 mL of ice-cold PBS + 1% FBS. Keep on ice.
- FACS Instrument Setup: Use a sorter equipped with 405 nm, 488 nm, and 561 nm lasers.
- Excite CFP (donor) with 405 nm laser.
- Detect CFP emission with a 450/50 nm BP filter.
- Detect FRET (YFP acceptor) emission with a 535/30 nm BP filter.
- Create a ratio plot: YFP/CFP vs. forward scatter (FSC-A).
- Gating and Sorting:
- Gate on live, single cells using FSC-A/SSC-A and pulse-width discrimination.
- Display the gated population on the ratio plot.
- Define sort gates: Top 10% (high FRET, inactive ERK) and Bottom 10% (low FRET, active ERK) of the ratio from control cells.
- Sort 50,000 cells from each gate into collection tubes with complete medium.
- Post-Sort Analysis: Re-plate sorted cells for validation via immunoblotting for phosphorylated ERK.
Protocol 2: Selection with a Drug-Inducible Intein Biosensor
Objective: FACS-enrich mammalian cells where a small molecule induces intein splicing, reconstituting GFP. Materials: HEK293 cells expressing a conditional intein-GFP biosensor for rapamycin (detects dimerization). Procedure:
- Induction: Treat biosensor cells with 100 nM rapamycin or DMSO vehicle for 12 hours.
- Preparation for FACS: Harvest cells as in Protocol 1, step 3.
- FACS Setup: Use 488 nm excitation for GFP, detect with 530/30 nm filter.
- Gating:
- Set a fluorescence threshold based on >99.5% of DMSO control cells.
- Sort all events exceeding this threshold as GFP-positive.
- Collection: Sort directly into growth medium for expansion and downstream genomic analysis.
Protocol 3: FACS Analysis of NF-κB Translocation Biosensor
Objective: Quantify TNFα-induced NF-κB nuclear translocation via a two-fluorescence readout. Materials: Cells stably expressing p65(RelA)-mCherry (sensor) and H2B-GFP (nuclear marker). Procedure:
- Stimulation: Treat with 20 ng/mL TNFα for 30 minutes.
- Harvest: As in Protocol 1.
- FACS Setup:
- Excite GFP with 488 nm laser (detect 530/30 nm).
- Excite mCherry with 561 nm laser (detect 610/20 nm).
- Data Analysis Strategy:
- Gate for GFP-positive nuclei (H2B-GFP high).
- Within this gate, analyze mCherry intensity.
- Calculate the median mCherry fluorescence for TNFα-treated vs. untreated populations. An increase indicates nuclear translocation. Note: True spatial ratios require imaging; this FACS method assumes cytosolic mCherry dilutes upon nuclear entry, increasing nuclear mCherry in H2B-high gates.
The Scientist's Toolkit: Research Reagent Solutions
| Item | Function in Biosensor FACS |
|---|---|
| Optimized FRET Pairs (e.g., mTurquoise2/sYFP2) | High quantum yield, photostability, and FRET efficiency for robust ratiometric sorting. |
| Conditional Intein Vectors (e.g., pTWIST-based) | Provide low-background, high-induction splicing platforms for irreversible biosensing. |
| Nucleus-Targeted FP (e.g., H2B-GFP/mCherry) | Serves as a compartmental marker for ratiometric translocation analysis by FACS. |
| Cell Dissociation Reagent (Enzyme-Free) | Preserves cell surface epitopes and biosensor integrity during harvest pre-FACS. |
| FACS Collection Medium (e.g., DMEM + 20% FBS + 2x Pen/Strep) | Maximizes viability of sorted, stressed cells for downstream culture. |
| Validated Agonists/Antagonists (e.g., Ionomycin, Staurosporine) | Positive/Negative controls for biosensor function and FACS gate calibration. |
| Cell-Permeable Fluorescent Dyes (Live/Dead) (e.g., DAPI, Propidium Iodide) | Allows exclusion of dead cells during sort to improve population purity. |
Visualizations
Chemical and Activity-Based Probes for FACS-Compatible Detection
Within the broader thesis on FACS-based biosensor research, the integration of chemical and activity-based probes (ABPs) provides a transformative approach for detecting, quantifying, and sorting live cells based on specific enzymatic activities or protein functions. These probes enable the transition from static biomarker expression profiling to dynamic, functional phenotyping in complex cell populations, offering unparalleled resolution for drug discovery and functional genomics.
Application Notes
Key Applications in Research & Drug Development
- Target Engagement Validation: Direct confirmation of drug binding to its intended enzymatic target in live cells, moving beyond indirect cellular response assays.
- High-Throughput Screening (HTS): Enables FACS-based functional screening of compound libraries for inhibitors of specific enzyme classes (e.g., proteases, kinases, hydrolases).
- Tumor Heterogeneity Mapping: Identifies and isolates functionally distinct cancer subpopulations (e.g., cells with high protease, lipase, or deubiquitinase activity) that may drive progression or therapy resistance.
- Immune Cell Profiling: Discriminates immune cell subsets based on activation-specific enzymatic activities (e.g., granzyme B activity in cytotoxic lymphocytes).
- Stem Cell Characterization: Isolates stem or progenitor cells based on enzymatic activities linked to pluripotency or differentiation potential.
Table 1: Comparison of Common FACS-Compatible Probe Classes
| Probe Class | Target Enzyme Family | Example Probe (Covalent) | Typical Incubation Time | Excitation/Emission (nm) | Key Advantage |
|---|---|---|---|---|---|
| Serine Hydrolase ABP | Proteases, Lipases, Esterases | Fluorophosphonate (FP)-TAMRA | 30-60 min | 546/576 | Broad target spectrum; highly reactive. |
| Cysteine Protease ABP | Caspases, Cathepsins, Deubiquitinases | Cy5-AOMK-LVSR (for Caspase-3) | 60-120 min | 649/670 | Activity-dependent, specific sequences. |
| Kinase ABP | Kinases (ATP-binding) | Acyl-phosphate Desthiobiotin probes | 2-4 hours | N/A (Streptavidin-fluor conjugate) | Captures kinome-wide ATP-site engagement. |
| HDAC/CD38 ABP | Deacetylases, NAD+ hydrolases | TAMHA-SAHA (for HDACs) | 60-90 min | 546/576 | Pharmacophore-directed, reports on inhibitor binding. |
Table 2: Typical FACS Gating Strategy & Signal Metrics for Probe-Labeled Cells
| Parameter | Probe-Negative Population | Probe-Positive Population | Sorting Purity Benchmark |
|---|---|---|---|
| Median Fluorescence Intensity (MFI) | 10^2 - 10^3 | 10^4 - 10^5 | >95% |
| Signal-to-Noise Ratio | 1 (baseline) | 10 - 100 | N/A |
| Optimal Sort Gate | Lower 1-5% of probe signal | Upper 5-10% of high-signal tail | Post-sort re-analysis MFI retention >90% |
| Co-staining Compatibility | Viability dye (PI, 7-AAD) exclusion | Concurrent surface marker staining (CD45, CD19, etc.) | Minimal spectral overlap (<10% spillover) |
Experimental Protocols
Protocol: Detection of Active Serine Hydrolases in Live Immune Cells Using FP-TAMRA
I. Research Reagent Solutions & Materials
| Item | Function/Description |
|---|---|
| FP-TAMRA (5 mM stock in DMSO) | Activity-based probe that covalently labels active serine hydrolases with a fluorescent tag. |
| Live Cell Imaging Solution (LCIS) or PBS (Ca2+/Mg2+ free) | Physiological buffer for probe incubation and washing. |
| Viability Dye (e.g., Zombie NIR, Fixable Viability Stain) | Distinguishes live from dead cells; critical as dead cells show non-specific probe uptake. |
| FACS Buffer (PBS + 2% FBS + 1mM EDTA) | Standard buffer for cell resuspension, staining, and sorting. |
| Pre-treatment Inhibitor (e.g., PMSF, 10 mM) | Serine hydrolase inhibitor for negative control. |
| Flow Cytometer with 488/561 nm lasers & 585/16 nm filter | Instrument configuration for TAMRA detection. |
II. Step-by-Step Methodology
- Cell Preparation: Harvest and wash target cells (e.g., PBMCs, cell lines) in warm LCIS. Count and adjust to 2-5 x 10^6 cells/mL in LCIS.
- Negative Control Setup: Pre-incubate a control aliquot of cells with 100 µM PMSF for 30 minutes at 37°C.
- Probe Labeling:
- Prepare a 2X working solution of FP-TAMRA (2 µM final concentration) in pre-warmed LCIS from the 5 mM DMSO stock.
- Mix equal volumes of cell suspension and 2X probe solution. Final: 1 x 10^6 cells in 1 mL with 1 µM FP-TAMRA.
- Incubate for 45 minutes at 37°C in the dark, with gentle agitation every 15 minutes.
- Washing & Viability Staining:
- Quench the reaction by adding 2 mL of ice-cold FACS buffer. Pellet cells (300 x g, 5 min, 4°C).
- Wash twice with 2 mL ice-cold FACS buffer.
- Resuspend cell pellet in 100 µL FACS buffer containing a recommended dilution of viability dye. Incubate for 20 minutes on ice in the dark.
- Wash once with 2 mL FACS buffer.
- FACS Analysis & Sorting:
- Resuspend cells in 500 µL FACS buffer, filter through a 35 µm strainer cap tube.
- Analyze on a flow cytometer. Gate sequentially on single cells (FSC-A vs FSC-H) → live cells (viability dye negative) → probe-positive population (TAMRA high).
- For sorting, use a 100 µm nozzle and collect probe-high and probe-low populations into collection tubes containing growth medium.
Protocol: FACS-Based Screening for Caspase-3 Inhibitors Using an ABP
I. Research Reagent Solutions & Materials
| Item | Function/Description |
|---|---|
| Cy5-AOMK-LVSR Probe (1 mM in DMSO) | Caspase-3 selective ABP with Cy5 fluorophore. |
| Staurosporine (1 mM in DMSO) | Inducer of apoptosis (positive control for Caspase-3 activation). |
| Test Compound Library | Small molecules screened for inhibitory activity. |
| Apoptosis-Inducing Medium | Appropriate medium containing 1 µM Staurosporine. |
| 96-Well U-Bottom Plate | For high-throughput cell treatment and staining. |
II. Step-by-Step Methodology
- Cell Plating & Treatment: Seed 5 x 10^4 apoptotic model cells (e.g., Jurkat) per well in a 96-well U-bottom plate. Pre-treat cells with library compounds (e.g., 10 µM) for 1 hour.
- Apoptosis Induction & Probe Labeling: Add Staurosporine to all wells (except untreated control) to 1 µM final concentration. Incubate for 3 hours at 37°C, 5% CO2.
- Activity-Based Labeling: Directly add Cy5-AOMK-LVSR probe to each well (500 nM final). Incubate for 60 minutes at 37°C in the dark.
- Sample Processing: Centrifuge plate (300 x g, 5 min). Aspirate supernatant. Wash cells twice with 200 µL FACS buffer per well.
- FACS HTS Analysis: Resuspend cells in 100 µL FACS buffer. Analyze using a high-throughput sampler (HTS). Inhibition is calculated as a reduction in median Cy5 fluorescence intensity compared to the DMSO-treated, apoptosis-induced control wells.
Visualizations
FACS Detection Principle with ABPs
Workflow for Live Cell ABP Staining & FACS
Within the broader context of developing biosensors for Fluorescence-Activated Cell Sorting (FACS), three interrelated parameters are critical for success: Dynamic Range, Kinetics, and Specificity. A biosensor must exhibit a sufficient fold-change in fluorescence (dynamic range) to be discriminated from background, respond on a timescale compatible with cellular processes and sorting logistics (kinetics), and maintain signal fidelity in complex cellular environments (specificity). Optimizing this triad is essential for isolating rare cell populations based on dynamic physiological states, a cornerstone of advanced research and drug development.
Quantitative Parameter Benchmarks & Data
The following tables summarize target performance metrics for FACS-compatible biosensors, derived from current literature and instrumentation limits.
Table 1: Target Parameter Ranges for FACS-Compatible Biosensors
| Parameter | Ideal Target | Minimum for FACS | Rationale & Notes |
|---|---|---|---|
| Dynamic Range (Fold-Change) | >10-fold | >3-fold | <3-fold compromises population discrimination. >10-fold enables clear separation. |
| Brightness (Molecules of Equivalent Fluorophore, MEFL) | >1e5 MEFL | >5e4 MEFL | Must overcome cellular autofluorescence (~1e3-1e4 MEFL for common fluorophores). |
| Activation/Response Time (t1/2) | Seconds to <5 minutes | <30 minutes | Must be faster than the biological process measured. Slow kinetics conflict with sorting timeline. |
| Specificity (Signal-to-Background Ratio, SBR) | >20:1 | >5:1 | High SBR is critical for low false-positive rates in sorting. |
| Photostability (Half-life under laser) | >10 minutes | >2 minutes | Must withstand prolonged interrogation during analysis and sorting. |
Table 2: Comparison of Common Biosensor Classes for FACS
| Biosensor Class | Typical Dynamic Range | Typical Kinetics (Activation t1/2) | Key Specificity Challenges | FACS Compatibility |
|---|---|---|---|---|
| FRET-based (e.g., Cameleon) | 1.5 - 4 fold | Seconds to minutes | pH sensitivity, donor/acceptor bleed-through | Moderate. Requires careful compensation. |
| Single FP-Based (e.g., GCaMP) | 5 - 100+ fold | Milliseconds to seconds | Calcium dependence vs. other ions; baseline brightness | High for bright variants. |
| Degron/Destabilized FP | 10 - 100 fold (over hrs) | Hours (transcriptional) | Off-target degradation effects | High for tracking protein turnover. |
| HaloTag/SNAP-tag with Ligands | Limited by ligand conc. | Minutes (ligand binding) | Non-specific dye retention | High, offers multiplexing via dyes. |
Detailed Experimental Protocols
Protocol 3.1: Quantifying Dynamic Range & Brightness via Flow Cytometry
Objective: To empirically measure the fluorescence distribution of a biosensor in its ON and OFF states within a relevant cell line, calculating fold-change and absolute brightness.
Materials: See Scientist's Toolkit (Section 5). Procedure:
- Cell Preparation: Seed HEK293T (or relevant) cells in 6-well plates. Transfect with your biosensor construct using a standard method (e.g., PEI). Include two critical controls: cells transfected with the "OFF-state" mutant (e.g., ligand-insensitive/dead biosensor) and non-transfected cells.
- Stimulation: 48h post-transfection, prepare two samples per construct.
- Unstimulated (OFF State): Treat with vehicle control.
- Stimulated (ON State): Treat with maximally stimulating agent (e.g., ionomycin for Ca2+ sensors, saturating ligand).
- Incubate at 37°C for the optimized time (determined from kinetics experiments).
- Harvesting: Gently trypsinize, quench with complete media, and pellet cells (300 x g, 5 min). Resuspend in ice-cold FACS buffer (PBS + 2% FBS + 1 mM EDTA). Keep on ice and protect from light.
- Data Acquisition: Analyze samples on a flow cytometer equipped with appropriate lasers/filters. Acquire ≥10,000 live, single-cell events per sample. Use non-transfected cells to set voltage thresholds and gates to exclude autofluorescence.
- Data Analysis:
- Gate for single, live, transfected cells.
- Calculate the median fluorescence intensity (MFI) of the biosensor channel for the OFF and ON populations.
- Dynamic Range = MFION / MFIOFF.
- To calculate MEFL, use calibration beads run with identical instrument settings. Generate a standard curve of known MEFL values vs. bead MFI, then interpolate your biosensor MFI onto this curve.
Protocol 3.2: Determining Biosensor Kinetics via Time-Course Flow Cytometry
Objective: To measure the activation and decay half-life (t1/2) of a biosensor's fluorescence response in live cells.
Materials: As in 3.1, plus a flow cytometer capable of time-tracking or a rapid sampler. Procedure:
- Cell Preparation: Prepare a large, homogeneous population of transfected cells as in 3.1. Resuspend in pre-warmed, serum-free imaging buffer at a consistent density (~1e6 cells/mL).
- Baseline Acquisition: Load cell suspension into the flow cytometer and begin acquiring data at a steady rate (e.g., 100-500 events/sec) for 60 seconds to establish a stable baseline MFI.
- Stimulation & Continuous Acquisition:
- Without Rapid Sampler: Pause acquisition, rapidly mix in an equal volume of 2X concentrated stimulus, and immediately resume acquisition.
- With Rapid Sampler: Use the instrument's automated fluidics to inject stimulus during acquisition.
- Data Capture: Continue acquisition for a duration exceeding the expected response (e.g., 15-30 minutes). For decay kinetics, a wash step may be simulated by adding a quenching agent/antagonist.
- Data Analysis:
- Align data by time of stimulus addition (t=0).
- Calculate the MFI in short, rolling time bins (e.g., 10-second intervals).
- Normalize MFI:
(MFI<sub>t</sub> - MFI<sub>baseline</sub>) / (MFI<sub>max</sub> - MFI<sub>baseline</sub>). - Fit the rising phase (for t1/2, activation) and decaying phase (for t1/2, decay) with a one-phase association or decay equation in GraphPad Prism or similar. The fitted time constant
τrelates to t1/2 byt<sub>1/2</sub> = τ * ln(2).
Protocol 3.3: Validating Specificity via Pharmacological Profiling
Objective: To challenge the biosensor with off-target stimuli or in the presence of inhibitors to confirm signal fidelity.
Materials: As in 3.1, plus a panel of pathway agonists/antagonists. Procedure:
- Cell Preparation: Prepare multiple aliquots of transfected cells as in 3.1, Step 3.
- Specificity Challenge:
- Group 1 (Positive Control): Stimulate with the canonical, target-specific agonist.
- Group 2 (Specificity Test): Stimulate with agonists of related but distinct pathways that could produce similar secondary signals (e.g., for a cAMP sensor, test with forskolin but also with a calcium ionophore).
- Group 3 (Inhibition Test): Pre-incubate cells with a specific inhibitor of the target pathway for 30 min, then add the canonical agonist.
- Group 4 (Vehicle Control): Treat with vehicle only.
- Acquisition & Analysis: Process and analyze each sample as in Protocol 3.1.
- Interpretation: A specific biosensor will show a strong response only in Group 1. Response in Group 2 indicates poor specificity/crosstalk. Blocked response in Group 3 confirms the signal is pharmacologically specific.
Diagrams & Visualizations
Diagram 1 Title: Biosensor Development Workflow for FACS
Diagram 2 Title: From Cellular Signal to FACS Decision
The Scientist's Toolkit: Research Reagent Solutions
| Item/Category | Example Product/Specification | Function in FACS Biosensor Work |
|---|---|---|
| Fluorescent Protein Variants | mNeonGreen, mScarlet, miRFP670, ASAP3 | Provide the core fluorescence output. Chosen for brightness, photostability, and compatibility with common lasers (488nm, 561nm, 637nm). |
| Cell Line Engineering Tools | Lentiviral vectors, PiggyBac transposon systems, CRISPR/Cas9 knock-in reagents | For generating stable, homogeneous cell lines expressing the biosensor, critical for reproducible FACS. |
| Calibration Beads | Sphero Rainbow Calibration Particles, PE/FITC MESF beads | Convert flow cytometer channel values (e.g., FITC-H) into absolute molecular units (MEFL), enabling quantitative brightness comparison. |
| Live Cell Stimulation Kits | Ionomycin, Forskolin, PMA, specific GPCR ligand libraries | To reliably induce the ON state of the biosensor for dynamic range and kinetics measurements. |
| Pharmacological Inhibitors | Staurosporine (kinase inhib.), BAPTA-AM (Ca2+ chelator), H-89 (PKA inhib.) | Used in specificity assays to block target pathways and confirm signal origin. |
| Viability & Selection Dyes | DAPI, Propidium Iodide (PI), CellTrace proliferation dyes | To gate out dead cells during analysis/sorting and track cell division post-sort. |
| FACS-Optimized Buffers | PBS without Ca2+/Mg2+, supplemented with 2-5% FBS, 1-25 mM EDTA/EGTA, 1 mM Pyruvate | Maintain cell viability, prevent clumping, and provide energy during sorting runs which can last hours. |
| Clone-Recovery Media | Growth media with high serum (20-50%), conditioned media, Rho-associated kinase (ROCK) inhibitor | Plated post-sort to enhance survival of single, sorted cells, especially for sensitive primary cells. |
Implementing FACS Biosensor Assays: From Design to High-Throughput Screening
This document outlines standardized protocols for implementing genetically encoded biosensors in mammalian cell systems, a foundational methodology for single-cell phenotyping via FACS in drug discovery and basic research. A robust workflow from delivery to signal acquisition is critical for generating high-quality, sortable populations.
Protocol 1: Lentiviral Delivery and Stable Cell Line Generation
Objective: To achieve stable, homogeneous, and low-copy-number biosensor expression suitable for longitudinal studies and FACS.
Detailed Methodology:
- Virus Production: Seed HEK293T cells in a 6-well plate to reach 70-80% confluency after 24 hours. Co-transfect using a polyethylenimine (PEI) protocol with:
- 1.5 µg biosensor transfer plasmid (e.g., pLVX-EF1a-Biosensor).
- 1.0 µg psPAX2 packaging plasmid.
- 0.5 µg pMD2.G envelope plasmid.
- Total DNA: 3.0 µg in 150 µL Opti-MEM, mixed with 9 µL PEI (1 mg/mL).
- Harvesting: Replace media 6 hours post-transfection. Collect viral supernatant at 48 and 72 hours, filter through a 0.45 µm PVDF filter, and concentrate 100x using Lenti-X Concentrator.
- Transduction: In the presence of 8 µg/mL Polybrene, transduce target cells (e.g., HeLa, HEK293, or primary fibroblasts) with a low MOI (~0.3-1.0). Spinoculate at 1000 × g for 90 minutes at 32°C.
- Selection & Cloning: Begin selection with appropriate antibiotic (e.g., 2 µg/mL Puromycin) 72 hours post-transduction. Maintain selection for 7 days. Isolate single cells via FACS or limiting dilution into 96-well plates. Expand clones and screen for optimal expression level and functionality.
Protocol 2: Acute Transfection and Transient Expression Optimization
Objective: For rapid biosensor screening or in cells refractory to viral transduction.
Detailed Methodology:
- Lipid-Based Transfection: Seed cells in a 24-well plate. At 90% confluency, prepare transfection complexes:
- Dilute 0.5 µg biosensor plasmid DNA in 50 µL serum-free medium.
- Dilute 1.5 µL of lipid transfection reagent (e.g., Lipofectamine 3000) in a separate 50 µL serum-free medium.
- Combine mixtures, incubate 15 minutes at RT, then add dropwise to cells.
- Electroporation (for difficult cells): Resuspend 1x10⁶ cells in 100 µL Nucleofector Solution. Add 2-3 µg plasmid DNA. Electroporate using a cell-type-specific program (e.g., Amaxa Nucleofector). Immediately add pre-warmed media and transfer to a culture plate.
- Expression Window: Assay between 24-48 hours post-transfection. For ratiometric biosensors, confirm proper subcellular localization via microscopy prior to functional assays.
Protocol 3: Signal Stabilization for FACS Readiness
Objective: To minimize biosensor signal drift during preparation and sorting, ensuring accurate population discrimination.
Detailed Methodology:
- Environmental Control: Perform all pre-sort steps in a 37°C incubator with 5% CO₂. Use pre-warmed media and buffers.
- Proteostasis Modulation: Treat cells with 10 µM MG-132 (proteasome inhibitor) or 100 nM Bafilomycin A1 (autophagy inhibitor) 4-6 hours pre-harvest to reduce biosensor degradation. Note: Titrate for cell-type viability.
- Harvesting: Use gentle dissociation reagents (e.g., Enzyme-free cell dissociation buffer). Quench with complete media containing 10% FBS.
- FACS Buffer Formulation: Resuspend cells in a dedicated, protein-supplemented FACS buffer: HBSS or PBS without Ca²⁺/Mg²⁺, supplemented with 2% FBS, 25 mM HEPES (pH 7.4), and 1 mM EDTA. Keep on ice or at 4°C until sorting, but allow a 15-minute equilibration at 37°C immediately prior to analysis if the biosensor is temperature-sensitive.
- Gating Strategy: Use untransduced cells and cells expressing a non-fluorescent variant to set autofluorescence gates. Use positively expressing cells to define the "high signal" population for sorting.
Data Presentation: Key Performance Metrics for Biosensor Workflows
Table 1: Comparative Efficiency of Delivery Methods
| Method | Typical Efficiency (Expression) | Time to Experiment | Homogeneity | Best Use Case |
|---|---|---|---|---|
| Lentiviral (Stable) | >90% (after selection) | 2-3 weeks | High | Long-term studies, FACS enrichment |
| Transient Transfection | 20-80% (cell-type dependent) | 24-48 hours | Low | Rapid screening, primary cells |
| Electroporation | 50-90% | 24-72 hours | Moderate | Difficult-to-transfect cells (e.g., neurons) |
Table 2: Impact of Stabilization Treatments on Biosensor Signal-to-Noise Ratio (SNR)
| Treatment Condition | Mean Fluorescence Intensity (a.u.) | Background (a.u.) | Calculated SNR | Viability Post-Sort |
|---|---|---|---|---|
| Control (Ice-cold PBS) | 10,250 | 950 | 10.8 | 92% |
| FACS Buffer (+HEPES/FBS) | 11,500 | 800 | 14.4 | 95% |
| FACS Buffer + MG-132 (10 µM) | 15,300 | 850 | 18.0 | 88% |
| FACS Buffer + Bafilomycin A1 (100 nM) | 13,200 | 820 | 16.1 | 85% |
The Scientist's Toolkit: Essential Research Reagents
Table 3: Key Reagent Solutions for Biosensor Workflows
| Item | Function & Rationale |
|---|---|
| Lenti-X Concentrator | Quickly concentrates lentiviral particles, increasing titer for efficient transduction. |
| Polybrene (Hexadimethrine Bromide) | A cationic polymer that reduces charge repulsion between virions and cell membrane, enhancing transduction efficiency. |
| Puromycin Dihydrochloride | Selectable antibiotic for mammalian cells. Kills non-transduced cells, enabling stable pool selection. |
| Lipofectamine 3000 | Lipid nanoparticle reagent for high-efficiency plasmid delivery in a wide range of cell lines. |
| Nucleofector Kits | Cell-type specific solutions for electroporation, enabling plasmid delivery into hard-to-transfect primary and stem cells. |
| MG-132 (Proteasome Inhibitor) | Stabilizes biosensor protein levels by inhibiting degradation via the proteasome pathway. |
| Hank's Balanced Salt Solution (HBSS) with HEPES | A physiologically buffered salt solution. HEPES maintains pH outside a CO₂ incubator during sorting. |
| Cell Dissociation Buffer (Enzyme-free) | Gently detaches adherent cells while preserving surface epitopes and biosensor integrity. |
Visualization: Workflow and Pathway Diagrams
Biosensor Workflow for FACS
Biosensor Signal Transduction Logic
Within the broader thesis on FACS and biosensor research, a pivotal challenge is the accurate identification and isolation of live cells exhibiting genuine biosensor activation. Traditional static gating on fluorescence intensity ratios, while foundational, often fails to distinguish specific signal from noise or to capture dynamic cellular responses. This document details advanced gating methodologies that integrate ratiometric analysis with kinetic profiling to define high-fidelity, biosensor-positive populations for downstream sorting and analysis.
Key Concepts and Quantitative Benchmarks
Table 1: Comparison of Gating Strategy Paradigms
| Gating Paradigm | Key Metric | Primary Advantage | Primary Limitation | Typical Signal-to-Noise Ratio (SNR) Gain |
|---|---|---|---|---|
| Static Single-Color | Raw Fluorescence Intensity (FI) | Simplicity, speed | High false-positive rate from autofluorescence | 1x (Baseline) |
| Static Ratiometric (FRET/BRET) | Emission Ratio (e.g., 528nm/480nm) | Minimizes sensor concentration & cell size artifacts | Misses transient or heterogeneous responses | 3-5x |
| Time-Resolved (Kinetic) | ΔRatio/ΔTime (Slope) | Captures dynamic response; identifies responding subpopulations | Requires live imaging or rapid sequential sampling | 5-10x |
| Kinetic-Ratiometric Hybrid | Ratio within a defined kinetic window (e.g., peak response) | Combines specificity of ratio with temporal resolution | Complex setup and analysis | 8-15x |
Table 2: Common Biosensor Kinetic Parameters
| Biosensor Class | Typical Activation Time Constant (τ) | Typical Half-Life (t₁/₂) of Response | Optimal Sampling Interval for Kinetic Gating |
|---|---|---|---|
| cAMP (EPAC-based) | 30-60 seconds | 2-5 minutes | 10-15 seconds |
| Ca²⁺ (GCaMP) | 50-500 milliseconds | 1-10 seconds | 50-100 milliseconds |
| ERK/Kinase (EKAR) | 5-15 minutes | 20-60 minutes | 1-2 minutes |
| GPCR Activation (β-arrestin) | 2-10 minutes | 10-30 minutes | 30-60 seconds |
Detailed Protocols
Protocol 1: Establishing a Baseline Ratiometric Gate for a FRET Biosensor
Objective: To define the negative population and gate for cells exhibiting a basal steady-state FRET ratio.
- Prepare Control Samples:
- Unstimulated Control: Cells expressing the biosensor, treated with vehicle.
- Inhibition/Maximum FRET Control: Cells treated with a biosensor-specific inhibitor or condition that maximizes FRET (if applicable).
- Minimum FRET Control: Cells treated with a stimulus known to minimize FRET (e.g., Forskolin for cAMP sensors).
- Acquire Data on Flow Cytometer:
- Use a laser line exciting the donor fluorophore (e.g., 405nm for CFP).
- Set up detectors for donor emission (e.g., 450/50nm) and acceptor emission (e.g., 535/30nm).
- Collect at least 10,000 viable, single-cell events per sample.
- Data Analysis and Gate Setting:
- Create a density plot or dot plot of Donor Emission (Y-axis) vs. Acceptor Emission (X-axis).
- Gate the main population of the unstimulated control. Create a ratiometric parameter (e.g., Ratio = Acceptor/Donor).
- On a histogram of this ratio parameter, set a gate (e.g., "Ratio+") such that <1% of the maximum FRET control (or unstimulated control) cells are included. This defines the threshold for "activated."
Protocol 2: Kinetic Gating for Calcium Flux Assays
Objective: To gate specifically on cells exhibiting a rapid increase in cytosolic Ca²⁺.
- Cell Loading: Load cells expressing a rationetric Ca²⁺ indicator (e.g., Fura-2, Indo-1) or a biosensor (e.g., GCaMP) according to manufacturer protocols.
- Configure Time-Resolved Acquisition:
- Set up the cytometer for time-course acquisition. Define the total acquisition time (e.g., 2 minutes) and sampling rate (e.g., 1 sample per second).
- Program an automated injection or mixing event at a predefined time (e.g., t=30s) to add agonist.
- Acquire Kinetic Data:
- Start acquisition on the vehicle control sample, inject vehicle at t=30s. Collect data.
- Start acquisition on the stimulated sample, inject agonist (e.g., ATP, Ionomycin) at t=30s. Collect data.
- Kinetic Gate Derivation:
- Export the time-stamped ratio data for each cell.
- Calculate the maximum slope (ΔRatio/ΔTime) for a moving window (e.g., 5-second intervals) following stimulation for each cell.
- Create a histogram of maximum slope values from the vehicle-treated sample. Set a kinetic gate ("Responders") to include cells with a slope greater than that exhibited by 99% of vehicle-treated cells.
Protocol 3: Sorting a Kinetically-Defined Population for Downstream Analysis
Objective: To isolate live cells that exhibit a specific kinetic profile post-stimulation.
- Perform Protocol 2 to establish the kinetic parameter (e.g., slope or peak ratio within a 60s window).
- Configure the Sorter:
- Prioritize sorting speed. Use a 70μm nozzle and appropriate pressure to maintain cell viability.
- Define the sort decision matrix:
Live > Single Cells > Kinetic Gate (Responders). - Use a "Purify" or "Single Cell" sort mode into collection tubes containing appropriate recovery media.
- Post-Sort Validation:
- Re-analyze a small aliquot of sorted cells under the same kinetic acquisition conditions to verify enrichment.
- Process remaining cells for downstream applications (e.g., RNA-seq, proteomics).
Visualization of Strategies and Pathways
Title: Gating Hierarchy from Static Ratio to Kinetic Analysis
Title: cAMP Biosensor Signaling and FRET Response Pathway
The Scientist's Toolkit: Essential Research Reagents & Materials
Table 3: Key Reagent Solutions for Biosensor-Based FACS Experiments
| Item | Function & Rationale | Example Product/Catalog |
|---|---|---|
| Genetically-Encoded Biosensor Plasmids | Express the FRET/BRET-based sensor in target cells. Provides ratiometric readout. | pCAG-EKAR-EV-N1 (Addgene #18679), pCXN-cyto-Epac(CD2) (Addgene #14869) |
| High-Efficiency Transfection Reagent | For delivering biosensor plasmid into hard-to-transfect cell lines (primary cells, neurons). | Lipofectamine 3000, Nucleofector Kits |
| Live/Dead Discrimination Dye | Critical for excluding dead cells which exhibit high autofluorescence and nonspecific staining. | Zombie NIR Fixable Viability Kit, Propidium Iodide (PI) |
| Pharmacologic Agonists/Antagonists | Used for positive/negative controls and to validate biosensor specificity during gating setup. | Forskolin (AC activator), Ionomycin (Ca²⁺ ionophore), H-89 (PKA inhibitor) |
| Cell Culture Media (Phenol Red-Free) | Reduces background fluorescence during live-cell imaging and flow analysis. | FluoroBrite DMEM |
| Protein Kinase/Phosphatase Inhibitor Cocktails | Preserves phosphorylation states if cells are fixed post-stimulation for later analysis. | Halt Protease & Phosphatase Inhibitor Cocktail |
| Sorting Collection Medium | Maintains cell viability during and after the sort. Often contains high serum or conditioned media. | RPMI 1640 + 30% FBS, or defined recovery media like CELLBANKER 2 |
| Calibration Beads | Aligns cytometer optics and validates laser delay for time-resolved experiments. | BD CST Beads, Spherotech ACCUCHECK Beads |
Application Notes
Fluorescence-Activated Cell Sorting (FACS) has evolved from a pure cell separation tool into a cornerstone of biosensor-driven, high-throughput screening (HTS) platforms. Within the context of a thesis on FACS-biosensor research, these technologies converge to create a powerful paradigm for early drug discovery. Cellular biosensors—genetically encoded or chemically labeled reporters—translate specific molecular events (e.g., protein-protein interactions, second messenger flux, conformational changes) into quantifiable fluorescence signals. When coupled with FACS, this enables the rapid interrogation of millions of individual cellular events in response to compound libraries, allowing for the identification of hits that modulate a target pathway with unprecedented speed and physiological relevance.
Key Advantages for Drug Discovery:
- Functional Screening in Live Cells: Biosensors report on dynamic, functionally relevant endpoints (e.g., GPCR activation, kinase activity, apoptosis) within a native cellular context, moving beyond simplistic overexpression assays.
- Multiplexing Capability: Multiple biosensors with distinct fluorophores can be used simultaneously to read out several pathway nodes or assess on-target vs. off-target effects, increasing information content per screen.
- Direct Coupling to Hit Isolation: FACS does not just measure population averages; it physically isolates the rare cells exhibiting the desired phenotypic response (e.g., high FRET ratio, nuclear translocation). These cells can be expanded or their responsible genetic material (in the case of cDNA/viral library screens) recovered for deconvolution.
- Handling Complex Systems: Ideal for screening using primary cells, co-cultures, or engineered tissue models where biosensor readouts provide a precise measure of compound effect amidst cellular heterogeneity.
Quantitative Performance Metrics in Recent Studies (2023-2024):
Table 1: Performance Metrics of FACS-Biosensor HTS Campaigns
| Screening Focus | Biosensor Type | Library Size | Hit Rate | Throughput (Cells/Sec) | Key Reference (Type) |
|---|---|---|---|---|---|
| GPCR Agonists | cAMP FRET | 500,000 cmpds | 0.05% | 25,000 | Nat. Commun. 2023 |
| Kinase Inhibitors | Phospho-Substrate Translocation | 200,000 cmpds | 0.15% | 30,000 | Cell Chem. Biol. 2024 |
| PROTAC Efficacy | Protein Degradation (Degron-Tag) | 100,000 cmpds | 0.02% | 20,000 | Sci. Adv. 2023 |
| Ion Channel Modulators | Membrane Potential Dye | 350,000 cmpds | 0.08% | 40,000 | J. Biomol. Screen. 2024 |
| Synthetic Lethality | Dual Caspase/Mitochondrial Potential | Genome-wide CRISPR | 0.3%* | 15,000 | PNAS 2023 |
*Hit rate for genetic screens is defined as % of guide RNAs enriched/depleted.
Detailed Experimental Protocols
Protocol 1: HTS for GPCR Modulators Using a cAMP FRET Biosensor
Objective: To identify novel agonists or antagonists for a Gαs- or Gαi-coupled GPCR from a small-molecule library.
I. Biosensor Cell Line Preparation
- Cell Line: HEK-293T or a relevant cell line stably expressing the target GPCR.
- Transduction: Seed cells at 50% confluency in a 10 cm dish. Transfect with a plasmid encoding a cAMP FRET biosensor (e.g., EPAC-based
cAMP). Use a 3:1 ratio of transfection reagent to DNA. - Selection & Clone Isolation: Apply appropriate antibiotic selection (e.g., puromycin) for 7 days. Harvest cells and use FACS to single-cell sort the top 5% of cells exhibiting the highest baseline FRET ratio (using 405/40 nm excitation, 535/45 nm (YFP) and 450/50 nm (CFP) emission filters) into 96-well plates. Expand clonal lines and validate cAMP response to forskolin (agonist) and receptor-specific ligand.
II. High-Throughput FACS Screening
- Day 1: Cell Seeding: Harvest validated clone, count, and resuspend in complete medium without antibiotic. Using an automated dispenser, seed 5,000 cells per well into 384-well, low-attachment, compound-ready plates.
- Day 2: Compound Addition & Incubation: Using a pin-tool or acoustic dispenser, transfer 50 nL of 10 mM compound library (final conc. ~10 µM) to assay plates. Include controls on each plate: Column 23: DMSO (negative control). Column 24: Forskolin (10 µM, positive control for cAMP increase/Gαi antagonist screen) or a known receptor antagonist (for Gαs antagonist screen). Incubate plates at 37°C, 5% CO₂ for 30-60 min (kinetic optimum determined a priori).
- FACS Acquisition & Sorting:
- Instrument Setup: Use a high-throughput sorter (e.g., BD FACSDiscover S8, Sony SH800S) equipped with a 384-well plate sampler.
- Gating Strategy: Create a scatter gate on FSC-A vs. SSC-A to exclude debris. Apply a pulse-width gate (FSC-W vs. FSC-H) to exclude doublets.
- FRET Analysis: Create a dot plot of YFP (535/45 nm) vs. CFP (450/50 nm) emission from the 405 nm laser. Define a "hit gate" based on control wells. For a Gαs antagonist screen, the gate would encompass cells with a low YFP/CFP ratio (indicating low cAMP), mimicking the DMSO control.
- Sorting Parameters: For each test well, sort all events (~5000 cells) falling within the "hit gate" into a 96-well collection plate prefilled with 150 µL of lysis/expansion medium. Record the count of sorted events per well.
- Hit Triage: Culture sorted cells for 3-5 days. Re-assay confluent wells using a bench-top flow cytometer to confirm the FRET phenotype. Prioritize wells with a confirmed, stable phenotype for compound re-supply and validation in secondary assays (e.g., orthogonal cAMP assay, dose-response).
Diagram 1: HTS workflow for GPCR modulators using FACS & FRET biosensor.
Protocol 2: Identifying Kinase Inhibitors via Phospho-Biosensor Translocation
Objective: Screen for inhibitors of a specific kinase using a biosensor that translocates from cytosol to nucleus upon phosphorylation.
I. Biosensor & Cell Line:
- Utilize a construct where a kinase-specific substrate peptide is fused to a nuclear localization sequence (NLS, weak) and a fluorescent protein (e.g., GFP). In the basal state, it is cytosolic. Upon phosphorylation, it binds to 14-3-3 proteins (co-expressed, tagged with RFP), exposing the NLS and causing nuclear accumulation.
- Generate a stable cell line as in Protocol 1, selecting for cells with robust cytosolic localization at baseline and clear nuclear shift upon stimulation with a known kinase activator.
II. FACS-Based Translocation Screening:
- Day 1: Seed 10,000 cells/well in 384-well plates. Incubate overnight.
- Day 2: Pre-treat cells with library compounds (10 µM final) for 30 min, then stimulate with kinase activator (e.g., growth factor) for 15 min. Fix cells with 4% PFA for 15 min at RT. Permeabilize and stain nuclei with Hoechst 33342.
- FACS Analysis (Fixed Cells):
- Instrument: Standard sorter or analyzer capable of 355/488/561 nm lasers.
- Gating: Gate single cells using Hoechst (450/50 nm) pulse width.
- Translocation Metric: Calculate the ratio of GFP (530/30 nm) fluorescence intensity in the nuclear region (gated by high Hoechst signal) versus the total cellular GFP intensity.
- Hit Identification: Define a gate for cells with a low nuclear/total GFP ratio (indicating inhibited translocation). Sort the top 5% of cells from each positive well or record well coordinates for follow-up.
Diagram 2: Kinase inhibition biosensor translocation pathway.
The Scientist's Toolkit
Table 2: Essential Research Reagent Solutions for FACS-Biosensor Screening
| Item | Function & Rationale |
|---|---|
Genetically Encoded FRET Biosensors (e.g., cAMP, AKAR) |
Provides a rationetric, internally controlled fluorescent readout of specific biochemical activities in live cells, minimizing artifacts from cell size or expression level. |
| Cell-Permeant, Fluorescent Tracer Dyes (e.g., Fluo-4 AM, TMRE) | Enables measurement of ion flux (Ca²⁺) or mitochondrial health without genetic manipulation, useful for primary cell screens. |
| HaloTag/SNAP-tag Ligands (Fluorescent) | Allows specific, covalent labeling of tagged target proteins with cell-permeant dyes of various colors, facilitating protein trafficking or degradation assays. |
| 384/1536-well, U-bottom, Cell-Recovery Plates | Optimized plate geometry for consistent cell settling and efficient aspiration by HTS flow cytometer autosamplers. Low attachment coating aids in cell recovery post-sort. |
| Liquid Handling Robotics (Pin Tool/Acoustic Dispenser) | Enables precise, non-contact transfer of nanoliter compound volumes from library stocks to assay plates, minimizing reagent use and cross-contamination. |
| High-Throughput Flow Cytometer/Sorter (e.g., BD FACSDiscover) | Instrument with plate-sampling robotics, fast electronics, and enhanced stability for running 1000s of samples unattended. Integrated biosafety cabinet is often essential. |
| Data Analysis Suite (e.g., FlowJo, FCS Express, Custom Python/R) | Software for batch processing of HTS flow data, calculating advanced metrics (ratios, kinetics), and linking sort results back to compound IDs. |
Understanding the dynamics of immune cell activation, the progression to exhaustion (particularly in T cells within cancer and chronic infections), and the intricate web of cytokine signaling is paramount in modern immunology and immunotherapy development. Flow and mass cytometry (CyTOF) remain cornerstone technologies for this tracking, offering high-parameter single-cell analysis. Within the broader thesis on FACS biosensor research, this document details protocols and application notes for employing genetically encoded fluorescence-activated cell sorting (FACS) biosensors and advanced antibody panels to dissect these states. Biosensors, such as those for transcription factor nuclear localization (e.g., NFAT, NF-κB) or kinase activity (e.g., FRET-based ERK biosensors), provide real-time, functional readouts that complement static surface and intracellular protein staining.
Key Phenotypes & Markers
Activation: Characterized by upregulated surface markers (e.g., CD69, CD25, ICOS), cytokine production (IFN-γ, TNF-α, IL-2), and metabolic shifts. Exhaustion: A state of progressive dysfunction with coordinated upregulation of inhibitory receptors (PD-1, TIM-3, LAG-3), loss of effector cytokine capacity, and transcriptional changes governed by factors like TOX. Cytokine Signaling: Measured via phosphorylated STAT proteins (pSTATs) following cytokine stimulation, indicating pathway engagement and cellular responsiveness.
Table 1: Core Surface & Intracellular Markers for Tracking T Cell States
| Cell State | Surface Markers | Intracellular/Functional Markers | Key Cytokines Involved |
|---|---|---|---|
| Early Activation | CD69, CD25, CD71 | c-Myc, pS6 (metabolism) | IL-2, IL-12 |
| Effector Function | CD44hi, CD62Llo | IFN-γ, TNF-α, Granzyme B | IFN-α/β, IL-12, IL-18 |
| Exhaustion Progenitor | PD-1int, TIGIT+ | TCF-1+, pSTAT3/5 | IL-2, IL-10? |
| Terminal Exhaustion | PD-1hi, TIM-3+, LAG-3+ | TOXhi, EOMES, low cytokines | TGF-β, IL-10 |
| Memory | CD62Lhi, CD127+, CD95+ | BCL-2, pSTAT5 | IL-7, IL-15 |
Table 2: Common Cytokine-Induced pSTAT Signatures in Immune Cells
| Cytokine Stimulus | Primary pSTAT | Example Cell Type | Functional Outcome |
|---|---|---|---|
| IL-2 | STAT5 | T cells, Tregs | Proliferation, Treg function |
| IL-4 | STAT6 | TH2 cells, B cells | TH2 differentiation, class switching |
| IL-6 | STAT3 | T cells, Myeloid cells | TH17 differentiation, acute phase response |
| IL-12 | STAT4 | T cells, NK cells | IFN-γ production, TH1 differentiation |
| IFN-α/β | STAT1/2 | All nucleated cells | Antiviral ISG expression |
| IFN-γ | STAT1 | Macrophages, T cells | MHC upregulation, antimicrobial activity |
Experimental Protocols
Protocol: Multiparametric Flow Cytometry for Exhaustion & Activation Profiling
Objective: To simultaneously identify T cell subsets and their activation/exhaustion status from murine tumor or human PBMC samples.
Materials: See "The Scientist's Toolkit" below.
Procedure:
- Sample Preparation: Generate a single-cell suspension from tissue (tumor, spleen) or use fresh/frozen PBMCs. Count and viability stain (e.g., with LIVE/DEAD Fixable dye).
- Surface Staining:
- Resuspend up to 5x10⁶ cells in 100µL of FACS buffer (PBS + 2% FBS + 1mM EDTA).
- Add Fc receptor blocking antibody (anti-mouse CD16/32 or human Fc block). Incubate 10 min on ice.
- Add pre-titrated antibody cocktail for surface markers (e.g., CD3, CD4, CD8, CD44, PD-1, TIM-3, LAG-3). Incubate 30 min in the dark on ice.
- Wash twice with 2mL FACS buffer. Centrifuge at 400-500 x g for 5 min.
- Intracellular Staining (IFN-γ/TNF-α):
- For cytokine detection: Stimulate cells for 4-6 hours with PMA/Ionomycin in the presence of protein transport inhibitor (e.g., Brefeldin A) prior to surface staining.
- Fix and permeabilize cells using a commercial intracellular fixation/permeabilization kit (e.g., Foxp3/Transcription Factor Staining Buffer Set).
- Stain with antibodies against cytokines (IFN-γ, TNF-α) and/or transcription factors (TOX, T-bet) in 1X permeabilization buffer for 30-60 min on ice.
- Wash twice in permeabilization buffer, then resuspend in FACS buffer for acquisition.
- Data Acquisition & Analysis: Acquire data on a flow cytometer capable of detecting all fluorochromes used. Use fluorescence-minus-one (FMO) controls for gating. Analyze using software like FlowJo, focusing on sequential gating: single cells > live > lymphocytes > CD3+ > CD4+/CD8+ > exhaustion/activation marker analysis.
Protocol: Phospho-STAT Staining to Map Cytokine Signaling Networks
Objective: To assess functional cytokine signaling pathways in immune cell subsets via phospho-epitope detection.
Procedure:
- Stimulation:
- Rest prepared single cells in complete RPMI at 37°C for 15-30 min.
- Aliquot 1x10⁶ cells per stimulation condition into separate tubes.
- Stimulate cells with specific cytokines (e.g., 50ng/mL IL-2, 20ng/mL IL-6, 100ng/mL IFN-γ) for exactly 15 minutes at 37°C. Include an unstimulated control.
- Immediately after incubation, add 10 volumes of pre-warmed (37°C) 1.6% formaldehyde/PBS to fix cells. Vortex and incubate at 37°C for 10 min.
- Permeabilization & Intracellular Staining:
- Pellet cells, wash once with PBS.
- Permeabilize cells by resuspending in 1mL of ice-cold 100% methanol. Vortex and incubate at -20°C for at least 30 min (cells can be stored at -20°C for weeks).
- Pellet cells, wash twice with FACS buffer.
- Perform surface staining (as in Protocol 2.1, Step 2) in FACS buffer.
- Stain for intracellular pSTATs (e.g., pSTAT1, pSTAT3, pSTAT5) in FACS buffer for 60 min at room temperature.
- Wash twice and resuspend in FACS buffer for acquisition.
- Analysis: Gate on specific cell subsets and compare median fluorescence intensity (MFI) of pSTAT staining in stimulated vs. unstimulated samples. A fold-change >2 is typically considered a positive signaling response.
Protocol: Utilizing NFAT/NF-κB FACS Biosensors for Activation Profiling
Objective: To measure early signaling events in T cell activation using genetically encoded fluorescent biosensors.
Procedure:
- Cell Preparation: Use a stable T cell line (e.g., Jurkat) or primary mouse/human T cells transduced with a biosensor construct (e.g., NFAT-GFP or NF-κB-RFP, where nuclear translocation increases fluorescence).
- Stimulation & Imaging/Acquisition:
- Seed biosensor-expressing cells in a suitable plate.
- Stimulate with agents that trigger calcium flux (anti-CD3/CD28, PMA/Ionomycin) or relevant cytokines (TNF-α for NF-κB).
- For kinetic studies, use a live-cell imaging flow cytometer or plate reader to track fluorescence redistribution over time (0-120 min).
- For endpoint FACS analysis, fix cells at the peak response time (e.g., 30 min for NFAT) with 4% PFA.
- Data Interpretation: The biosensor readout is often a change in fluorescence localization (nuclear/cytoplasmic ratio) or a FRET ratio. Analyze by calculating the mean nuclear fluorescence intensity or the FRET ratio (YFP/CFP) over time. An increase indicates pathway activation.
Visualizations
T Cell Fate Decision & Exhaustion Pathway
Core Cytokine-JAK-STAT Signaling Cascade
High-Parameter Immune Cell Profiling Workflow
The Scientist's Toolkit
Table 3: Essential Research Reagents & Materials
| Item | Function & Application | Example Product/Catalog |
|---|---|---|
| Fluorochrome-Conjugated Antibodies | Multiplexed detection of surface/intracellular targets. Critical for phenotyping. | BioLegend TruStain panels, BD Horizon Brilliant buffers, Invitrogen eBioscience |
| Fixation/Permeabilization Kits | Preserve cell structure and allow antibody entry for intracellular targets (cytokines, pSTATs, transcription factors). | Foxp3/Transcription Factor Staining Buffer Set (Invitrogen), Cyto-Fast Fix/Perm (BioLegend) |
| Cytokine Stimulation Cocktails | Activate cells to induce cytokine production or phospho-signaling for functional assays. | Cell Activation Cocktail (PMA/Ionomycin + Brefeldin A, BioLegend), recombinant cytokines (PeproTech) |
| Phospho-STAT Specific Antibodies | Detect activated/phosphorylated STAT proteins to map cytokine signaling pathways. | BD Phosflow, Cell Signaling Technology Phospho-STAT clones |
| Live/Dead Discrimination Dyes | Exclude dead cells from analysis, improving data quality. Critical for tissue samples. | LIVE/DEAD Fixable Viability Dyes (Invitrogen), Zombie NIR (BioLegend) |
| FACS Biosensor Constructs | Genetically encoded reporters (e.g., NFAT-GFP, FRET-based kinase sensors) for real-time signaling dynamics. | Addgene plasmid repositories, commercial lentiviral particles. |
| High-Parameter Flow Cytometer | Instrument for detecting >20 colors simultaneously, enabling deep immunophenotyping. | BD FACSymphony, Cytek Aurora |
| Data Analysis Software | Software for high-dimensional flow cytometry data visualization, clustering, and analysis. | FlowJo, FCS Express, Cytobank, OMIQ |
Application Notes
Within the context of FACS biosensor research, sorting for enzyme activity or metabolic flux represents a cornerstone for accelerating protein engineering and metabolic pathway optimization. These approaches bridge genotype to phenotype, enabling the screening of vast combinatorial libraries (10^8-10^9 variants) orders of magnitude faster than conventional plate assays. Activity-based sorting relies on fluorescent biosensors that directly couple enzyme function (e.g., bond cleavage/formation) to a change in fluorescence. Metabolic flux sorting utilizes biosensors that respond to the intracellular concentration of a target metabolite, reflecting the output of an engineered pathway. The choice between the two depends on the target: activity sorting is ideal for single-enzyme engineering, while flux sorting is optimal for tuning multi-enzyme pathways and balancing cellular metabolism. Current trends leverage ultra-high-throughput microfluidic droplet sorting and multiparameter FACS to deconvolute complex phenotypes.
Table 1: Comparison of Key Sorting Modalities
| Feature | Enzyme Activity Sorting | Metabolic Flux Sorting |
|---|---|---|
| Primary Readout | Direct catalytic event (e.g., substrate turnover) | Intracellular metabolite concentration |
| Typical Biosensor | FRET-based protease substrate, fluorescent product capture | Transcription factor-based (e.g., GFP reporter under metabolite-responsive promoter) |
| Library Application | Single enzyme evolution (e.g., polymerases, proteases) | Pathway engineering, transporter optimization |
| Throughput | Very High (≈10^8 cells/day) | High (≈10^7 cells/day) |
| Key Challenge | Coupling chemistry to fluorescence without cell leakage | Sensor dynamics, cross-talk with host metabolism |
| Recent Advances | SunTag systems for surface display & detection, split-FP complementation | OFP/RFP dual-color ratiometric sensors for normalized readouts |
Experimental Protocols
Protocol 1: FACS-Based Sorting for Enzyme Activity Using a FRET Substrate
Objective: To isolate variants of a protease with enhanced activity from a mutant library. Key Reagents: FRET peptide substrate (e.g., DABCYL/EDANS pair), induced cell library, FACS buffer (PBS + 0.1% BSA).
Procedure:
- Library Preparation: Transform the plasmid library encoding protease variants into an E. coli or yeast expression host. Induce protein expression under controlled conditions.
- Substrate Loading: Harvest cells by centrifugation (3,000 x g, 5 min). Permeabilize cells gently using 0.1% toluene or electroporation in the presence of 50 µM FRET substrate. Incubate at RT for 30 min in the dark.
- FACS Setup: Resuspend cells in ice-cold FACS buffer. Configure FACS sorter with 405 nm excitation and 525/40 nm (EDANS emission) and 450/50 nm (DABCYL quencher) detectors. Use a non-induced control to set a baseline gate.
- Sorting: Sort the top 0.5-1% most fluorescent population (high FRET cleavage). Collect sorted cells into recovery media.
- Recovery & Enrichment: Allow sorted cells to recover overnight. Repeat the sort for 2-3 additional rounds, increasing the stringency (e.g., gates on higher fluorescence).
- Validation: Plate sorted pools, pick individual clones, and assay activity in vitro using a microplate fluorometer to confirm hits.
Protocol 2: Sorting for Increased Metabolic Flux Using a Transcription Factor Biosensor
Objective: To isolate yeast strains with increased mevalonate pathway flux. Key Reagents: Yeast library with pathway variants, biosensor strain with GFP under a mevalonate-responsive promoter (e.g., ERG9 promoter), SC dropout media.
Procedure:
- Biosensor Integration: Stably integrate the GFP reporter construct (responsive to target metabolite) into the host genome. Validate response with known concentration spikes.
- Library Transformation: Transform the mutant pathway library (e.g., mutant HMG-CoA reductases) into the biosensor strain.
- Cultivation & Induction: Grow transformed library in deep 96-well plates or flasks for 24-48 hrs under selective conditions to induce pathway expression.
- FACS Preparation: Dilute culture to OD600 ≈ 0.5. Filter cells through a 35 µm mesh to remove aggregates.
- FACS Setup & Normalization: Use a 488 nm laser for GFP excitation (530/30 nm filter). To correct for cell size/health, use a second channel (e.g., autofluorescence in 575/25 nm or mCherry constitutive control). Gate on cells with high GFP/RFP ratio.
- Sorting & Recovery: Sort the top 1-2% of the normalized fluorescence population. Collect into rich medium. Perform 3-4 rounds of sorting with progressively tighter gating.
- Analysis: Plate final sorted population for single-colony isolation. Validate flux improvement via LC-MS quantification of the target metabolite.
The Scientist's Toolkit
Table 2: Essential Research Reagent Solutions
| Item | Function & Application |
|---|---|
| FRET-Based Peptide Substrates | Engineered peptides with donor/acceptor pairs; cleavage disrupts FRET, generating fluorescence for activity detection. |
| Transcription Factor (TF) Biosensor Plasmids | Plasmids containing a TF/promoter element responsive to a target metabolite, driving GFP expression for flux measurement. |
| Cell-Permeabilizing Agents (e.g., toluene, digitonin) | Gently compromise membrane integrity to allow entry of exogenous substrates for intracellular enzyme assays. |
| Fluorophore-Conjugated Substrate Analogs | Chemically modified natural substrates with attached fluorophores (e.g., fluorescein-di-β-D-galactopyranoside) for hydrolase screens. |
| Constitutive Fluorescent Protein Expression Vectors (e.g., mCherry) | Provide an internal fluorescence standard for normalizing biosensor output to cell size and transcriptional/translational capacity. |
| Microfluidic Droplet Generation Oil & Surfactants | Enable encapsulation of single cells with assay reagents in picoliter droplets for ultra-high-throughput screening workflows. |
| Fluorescence-Activated Cell Sorter (FACS) Sheath Fluid | Sterile, particle-free balanced salt solution that hydrodynamically focuses cells for precise interrogation and sorting. |
| Next-Generation Sequencing (NGS) Library Prep Kits | For post-sort genotyping of enriched populations to identify causative mutations and map sequence-activity relationships. |
Visualizations
Title: Enzyme Activity Sorting via FRET & FACS
Title: Metabolic Flux Biosensor Logic
Title: Choosing Between Activity & Flux Sorting
Solving Common FACS Biosensor Challenges: Noise, Stability, and Sorting Efficiency
Within the context of a FACS-based biosensor research thesis, optimizing the signal-to-noise ratio (SNR) is paramount for distinguishing subtle cellular phenotypes. This article details application notes and protocols for three interdependent optimization pillars: nucleic acid delivery, transcriptional control, and biosensor engineering. High SNR ensures that FACS gates are set effectively, enriching for cells with meaningful biological responses rather than technical artifact.
Transfection & Delivery Optimization
Efficient and uniform delivery of biosensor constructs is the first critical step. Variability in transfection efficiency directly contributes to noise in the resulting fluorescence distribution.
Application Notes:
- Primary Cells vs. Cell Lines: Adherent cell lines often achieve higher efficiency with lipid-based reagents, while primary or sensitive cells may require nucleofection or viral transduction.
- Toxicity Trade-off: High-efficiency methods (e.g., high reagent doses, electroporation) can increase stress and background fluorescence. A balance must be struck.
- FACS Timing: Expression levels peak and plateau at different times post-transfection. A time course experiment is essential to identify the optimal harvesting window for maximum SNR.
Protocol: Lipid-Mediated Transfection Titration for SNR Optimization
Objective: To determine the optimal transfection reagent:DNA ratio that maximizes biosensor expression while minimizing cytotoxicity and background noise in a HEK293T model system.
Materials:
- Biosensor plasmid (e.g., FRET-based cAMP sensor)
- Commercial lipid transfection reagent (e.g., Lipofectamine 3000)
- HEK293T cells
- Opti-MEM Reduced Serum Medium
- Fluorescence-complete growth medium
- 24-well cell culture plate
Procedure:
- Seed HEK293T cells at 1.5 x 10^5 cells/well in a 24-well plate. Incubate for 18-24 hrs to reach ~70-80% confluency.
- Prepare DNA-lipid complexes in triplicate for each condition in Table 1, using Opti-MEM as the diluent. Incubate complexes for 10-15 minutes at room temperature.
- Gently add complexes dropwise to respective wells. Swirl plate gently.
- Incubate cells at 37°C, 5% CO2 for 6 hours, then replace with fresh, pre-warmed growth medium.
- At 24, 48, and 72 hours post-transfection, analyze cells via flow cytometry. Use untransfected cells as a negative control.
- Record the median fluorescence intensity (MFI) of the biosensor's donor channel (e.g., CFP) and the percentage of viable cells (via a viability dye).
Data Analysis: Calculate the SNR for each condition and time point. The optimal condition is the one that yields the highest product of (Transfection Efficiency %) * (Viability %) * (MFI), indicating a robust, high-expressing live cell population.
Table 1: Transfection Titration Results
| Condition | DNA (ng) | Reagent (µL) | Ratio (µL:µg) | Transfection Efficiency (%) | Viability (%) | Median Fluorescence Intensity (a.u.) | SNR (MFI/Background) |
|---|---|---|---|---|---|---|---|
| Untransfected | 0 | 0 | - | 0.1 | 98 | 105 | 1.0 |
| A | 250 | 0.5 | 2:1 | 45 | 95 | 1,850 | 17.6 |
| B | 250 | 1.0 | 4:1 | 78 | 90 | 4,200 | 40.0 |
| C | 250 | 2.0 | 8:1 | 85 | 75 | 4,500 | 42.9 |
| D | 500 | 1.0 | 2:1 | 65 | 88 | 3,100 | 29.5 |
Promoter Choice for Transcriptional Control
The promoter drives the expression level of the biosensor, directly impacting baseline fluorescence and dynamic range. Constitutive vs. inducible promoters offer different advantages for SNR.
Application Notes:
- Strong Constitutive Promoters (CMV, EF1α): Provide high signal but can lead to sensor overexpression, mislocalization, and cellular toxicity, increasing noise.
- Weaker/Moderate Promoters (PGK, SV40): Often yield lower but more physiologically relevant expression levels with improved SNR by reducing burden.
- Inducible/Tissue-Specific Promoters (TRE, Cre-dependent): Minimize leaky background expression and allow temporal control, dramatically improving SNR in target cell populations for FACS isolation.
Protocol: Evaluating Promoter-Driven Sensor Expression
Objective: To compare the SNR and cell health of a biosensor expressed under different promoters.
Procedure:
- Clone your biosensor cDNA into vectors containing CMV, EF1α, and PGK promoters. Include a fluorescent protein (e.g., mScarlet) as a transfection normalization control on a separate plasmid or via a P2A sequence.
- Co-transfect each biosensor plasmid (with different promoters) along with the normalization control plasmid into your target cell line at a fixed ratio, using the optimal transfection condition determined previously.
- Harvest cells 48 hours post-transfection.
- Analyze by flow cytometry. Gate on cells positive for the normalization control (mScarlet+). Within this gate, measure the median fluorescence intensity (MFI) of the biosensor's donor fluorophore and the cell viability.
- Calculate the Coefficient of Variation (CV) of the biosensor signal within the mScarlet+ population. A lower CV indicates more uniform expression (less noise).
Table 2: Promoter Performance Comparison
| Promoter | Relative Expression (MFI, norm. to PGK) | Signal CV (%) | Viability of Expressing Cells (%) | Recommended Use Case |
|---|---|---|---|---|
| CMV | 5.2 | 35 | 70 | High-throughput screens in robust cell lines |
| EF1α | 3.8 | 25 | 85 | General purpose, balanced SNR |
| PGK | 1.0 | 28 | 90 | Sensitive cells, primary cells, long-term assays |
| Inducible (Dox) | 0.1 (Uninduced) / 2.5 (Induced) | 20 | 88 | Temporal control, reducing leaky background |
Biosensor Tuning and Design
Intrinsic sensor properties—affinity, dynamic range, spectral profile, and localization—are the final determinants of SNR.
Application Notes:
- Affinity (Kd) Tuning: The sensor's Kd must match the expected physiological concentration of the analyte. A mismatched Kd (too high or too low) will saturate or fail to detect changes, flattening the response curve.
- FRET Sensor Optimization: For ratiometric FRET sensors, linkers between the sensing domain and fluorophores must be optimized to maximize conformational change-induced FRET efficiency change.
- Red-Shifted Sensors: Using orange/red fluorophores (e.g., miRFP670, mMaroon1) minimizes autofluorescence from cells and culture media, significantly boosting SNR in flow cytometry.
Protocol: Validating Sensor Affinity and Dynamic Range
Objective: To perform an in-cell titration to determine the apparent Kd and dynamic range of a novel biosensor.
Procedure:
- Transfert cells with the biosensor using optimal conditions.
- At peak expression, treat cells with a concentration gradient of a membrane-permeable analog or specific activator/inhibitor cocktail that clamps the analyte at known levels (e.g., cAMP analogs for a cAMP sensor, ionophores for ion sensors).
- For ratiometric sensors, acquire the donor and acceptor emission intensities via flow cytometry or a plate reader. Calculate the emission ratio (Acceptor/Donor).
- Plot the ratio (or normalized response) against the log of analyte concentration.
- Fit the data with a sigmoidal dose-response curve (four-parameter logistic) to determine the EC50 (apparent Kd) and the dynamic range (difference between plateau levels).
Table 3: Example Sensor Tuning Parameters
| Sensor Variant | Fluorophore Pair | Apparent Kd (nM) | Dynamic Range (ΔR/R0) | Best Excitation Laser | Autofluorescence Overlap |
|---|---|---|---|---|---|
| cAMP sensor v1 | CFP/YFP | 850 | 40% | 405 nm | High |
| cAMP sensor v2 (tuned) | CFP/YFP | 220 | 65% | 405 nm | High |
| cAMP sensor v3 (red-shifted) | mOrange/mCherry | 180 | 50% | 488 nm / 561 nm | Low |
| Ca2+ sensor (reference) | GCaMP6f | 375 | N/A (single FP) | 488 nm | Medium |
The Scientist's Toolkit
Table 4: Key Research Reagent Solutions
| Item | Function & Relevance to SNR Optimization |
|---|---|
| High-Fidelity DNA Polymerase | Ensures error-free biosensor plasmid amplification, preventing mutant-induced noise. |
| Endotoxin-Free Plasmid Prep Kits | Reduces cellular toxicity and non-specific immune activation during transfection. |
| Lipid/Nanoparticle Transfection Reagents | Enables efficient delivery with minimal cytotoxicity; different formulations optimized for various cell types. |
| Nucleofector/Kits & Electroporators | Critical for high-efficiency delivery into hard-to-transfect cells like primary T cells or neurons. |
| Fluorophore-Conjugated Viability Dyes | Allows exclusion of dead/dying cells (high autofluorescence) during FACS analysis, cleaning the signal. |
| Cell Culture-Grade DMSO | For preparing small molecule aliquots used in sensor validation assays (e.g., forskolin, ionomycin). |
| Titratable Inducer (e.g., Doxycycline) | Enables precise control of inducible promoter systems to minimize leaky expression. |
| Validated FACS Reference Beads | Provides stable fluorescence standards for daily cytometer calibration, ensuring data consistency. |
Experimental Workflow & Pathway Diagrams
Optimizing SNR for FACS Biosensors
Biosensor Signal and Noise Pathways
Managing Biosensor Perturbation and Cellular Toxicity
Within FACS-based biosensor research, the integrity of the readout is paramount. Biosensors, often comprising fluorescent proteins linked to responsive elements (e.g., for calcium, cAMP, or kinase activity), are inherently perturbative. Their expression and function can alter native cellular physiology, leading to artifacts in sorting and analysis. Furthermore, prolonged expression or high-intensity laser exposure during FACS can induce cellular toxicity, skewing population distributions and compromising downstream applications like drug screening. This document provides application notes and protocols to identify, quantify, and mitigate these critical issues.
Quantitative Assessment of Perturbation & Toxicity
Systematic evaluation is required to establish biosensor utility. Key metrics are summarized below.
Table 1: Key Metrics for Biosensor Perturbation and Toxicity Assessment
| Metric | Measurement Method | Typical Control | Acceptance Threshold (Example) | Implication of Exceeding Threshold |
|---|---|---|---|---|
| Basal Metabolic Rate | Seahorse Assay (OCR, ECAR) | Non-transfected / Wild-type cells | < 20% change from control | Altered energy metabolism, general stress. |
| Proliferation Rate | Cell counting, Incucyte imaging over 72h | Cells expressing inert fluorescent protein (e.g., GFP) | < 30% reduction vs. control | Biosensor interference with cell cycle or toxicity. |
| Apoptosis Induction | Annexin V / PI staining flow cytometry | Untreated cells of same line | < 15% early apoptotic cells at 48h post-transfection | Sensor or expression vector-induced cell death. |
| Endogenous Pathway Activity | Phospho-specific flow cytometry (e.g., pERK, pAKT) | Cells without biosensor, stimulated & unstimulated | < 25% change in median fluorescence intensity (MFI) shift | Biosensor is modulating the pathway it is designed to report. |
| FACS-Induced Stress | Post-sort viability dye (DAPI) staining & recovery culture | Pre-sort sample, mock-sorted sample | > 80% viability 24h post-sort | Laser exposure, shear stress, or sorting conditions are toxic. |
| Biosensor Expression Level | Fluorescence intensity (MFI) via flow cytometry | - | Coefficient of Variation (CV) < 30% for clonal population | High heterogeneity leads to noisy data; very high MFI may cause aggregation/toxicity. |
Experimental Protocols
Protocol 1: Assessing Biosensor Impact on Proliferation and Viability
Objective: To determine if biosensor expression alters cell growth and health over time. Materials: Biosensor-transfected cells, control cells (non-transfected or GFP-expressing), cell culture media, hemocytometer or automated cell counter, trypan blue, 6-well plates. Procedure:
- Seed triplicate wells of biosensor-expressing and control cells at identical densities (e.g., 50,000 cells/well in a 6-well plate).
- Every 24 hours for 72-96 hours, harvest and count cells from one well per cell line.
- For each count, mix 10µL of cell suspension with 10µL of trypan blue. Count live (unstained) and dead (blue) cells.
- Calculate total cell number and percentage viability for each time point.
- Plot growth curves and compare doubling times. A significant divergence indicates perturbation or toxicity.
Protocol 2: Evaluating Pathway Perturbation via Phospho-Flow Cytometry
Objective: To verify the biosensor does not artificially activate or inhibit its target pathway. Materials: Biosensor-expressing cells, control cells, pathway-specific stimulant and inhibitor, fixation buffer (e.g., 4% PFA), permeabilization buffer (100% ice-cold methanol or commercial saponin-based), fluorescently conjugated phospho-specific antibody, flow cytometry staining buffer. Procedure:
- Divide biosensor and control cells into three treatment groups: (a) Unstimulated, (b) Stimulated (e.g., with Forskolin for cAMP pathway), (c) Inhibited (e.g., with H-89 for PKA).
- Treat cells for the optimized time (e.g., 15 min), then immediately fix with 4% PFA for 15 min at room temp.
- Permeabilize cells: For methanol, add ice-cold 100% methanol to fixed cells, vortex, incubate ≥30 min at -20°C. For saponin-based, follow manufacturer's protocol.
- Centrifuge, wash, and resuspend cells in staining buffer. Add phospho-specific antibody (titrated beforehand) and incubate for 1h at RT in the dark.
- Wash cells and acquire on a flow cytometer. Analyze the median fluorescence intensity (MFI) of the phospho-signal in the biosensor-positive (and control) populations.
- Compare the fold-change between stimulated/unstimulated states in biosensor vs. control cells. Similar fold-changes indicate low perturbation.
Protocol 3: Quantifying FACS-Induced Stress and Recovery
Objective: To measure viability loss specifically attributable to the sorting process. Materials: Biosensor-expressing cells, standard FACS collection media (e.g., growth media + 25% FBS), viability dye (e.g., DAPI, 7-AAD), culture plates. Procedure:
- Prepare a single-cell suspension of biosensor-expressing cells. Keep a pre-sort aliquot (unsorted control).
- Perform FACS, gating on the desired biosensor-positive population. Collect sorted cells into rich recovery media.
- Also, perform a "mock sort": run cells through the sorter with all lasers on and the gate set to include all events, but collect the sample in the waste line, then retrieve it from the sample tube (sham-sorted control).
- Centrifuge all samples (pre-sort, sham-sorted, post-sort). Resuspend in buffer containing a viability dye (e.g., 1 µg/mL DAPI).
- Acquire on a flow cytometer or analyzer immediately to assess viability.
- Seed equal numbers of viable cells from each condition and monitor confluence over 48-72h to assess recovery.
Visualization of Key Concepts
Diagram 1: Sources of Biosensor Artifacts in FACS Research
Diagram 2: Biosensor Validation and Mitigation Workflow
The Scientist's Toolkit: Research Reagent Solutions
Table 2: Essential Reagents for Managing Perturbation & Toxicity
| Reagent / Material | Function / Purpose | Example Product/Catalog |
|---|---|---|
| Low-Titer Lentivirus | Enables low MOI (Multiplicity of Infection) transduction for low-copy, stable biosensor integration, minimizing overexpression artifacts. | Lenti-X Single Round Packaging Kits (Takara) |
| Clone Selection Media | For isolation of stable, monoclonal cell lines with uniform, moderate biosensor expression. | Puromycin, Blasticidin, or appropriate antibiotic. |
| Cell Viability Dyes (Fixable) | Distinguishes live/dead cells prior to fixation/permeabilization for intracellular staining protocols. | Fixable Viability Dye eFluor 455UV (Invitrogen) |
| Pathway-Specific Agonists/Antagonists | Positive and negative controls for validating biosensor response and testing pathway perturbation. | Forskolin (cAMP), Ionomycin (Calcium), Staurosporine (Kinase inhibition) |
| Cellular Health Assay Kits | Multiparametric kits to simultaneously measure apoptosis, cell cycle, and cytotoxicity. | CellEvent Caspase-3/7 Green, CyQUANT LDH Cytotoxicity Assay |
| FACS Collection Media | High-serum, possibly conditioned, media to support cell recovery post-sort. | Standard growth media supplemented with 25% FBS and 1x Pen/Strep. |
| Antioxidants (Post-Sort) | Added to recovery media to mitigate reactive oxygen species (ROS) generated during FACS. | N-Acetyl Cysteine (NAC, 1-5 mM) |
| ER Stress Inhibitors | Can be used pre-sort if biosensor expression is suspected to induce unfolded protein response. | Tauroursodeoxycholic acid (TUDCA) |
Within fluorescence-activated cell sorting (FACS) biosensor research, the precise interrogation of cellular signaling pathways demands rigorous instrument calibration. This Application Note details the optimization of three critical parameters—laser power, photomultiplier tube (PMT) voltage, and drop delay—to ensure accurate quantification and high-purity isolation of biosensor-expressing cell populations. Proper configuration minimizes spectral spillover, maximizes signal-to-noise ratios, and ensures sort precision, which are foundational for downstream drug development analyses.
In biosensor research, genetically encoded reporters (e.g., FRET-based Ca²⁺, cAMP, or kinase activity sensors) produce often subtle fluorescence shifts. The fidelity of detecting these changes via FACS hinges on instrument stability and calibration. Laser power and PMT voltage directly affect fluorescence resolution and spillover, while drop delay calibration is paramount for sort purity and yield, especially when isolating rare cells for functional drug screening.
Core Parameter Optimization: Protocols & Data
Laser Power and PMT Voltage: Titration for Signal-to-Noise
Objective: To determine the optimal laser power and PMT voltage that maximize the signal-to-noise ratio (S/N) for the biosensor's fluorescence channels while minimizing photobleaching and spillover.
Protocol: PMT Voltage Titration (at Fixed Laser Power)
- Prepare three samples: unstained cells, cells stained with a bright fluorophore (e.g., FITC for GFP channel), and biosensor-expressing cells.
- Set laser power to a standard level (e.g., 488nm laser at 50mW).
- For the target PMT (e.g., FITC/GFP), incrementally increase voltage (e.g., 50V steps from 300V to 800V).
- At each voltage, record the median fluorescence intensity (MFI) of the positive and negative populations.
- Calculate the S/N ratio: (MFIpositive - MFInegative) / (2 * SD_negative).
- Plot S/N vs. Voltage. The optimal voltage is typically at the plateau before the noise escalates disproportionately.
Protocol: Laser Power Titration (at Optimal PMT Voltage)
- Using the optimal voltage from above, prepare the same cell samples.
- Incrementally increase the laser power (e.g., 10mW steps from 20mW to 100mW).
- Record MFI and calculate S/N at each power level.
- Monitor spillover into adjacent detectors using compensation beads.
- The optimal point maximizes S/N while minimizing spillover increase and photobleaching (assessed by loss of signal over time).
Table 1: Exemplar Data from GFP Biosensor PMT Titration (488nm laser @ 50mW)
| PMT Voltage (V) | MFI (GFP+) | MFI (Neg) | SD (Neg) | S/N Ratio | Spillover into PE-A (%) |
|---|---|---|---|---|---|
| 400 | 5,200 | 520 | 28 | 83.6 | 0.5 |
| 500 | 18,500 | 550 | 31 | 290.3 | 1.2 |
| 600 | 65,000 | 600 | 35 | 919.6 | 2.8 |
| 700 | 210,000 | 700 | 50 | 2093.0 | 6.5 |
Note: Voltage 600V offers a high S/N with acceptable spillover for many applications.
Drop Delay Calibration: Ensuring Sort Precision
Objective: To empirically determine the precise number of droplets between the interrogation point and the break-off point where the sort decision is executed.
Protocol: Single-Cell Drop Delay Calibration
- Prepare Test Sample: Use brightly fluorescent beads or cells (e.g., high GFP expression).
- Set Up Sorter: Align the instrument and perform a droplet visualization to establish stable droplet streams.
- Run Sort Setup: Use the "Drop Delay" calibration feature on the sorter software.
- Empirical Test: a. Place a test tube with sheath fluid on the sort collection stage. b. Perform a test sort onto a microscope slide to confirm the stream location. c. The software will automatically or manually sort a defined pattern (e.g., a dot) at incremental drop delay values.
- Analysis: Examine the sorted pattern under a microscope. The correct drop delay is the value that places the sorted pattern precisely in the center of the target area.
- Validation: Sort a known mixture of fluorescent and non-fluorescent beads onto a slide. Assess purity under a microscope; aim for >95% bead purity.
Table 2: Impact of Drop Delay Error on Sort Purity & Recovery
| Drop Delay Error (Droplet) | Theoretical Purity (%) | Theoretical Yield (%) | Practical Outcome |
|---|---|---|---|
| -2 | <70 | <50 | Missed events, low yield |
| -1 | ~85 | ~75 | Reduced purity |
| 0 (Optimal) | >98 | >95 | High-purity, high-yield sort |
| +1 | ~85 | ~75 | Reduced purity |
| +2 | <70 | <50 | Contamination from unwanted cells |
The Scientist's Toolkit: Research Reagent Solutions
| Item | Function in FACS Biosensor Research |
|---|---|
| UltraComp eBeads / Compensation Beads | Antibody-capture beads used with fluorophore-conjugated antibodies to calculate spectral spillover and set compensation matrix accurately. |
| CellTrace Violet / CFSE | Live cell fluorescent dyes for proliferation tracking or as a viability/control marker during sorting optimization. |
| AccuCheck Counting Beads | Precisely sized fluorescent beads for verifying instrument alignment, drop delay, and sort efficiency. |
| FRET Biosensor Positive Control Cells | Genetically engineered cell lines stably expressing the biosensor in a constitutively active state, providing a consistent positive signal for setup. |
| Deionized, 0.22µm-filtered Sheath Fluid | Particle-free fluid essential for stable laminar flow and precise droplet formation, preventing clogs and sort artifacts. |
| Sort Collection Medium (e.g., 50% FBS in base medium) | High-protein medium to preserve cell viability and function during the stressful sorting process. |
| DNAse I (optional) | Added to collection tubes to prevent cell clumping due to DNA release from damaged cells. |
Visualizing Workflows and Relationships
Title: Laser and PMT Optimization Workflow for FACS
Title: Drop Delay Relationship in the Droplet Stream
Title: How Core Settings Impact Biosensor Research Outcomes
Application Notes
In the context of FACS-based biosensor research, achieving accurate, high-resolution cell sorting is paramount for downstream applications in drug discovery and mechanistic studies. A major challenge lies in mitigating artifacts that distort fluorescence signals, leading to population misidentification and compromised data integrity. This document addresses three critical artifact sources: photobleaching, substrate limitation for enzyme-based biosensors, and cell clumping. Effective management of these factors is essential for validating biosensor function and ensuring sort purity.
Photobleaching
Photobleaching, the irreversible loss of fluorescence due to photon-induced molecular damage, is a severe concern during prolonged sample analysis or sorting. For biosensors, especially those with low expression or dim fluorescence, photobleaching can lead to false-negative sorting or incorrect quantification of dynamic processes. The rate of photobleaching is influenced by laser power, exposure time, and the fluorophore's molecular structure.
Substrate Limitation
For biosensors utilizing enzyme-mediated fluorescence activation (e.g., β-lactamase, esterases), the exogenous substrate must be provided in non-limiting quantities. Insufficient substrate leads to signal depletion, causing a time-dependent decay in fluorescence that is indistinguishable from true biological quenching. This artifact misrepresents kinetic measurements and can invalidate dose-response assays in drug screening.
Cell Clumping
Cell aggregates pose a physical and analytical artifact. In FACS, clumps can block the fluidics nozzle, cause irregular stream breakdown, and be misidentified as single, high-fluorescence events. This results in sort contamination, inaccurate quantification of rare cell populations, and potential instrument failure.
Table 1: Quantitative Impact of Artifacts on FACS Sorting Purity
| Artifact | Typical Signal Reduction/Error Rate | Consequence on Sort Purity | Common Biosensors Affected |
|---|---|---|---|
| Photobleaching | 20-60% loss after 30s exposure | False negatives; loss of dim populations | FRET-based, GFP/RFP variants, chemical dyes |
| Substrate Limitation | Signal plateau & decay at [S] < 2x Km | Skewed kinetic data; false activity inhibition | β-Lactamase (CCF4), Fluo-4 AM (esterase), H2DCFDA |
| Cell Clumps (>2 cells) | 5-15% of total events in dense culture | Contamination up to 50% in sorted fraction | All cell-based biosensors |
Detailed Protocols
Protocol 1: Mitigating Photobleaching During FACS Analysis
Objective: To preserve fluorescence signal integrity during pre-sort analysis and sorting. Materials: Cells expressing fluorescence biosensor, ice-cold FACS buffer (PBS + 2% FBS + 25mM HEPES), 0.1% sodium azide (optional, for fixed endpoint), foil or low-light tubes. Procedure:
- Sample Preparation: Keep stained or live biosensor cells on ice or at 4°C in the dark from the point of harvesting. Use buffers containing 25mM HEPES for pH stability during analysis.
- Instrument Setup: Configure the sorter with the lowest possible laser power that yields a clear positive population signal. Perform compensation and gating swiftly.
- Sorting Parameters: Utilize a large nozzle (e.g., 100 µm) to allow lower system pressure and faster sort time, reducing cell transit time past the laser. Enable the "Cool Sample" option if available.
- Control: Include an aliquot of cells treated with 0.1% sodium azide (for non-live sorts) to control for time-dependent, non-bleaching signal loss. Compare mean fluorescence intensity (MFI) at time zero (T0) and after a 30-minute incubation at room temperature in the sorter.
- Data Validation: Plot MFI vs. Time on-stream. A significant downward slope indicates photobleaching; optimize by reducing laser voltage or using a more photostable fluorophore variant (e.g., SNAP-tag substrates, mNeonGreen).
Protocol 2: Ensuring Non-Limiting Substrate Conditions
Objective: To establish and validate that biosensor signal is not constrained by substrate availability. Materials: Biosensor cells, fluorogenic substrate (e.g., CCF4-AM, FDG), serial dilution of substrate in assay buffer, fluorescence plate reader or flow cytometer. Procedure:
- Km Approximation: Perform a substrate titration on a known positive biosensor cell line. Prepare cells at standard density (e.g., 1e6/mL) in assay buffer.
- Incubation: Aliquot cells into tubes containing a serial dilution of substrate (e.g., 0.1x, 0.5x, 1x, 2x, 5x, 10x the manufacturer's recommended concentration). Incubate under standard assay conditions (time, temperature, CO2).
- Measurement: Analyze fluorescence via flow cytometry. Plot Geometric Mean Fluorescence Intensity (Geo MFI) against substrate concentration [S].
- Validation: Identify the concentration where signal plateaus (saturation). The working concentration for all subsequent assays must be at least 2x this saturation point to ensure excess substrate throughout the experiment, including during longer sorts.
- In-Sort Check: For long sorts (>1 hour), consider adding fresh substrate to the collection tube medium if the biosensor reaction is reversible or ongoing.
Protocol 3: Preventing and Removing Cell Clumps
Objective: To achieve a single-cell suspension for reliable FACS gating and sorting. Materials: Biosensor cells, 40 µm cell strainer, DNAse I (1 U/mL), EDTA (5 mM in PBS), gentle dissociation reagent (e.g., Enzyme-free PBS-based), pipette tips with wide orifice. Procedure:
- Prevention at Harvest: Avoid over-trypsinization. Use enzyme-free, EDTA-containing buffer for detachment whenever compatible with cell health.
- Aggregate Dissociation: Resuspend the harvested cell pellet in FACS buffer containing 1 U/mL DNAse I to digest extracellular DNA from lysed cells that promotes clumping. Incubate for 5 minutes at RT.
- Mechanical Filtration: Gently pipette the cell suspension using a wide-orifice tip. Pass the entire sample through a pre-wet 40 µm sterile cell strainer cap into a fresh FACS tube.
- Verification: Run a low flow rate on the sorter and inspect the pulse-width vs. forward-scatter (FSC-W vs FSC-A) or time-of-flight plot. Gate strictly on the single-cell population, excluding any events with proportional height/area signals indicative of doublets or clumps.
- Maintenance: Keep the sample tube gently agitated on a sample mixer during sort setup to prevent settling and re-aggregation.
The Scientist's Toolkit: Research Reagent Solutions
Table 2: Essential Materials for Artifact Prevention in FACS Biosensor Assays
| Item | Function & Rationale |
|---|---|
| HEPES-buffered FACS Buffer (PBS+2%FBS+25mM HEPES) | Maintains physiological pH outside a CO2 incubator, preventing acidification-induced signal quenching. |
| DNAse I (Recombinant, RNase-free) | Degrades extracellular DNA to break apart cell clumps formed via DNA bridging, improving single-cell yield. |
| Cell Strainers (40 µm, nylon) | Removes large aggregates and debris pre-sort, preventing nozzle clogging and ensuring a clean event rate. |
| Fluorogenic Substrate (e.g., CCF4-AM, FDG) | Cell-permeable substrate for enzyme-activated biosensors. Must be used at validated, non-limiting concentrations. |
| Photostabilizing Reagents (e.g., OxyFluor, Trolox) | Scavenge oxygen radicals in media to reduce the rate of fluorophore photobleaching during extended imaging/sorting. |
| Viability Dye (e.g., Propidium Iodide, DAPI) | Distinguishes live from dead cells; dead cells cause non-specific substrate cleavage and increase clumping. |
| Nozzle Clean Solution (10% Bleach or 70% Ethanol) | For daily instrument decontamination to prevent biological carryover and ensure stable droplet breakoff. |
Diagrams
Title: Mechanism of Photobleaching Artifact in FACS
Title: Substrate Limitation Leads to False Inhibition Data
Title: Workflow to Prevent Cell Clumping for FACS
Post-Sort Viability and Functional Validation of Sorted Populations
Within fluorescence-activated cell sorting (FACS) biosensor research, the ultimate utility of sorted cell populations hinges on their post-sort viability and functional integrity. Isolating cells based on biosensor activity is only the first step; rigorous validation is required to confirm that the sorting process itself has not introduced artifacts and that the separated populations retain their expected biological functions. This application note details protocols and considerations for assessing post-sort health and conducting functional assays, critical for downstream analysis in drug discovery and basic research.
Critical Parameters Affecting Post-Sort Viability
The viability and functionality of sorted cells are influenced by multiple factors inherent to the FACS process.
| Parameter | Impact on Viability/Function | Mitigation Strategy |
|---|---|---|
| Shear Stress & Pressure | Can induce apoptosis, membrane damage, and cellular stress. | Use a large nozzle (e.g., 100µm), low system pressure (e.g., 20-25 PSI), and chilled, protective collection media. |
| Sort Duration & Time in Stream | Prolonged exposure to laser illumination and electrostatic deflection increases stress. | Pre-chill samples and collection tubes, use efficient sorting strategies (e.g., Purity mode), and minimize event rate to reduce abort rates. |
| Collection Media | Inadequate osmolarity, pH, or nutrients lead to rapid cell death. | Use complete growth media supplemented with 20-50% serum or 1-5% BSA, and HEPES buffer (e.g., 25mM). For sensitive cells, use specialized recovery media. |
| Temperature | Elevated temperature accelerates metabolism and stress response post-sort. | Maintain samples at 4°C before and during sorting using a chilled sample holder and collection apparatus. |
| Biosensor Excitation | Prolonged or intense laser exposure can cause phototoxicity (especially with biosensors like FRET-based or genetically-encoded calcium indicators). | Use the lowest laser power sufficient for detection, consider UV/viiolet-light minimizing dyes for viability, and use a sorter with efficient light collection. |
Protocol 1: Assessment of Post-Sort Viability and Yield
This protocol provides a standardized method to quantify the immediate impact of the sorting process.
Materials & Reagents
- Sorted cell population in collection media.
- Control, unsorted cell population from the same source.
Item Function Flow Cytometer For re-analysis of sorted population purity and viability staining. Automated Cell Counter (e.g., Countess II) For accurate determination of cell concentration and viability via trypan blue exclusion. Propidium Iodide (PI) or 7-AAD Membrane-impermeant dyes that selectively stain dead cells. Annexin V Binding Buffer Calcium-containing buffer for apoptosis detection via Annexin V assays. Annexin V, FITC conjugate Binds to phosphatidylserine exposed on the outer leaflet of apoptotic cells.
Procedure
- Immediate Post-Sort Analysis:
- Gently mix the sorted cell collection tube.
- Remove a small aliquot (e.g., 50-100 µL).
- For viability: Add PI or 7-AAD to the aliquot at the manufacturer's recommended concentration (e.g., 1 µg/mL PI). Incubate for 5-10 minutes on ice, protected from light.
- Analyze on a flow cytometer. Gate on the target population and calculate the percentage of PI-negative (viable) cells.
- Cell Counting and Yield Calculation:
- Mix the sorted sample thoroughly. Dilute 10-20 µL 1:1 with Trypan Blue stain.
- Load into a counting chamber and analyze with an automated cell counter.
- Record: Total cell count, viable cell concentration, and percent viability.
- Calculate Yield:
(Viable cell count post-sort) / (Theoretical count based on sort event log) x 100%.
- Apoptosis Assay (3-6 Hours Post-Sort):
- Pellet ~1x10^5 sorted cells (300 x g, 5 min).
- Wash once in 1X PBS.
- Resuspend cells in 100 µL of 1X Annexin V Binding Buffer.
- Add 5 µL of FITC-Annexin V and 5 µL of PI (or a viability dye compatible with your biosensor's fluorescence).
- Incubate for 15 minutes at room temperature in the dark.
- Add 400 µL of Binding Buffer and analyze by flow cytometry within 1 hour. Distinguish viable (Annexin V-/PI-), early apoptotic (Annexin V+/PI-), and late apoptotic/necrotic (Annexin V+/PI+) cells.
Protocol 2: Functional Validation of Sorted Biosensor Populations
Validating that the sorted cells retain their expected biosensor functionality and downstream biology is paramount.
Materials & Reagents
- Sorted high-biosensor (e.g., high FRET, high GFP) and low-biosensor activity populations.
- Control, unsorted population.
Item Function Live-Cell Imaging System For kinetic assessment of biosensor response in sorted populations. Cell Culture Incubator For maintaining cells during recovery and functional assays. Biosensor-Specific Agonist/Antagonist Pharmacological agent to modulate the pathway monitored by the biosensor (e.g., Forskolin for cAMP, Ionomycin for calcium). qPCR Reagents To validate transcriptional differences between sorted populations expected from biosensor activity. Seahorse XF Analyzer Reagents For evaluating metabolic function post-sort (e.g., mitochondrial stress test).
Procedure
- Short-Term Recovery and Re-analysis:
- After sorting, pellet cells gently and resuspend in pre-warmed complete growth media.
- Plate cells in an appropriate vessel (imaging dish, multi-well plate).
- Allow cells to recover for 4-24 hours in a standard culture incubator (37°C, 5% CO2).
- Re-analyze a sample of each population by flow cytometry to confirm that the sorted phenotype (e.g., fluorescence ratio) is maintained after recovery.
- Biosensor Responsiveness Assay:
- Plate sorted populations for live-cell imaging. Ensure adequate adhesion and spreading.
- Using the live-cell imaging system, establish a baseline biosensor signal (e.g., FRET ratio, fluorescence intensity) for 5-10 minutes.
- Add the pathway-specific agonist (e.g., 10 µM Forskolin for a cAMP biosensor) directly to the imaging medium.
- Continuously monitor the biosensor response for 30-60 minutes.
- Analysis: Compare the amplitude, kinetics, and percentage of responding cells between high and low sorted populations. The "high" population should show a more robust or prevalent response.
- Downstream Functional Correlates:
- Metabolic Profiling: 24 hours post-sort, perform a Seahorse XF Mitochondrial Stress Test on the sorted populations. Compare basal respiration, ATP production, and maximal respiratory capacity.
- Transcriptional Analysis: Extract RNA from sorted populations 6-12 hours post-sort. Perform qPCR for known transcriptional targets of the pathway monitored by the biosensor. Differences in gene expression should correlate with the biosensor-based sorting.
Data Presentation and Interpretation
Tabulate results from validation assays to provide a comprehensive view of sorted population quality.
Table 1: Representative Post-Sort Analysis Data
| Population | Sort Purity (%) | Immediate Viability (PI-, %) | 6h Apoptosis (Annexin V+/PI-, %) | Yield (%) | Post-Recovery Phenotype Stability (%) |
|---|---|---|---|---|---|
| High Biosensor Activity | 98.5 | 95.2 | 8.1 | 72.3 | 94.7 |
| Low Biosensor Activity | 97.8 | 94.7 | 9.4 | 70.8 | 93.9 |
| Unsorted Control | N/A | 96.5 | 4.2 | N/A | N/A |
Table 2: Functional Validation Results
| Assay | Parameter | High Activity Population | Low Activity Population | Expected Outcome Confirmed? |
|---|---|---|---|---|
| Biosensor Response | Max ΔFRET Ratio | 0.85 ± 0.12 | 0.21 ± 0.08 | Yes |
| Biosensor Response | % Responding Cells | 92% | 15% | Yes |
| Metabolic (Seahorse) | Basal OCR (pmol/min) | 128 ± 15 | 98 ± 11 | Yes (if pathway linked to metabolism) |
| qPCR | Target Gene X (Fold Change) | 5.2 ± 0.7 | 1.1 ± 0.3 | Yes |
Diagrams
Post-Sort Validation Workflow
Biosensor Pathway & Validation Targets
Validating FACS Biosensor Data and Comparing to Alternative Platforms
Within the context of FACS-based biosensor research, validating the functional readout of a biosensor is paramount. A robust validation framework integrates live-cell, high-throughput fluorescence data from FACS with high-resolution spatial data from microscopy and quantitative molecular data from biochemical assays. This multi-modal approach ensures that the fluorescence signal sorted by FACS accurately reports the intended cellular event (e.g., kinase activity, apoptosis, second messenger flux), thereby increasing confidence in downstream applications such as drug screening.
Core Validation Strategy & Workflow
The validation pipeline follows a convergent design where the same cell population or experimental conditions are analyzed using three complementary techniques.
Diagram: Triangulation validation workflow for FACS biosensors.
Detailed Protocols
Protocol 3.1: Correlative FACS and Confocal FRET Microscopy
Objective: To validate that FACS-based FRET biosensor sorting correlates with subcellular FRET efficiency measured by microscopy.
Materials:
- Cells expressing a FRET-based biosensor (e.g., CKAR, AKAR).
- FACS sorter equipped with 405nm, 448nm, and 561nm lasers.
- Confocal microscope with FRET capabilities and environmental control.
Procedure:
- Sample Preparation: Seed cells in a multi-well imaging plate. For stimulated samples, treat with relevant agonist/inhibitor (e.g., Forskolin for PKA biosensor).
- FACS Analysis & Sorting: Analyze cells using appropriate lasers and filters for donor (CFP, 475/30 nm) and acceptor (YFP, 542/27 nm) emission. Calculate the FRET ratio (YFP/CFP) in real-time. Sort top and bottom 10% of the FRET ratio population into separate tubes containing complete media.
- Immediate Correlative Imaging: Within 30 minutes of sorting, plate sorted cells onto poly-D-lysine coated glass-bottom dishes. Allow 2h for adherence.
- Confocal FRET Imaging: Image using a 458nm excitation laser. Collect CFP emission (470-500 nm) and FRET (YFP) emission (520-550 nm). Acquire images before and after addition of a maximal stimulus (e.g., 10µM Forskolin + 100µM IBMX for PKA).
- Data Analysis: Calculate pixel-by-pixel FRET ratio (FRET channel/CFP channel) for each sorted population. Compare the mean cellular FRET ratio from microscopy with the pre-sort FACS FRET ratio.
Protocol 3.2: Post-FACS Biochemical Validation via Western Blot
Objective: To biochemically validate the molecular state of cells sorted based on biosensor fluorescence.
Materials:
- Lysis Buffer (RIPA supplemented with protease/phosphatase inhibitors).
- Antibodies against the target analyte and its modified form (e.g., anti-pERK, anti-ERK).
- Pre-cast SDS-PAGE gels.
Procedure:
- Cell Sorting & Lysis: Sort 100,000-500,000 cells per population (e.g., high vs. low biosensor signal) directly into lysis buffer. Incubate on ice for 15 min, then centrifuge at 16,000 x g for 15 min at 4°C.
- Protein Quantification: Use a BCA assay to normalize protein concentrations.
- Western Blot: Load 20-30 µg of protein per lane. Perform SDS-PAGE and transfer to PVDF membrane. Block with 5% BSA for 1h.
- Immunoblotting: Probe with primary antibody (1:1000) overnight at 4°C. Use HRP-conjugated secondary antibody (1:5000) for 1h at RT. Develop with ECL reagent.
- Quantification: Use densitometry to calculate the ratio of modified/total protein (e.g., pERK/ERK). Compare this ratio between the high and low biosensor signal populations sorted by FACS.
The Scientist's Toolkit: Research Reagent Solutions
| Item | Function in Validation | Example/Product Note |
|---|---|---|
| Genetically Encoded FRET Biosensors | Live-cell reporters of signaling activity. Basis for FACS gating. | AKAR3 (PKA activity), CKAR (PKC activity). Cloned into FACS-optimized vectors. |
| Cell-Permeable Activators/Inhibitors | Provide positive/negative controls for biosensor response. | Forskolin (adenylyl cyclase activator), Staurosporine (broad kinase inhibitor). |
| Phospho-Specific Antibodies | Gold-standard for biochemical validation of kinase activity states. | Anti-phospho-Substrate (e.g., pCREB, pAkt Ser473). Critical for WB validation. |
| HRP-Conjugated Secondary Antibodies | Enable chemiluminescent detection in Western Blots. | Anti-rabbit IgG, HRP-linked. High sensitivity for low-abundance targets. |
| Protease & Phosphatase Inhibitor Cocktails | Preserve post-translational modification states during cell lysis. | Added fresh to lysis buffer to prevent dephosphorylation/degradation. |
| Matrigel / Poly-D-Lysine | Promote rapid adherence of FACS-sorted cells for correlative imaging. | Coat dishes prior to plating sorted cells to minimize stress and morphology changes. |
| ECL / Chemiluminescent Substrate | Generate light signal for detection of proteins on Western Blots. | SuperSignal West Pico or Femto for varying sensitivity needs. |
| FACS Tubes with Cell Strainer Caps | Ensure single-cell suspension for sorting, preventing clogs. | 5mL polystyrene round-bottom tubes with 35µm mesh caps. |
Data Integration & Presentation
Quantitative data from the three modalities should be compiled for direct comparison. Key correlations strengthen validation.
Table 1: Representative Validation Data for a PKA Activity Biosensor (AKAR3)
| Sample Population (Sorted by FACS) | Mean FACS FRET Ratio (YFP/CFP) | Mean Microscopy FRET Ratio (Post-Sort) | pCREB/CREB Ratio (WB Densitometry) | pPKA Substrate (ELISA, RFU) |
|---|---|---|---|---|
| Top 10% (High FRET) | 2.45 ± 0.15 | 2.32 ± 0.28 | 0.18 ± 0.03 | 1250 ± 210 |
| Bottom 10% (Low FRET) | 1.15 ± 0.09 | 1.22 ± 0.19 | 0.05 ± 0.01 | 320 ± 85 |
| Forskolin Stimulated (Control) | 3.80 ± 0.22 | 3.65 ± 0.31 | 0.95 ± 0.12 | 9800 ± 1100 |
| H-89 Inhibited (Control) | 0.90 ± 0.08 | 0.98 ± 0.15 | 0.02 ± 0.01 | 150 ± 45 |
Diagram: PKA pathway linking biosensor readout to biochemical validation.
Benchmarking Against Flow Cytometry (Non-Sorting) and Plate Reader Assays
Within the broader thesis on Fluorescence-Activated Cell Sorting (FACS) biosensor research, a critical step is the rigorous validation and benchmarking of novel biosensor constructs. Before advancing to complex, high-throughput cell sorting applications, researchers must first quantify biosensor performance—such as dynamic range, sensitivity, and specificity—using accessible, high-throughput analytical methods. Non-sorting flow cytometry (often simply "flow cytometry") and microplate reader (spectrophotometer) assays are two cornerstone techniques for this initial characterization. This document provides detailed application notes and protocols for benchmarking biosensor responses, enabling researchers to make informed decisions about which platform to use for specific assay needs and to validate data before committing resources to FACS-based sorting experiments.
Comparative Analysis: Core Metrics & Data
The choice between plate reader and flow cytometry assays depends on the experimental question, required resolution, and sample characteristics. The following table summarizes key benchmarking parameters.
Table 1: Benchmarking Plate Reader vs. Flow Cytometry for Biosensor Assays
| Parameter | Microplate Reader (Bulk Fluorescence) | Flow Cytometry (Non-Sorting, Single-Cell) | Implications for Biosensor Research |
|---|---|---|---|
| Throughput | High (96-, 384-, 1536-well). Fast kinetic reads. | Medium (~10^3-10^4 cells/sec). Slower per sample. | Plate reader ideal for initial ligand/compound screens; flow for detailed cell-population analysis. |
| Data Type | Population average. Single readout per well. | Single-cell multiparameter. Distributions per sample. | Flow reveals heterogeneity (e.g., bimodal response), critical for biosensor tuning and stability. |
| Information Depth | Low. Averages mask cell-to-cell variation. | High. Resolves subpopulations, co-expression, and complex phenotypes. | Essential for characterizing biosensor performance in mixed or partially transfected populations. |
| Sample Volume | Low (50-200 µL typical). | Higher (100-500 µL typical, requires cell suspension). | Plate reader conserves precious reagents; flow requires adequate cell numbers. |
| Cost per Sample | Low (consumables only). | Medium to High (instrument time, specialized tubes). | Plate reader cost-effective for large-scale, repeated measurements. |
| Temporal Resolution | Excellent for kinetics. | Possible with specialized setups (kinetic flow), but challenging. | Plate reader optimal for real-time biosensor activation/deactivation time courses. |
| Multiplexing Capacity | Spectral overlap limits 2-4 colors in fluorescence. | High (10+ parameters with modern cytometers). | Flow enables concurrent measurement of biosensor signal, cell cycle, surface markers, and viability. |
| Primary Application | High-throughput screening, kinetic assays, FRET/BRET ratio imaging. | Heterogeneity analysis, co-factor dependence, identification of responsive subpopulations. | Use plate reader for screening, flow for deep validation of biosensor function. |
Table 2: Quantitative Benchmarking Data from a Representative GPCR Biosensor Study
| Assay Method | Measured Metric | Biosensor System | Result (Mean ± SD) | Key Insight |
|---|---|---|---|---|
| Plate Reader (FRET Ratio) | Ligand EC₅₀ | cAMP FRET Biosensor | 8.3 ± 1.2 nM | Robust, stable signal suitable for antagonist screening. |
| Flow Cytometry (Median FRET) | Ligand EC₅₀ | cAMP FRET Biosensor | 9.1 ± 2.5 nM | Agreement with plate reader confirms bulk measurement validity. |
| Flow Cytometry | % Responsive Cells | cAMP FRET Biosensor (Transient Transfection) | 65.4 ± 8.7% | Reveals significant non-responder population masked in bulk read. |
| Plate Reader (Luminescence) | Z'-Factor (384-well) | NF-κB Luciferase Reporter | 0.72 | Excellent for high-throughput compound library screening. |
| Flow Cytometry (GFP) | CV of Basal Signal | Calcium Biosensor (GCaMP) | 25% | High cell-to-cell variability in expression affects threshold detection. |
Detailed Experimental Protocols
Protocol 1: Plate Reader-Based Kinetic Assay for a FRET Biosensor
Title: High-Throughput Kinetic Analysis of FRET Biosensor Activation.
Objective: To measure the real-time kinetics of biosensor response upon ligand stimulation in a population-averaged format.
Materials (Research Reagent Solutions):
- Cells: HEK293T cells stably or transiently expressing the FRET biosensor (e.g., Cameleon for Ca²⁺, Epac-based for cAMP).
- Assay Buffer: Hanks' Balanced Salt Solution (HBSS) with 20 mM HEPES, pH 7.4.
- Ligand/Agonist: Prepared as a high-concentration stock in DMSO or buffer, serially diluted in assay buffer.
- Control Compounds: Vehicle control (e.g., 0.1% DMSO), positive control agonist, possible inhibitor.
- Microplate: Black-walled, clear-bottom 96- or 384-well plate, tissue culture treated.
- Plate Reader: Equipped with dual emission monochromators or filters for FRET donor (e.g., CFP, Ex~430-440/Em~470-480) and acceptor (e.g., YFP, Em~530-540).
Procedure:
- Cell Seeding: Seed 50,000-100,000 cells/well (for 96-well) in complete growth medium. Culture for 24-48 hrs to reach ~80-90% confluence.
- Serum Starvation (if required): Replace medium with low-serum (0.5-1%) or serum-free medium 4-16 hours before assay to reduce basal activity.
- Buffer Exchange: Gently aspirate medium and wash cells once with 100 µL of pre-warmed (37°C) Assay Buffer. Add 80 µL of Assay Buffer per well.
- Plate Reader Setup: Pre-warm the plate reader chamber to 37°C. Configure the kinetic protocol:
- Excitation: 430-440 nm.
- Emission Reads: Donor channel (470-480 nm) and Acceptor channel (530-540 nm).
- Read Interval: 5-10 seconds.
- Total Duration: 300-600 seconds (5-10 min).
- Automated Injection: Program injector to add 20 µL of 5x concentrated ligand/agonist solution at time point 30-60 seconds.
- Assay Execution: Place plate in reader, start the kinetic protocol. The injector will add compound after baseline establishment.
- Data Analysis: For each well, calculate the FRET ratio (Acceptor Emission / Donor Emission) over time. Normalize ratios to the pre-stimulation baseline (e.g., Ratiosub>norm = R/Rsub>baseline). Plot kinetic traces and determine maximal response, tsub>1/2 of activation, and area under the curve (AUC).
Protocol 2: Flow Cytometry-Based Single-Cell Biosensor Validation
Title: Single-Cell Resolution Analysis of Biosensor Response and Heterogeneity.
Objective: To quantify biosensor response at the single-cell level, identify responding subpopulations, and correlate response with other cellular parameters.
Materials (Research Reagent Solutions):
- Cells: As in Protocol 1. Critical: Prepare a single-cell suspension.
- Staining Buffer: Phosphate-Buffered Saline (PBS) supplemented with 2% Fetal Bovine Serum (FBS) and 1 mM EDTA.
- Viability Dye: e.g., Fixable Viability Stain (FVS) near-IR, diluted in PBS.
- Fixative (Optional): 4% Paraformaldehyde (PFA) in PBS if sample fixation is required.
- Ligand/Agonist: As in Protocol 1.
- Tubes: 5 mL polystyrene round-bottom FACS tubes or 96-well U-bottom plates compatible with the cytometer sampler.
- Flow Cytometer: Equipped with lasers and filters suitable for CFP, YFP, FRET, and viability dye.
Procedure:
- Cell Preparation & Stimulation:
- Detach adherent cells using a gentle, enzyme-free method (e.g., PBS/EDTA). Resuspend in complete medium and rest for 30 min at 37°C.
- Count cells, aliquot 200,000-500,000 cells per stimulation condition into microcentrifuge tubes.
- Pellet cells (300 x g, 5 min), resuspend in 90 µL of pre-warmed Assay Buffer.
- Incubate cells in a 37°C water bath or thermoblock.
- At time zero, add 10 µL of 10x ligand/agonist solution, mix gently but quickly. Incubate for the desired time (e.g., 2, 5, 10 min).
- Reaction Termination & Staining:
- Immediately add 1 mL of ice-cold Staining Buffer to stop the reaction. Pellet cells (4°C, 300 x g, 5 min).
- (Optional Fixation): Resuspend in 100 µL of 4% PFA, incubate 15 min on ice. Wash with 2 mL Staining Buffer.
- Resuspend cell pellet in 100 µL of Staining Buffer containing the appropriate dilution of Viability Dye. Incubate for 20-30 min on ice, protected from light.
- Wash with 2 mL Staining Buffer, then resuspend in 300-500 µL of Staining Buffer for analysis. Keep samples on ice and in the dark.
- Flow Cytometry Acquisition:
- Calibrate the cytometer using appropriate beads.
- Create a plot for FSC-A vs. SSC-A to gate on cells. Exclude doublets using FSC-H vs. FSC-A.
- Create a viability dye vs. FSC-A plot to gate on live, single cells.
- For FRET measurement, set up a plot of Donor (e.g., Pacific Blue/AmCyan channel) vs. Acceptor (e.g., FITC/GFP channel). The FRET signal can be analyzed as the ratio of median fluorescence intensity (MFI) in the acceptor channel to the donor channel on a per-cell basis, often visualized on a density plot.
- Acquire at least 10,000 events within the live, single-cell gate.
- Data Analysis: Export MFI values or use cytometry software to calculate the median FRET ratio per sample. Use histogram overlays to visualize response distributions. Apply gating on the FRET ratio to calculate the percentage of "responsive" cells (e.g., cells with a ratio >2 SD above the unstimulated control mean).
Visualizations
Title: Benchmarking Workflow: Plate Reader vs. Flow Cytometry
Title: FRET Biosensor Mechanism & Readout Pathway
The Scientist's Toolkit: Essential Research Reagents & Materials
Table 3: Key Reagents for Biosensor Benchmarking Assays
| Item | Function & Role in Benchmarking | Example Product/Catalog |
|---|---|---|
| FRET/GFP Biosensor Construct | The core molecular tool. Encodes donor and acceptor fluorophores linked by a biologically sensitive domain. | pcDNA3.1-Epac-S^H^150 (cAMP), pCAG-GCaMP6s (Ca²⁺). |
| Cell Line | A consistent cellular background for biosensor expression and response. | HEK293T (high transfection), CHO-K1 (low background), primary T-cells (physiological relevance). |
| Transfection Reagent | For introducing biosensor DNA into cells for transient expression. | Lipofectamine 3000, Polyethylenimine (PEI), Nucleofector Kits (for hard-to-transfect cells). |
| Assay Buffer (Phenol Red-free) | Maintains pH and ion homeostasis during live-cell imaging. Lack of phenol red reduces autofluorescence. | HBSS with HEPES, Live Cell Imaging Solution. |
| Reference Agonist | A well-characterized, potent activator of the target pathway. Serves as a positive control for biosensor function. | Forskolin (adenylyl cyclase activator for cAMP), Ionomycin (Ca²⁺ ionophore). |
| Reference Antagonist/Inhibitor | Validates biosensor specificity by blocking the response to agonist. | H-89 (PKA inhibitor), BAPTA-AM (calcium chelator). |
| Viability Dye | Distinguishes live from dead cells in flow cytometry, ensuring analysis is on healthy, responsive cells. | Fixable Viability Stain 780 (FVS780), Propidium Iodide (PI). |
| FACS Tubes & Plates | Low-binding, sample containers compatible with cytometer fluidics to prevent cell loss and clogging. | 5 mL Polystyrene Round-Bottom Tubes, 96-well U-bottom Microplates. |
| Calibration Beads | For daily quality control and compensation of the flow cytometer, ensuring fluorescence measurement accuracy. | CS&T Beads (BD), Rainbow Calibration Particles (Spherotech). |
| Data Analysis Software | For processing raw fluorescence into quantitative metrics (ratios, median intensities, % positive). | FlowJo, FCS Express, GraphPad Prism, custom Python/R scripts. |
Within the context of a thesis on FACS-based biosensor research, selecting an appropriate single-cell sorting platform is critical. This analysis compares Fluorescence-Activated Cell Sorting (FACS) and modern microfluidics-based platforms, providing application notes and detailed protocols for researchers in drug development.
Table 1: Core Performance Metrics Comparison
| Parameter | High-Speed FACS (e.g., BD FACSAria III) | Microfluidic Chip-Based Sorter (e.g., Berkeley Lights Beacon) |
|---|---|---|
| Max Sort Rate | Up to 70,000 events/sec | Typically 100 - 10,000 events/hr |
| Typical Purity | >98% | >95% |
| Typical Viability | 80-95% (post-sort) | Often >95% (gentler fluidics) |
| Cell Size Range | 1-60 µm | 5-40 µm (chip nozzle dependent) |
| Multiplexing (Colors) | High (18+ parameters) | Moderate (typically 1-4 fluorescence channels) |
| Single-Cell Dispensing | Into tubes, plates (96/384-well) | Precise nanoliter dispensing into chambers/wells |
| Shear Stress on Cells | Moderate-High (nozzle pressure) | Low (microfluidic flow) |
| Reagent Consumption | High (mL/min sheath fluid) | Very Low (µL volumes) |
| Initial Instrument Cost | Very High ($250K-$750K) | High ($150K-$400K) |
| Per-Run Consumable Cost | Low (tubes, sheath) | High (proprietary chips) |
Table 2: Application-Specific Suitability
| Application | Recommended Platform | Key Rationale |
|---|---|---|
| High-Throughput Immune Cell Profiling | FACS | Speed, high-parameter phenotyping |
| Rare Cell Isolation (<0.01%) | FACS | High input cell number processing |
| Single-Cell Cloning for Antibody Discovery | Microfluidics | Gentle handling, integrated culture & assay |
| Sorting of Large or Sensitive Cells (e.g., Neurons) | Microfluidics | Lower shear stress, better viability |
| Intracellular Signaling Biosensor Studies | Microfluidics | Integrated live-cell imaging post-sort |
| Preparing Libraries for Single-Cell Sequencing | Both (plate-based sorting) | Depends on required throughput and budget |
Experimental Protocols
Protocol 1: Sorting GFP+ Cells Using a High-Speed FACS for Downstream Biosensor Assay
Objective: Isolate live, GFP-positive cells from a heterogeneous suspension for subsequent culture and biosensor response profiling.
Materials: See "Scientist's Toolkit" section. Procedure:
- Sample Preparation: Harvest cells expressing a GFP-tagged biosensor of interest. Resuspend at 5-10 x 10^6 cells/mL in ice-cold, protein-rich sorting buffer (e.g., PBS + 2% FBS + 1mM EDTA). Filter through a 35-µm cell strainer.
- Instrument Setup & Sterilization: Perform routine start-up and fluidics sterilization (e.g., with 10% bleach followed by DI water and sheath fluid flush). Install a 100-µm nozzle.
- Alignment & Calibration: Run alignment beads to optimize laser delay and drop delay. Calibrate fluorescence detection using rainbow beads or single-color controls.
- Gating Strategy Development: Load an unstained control and a GFP-positive control sample.
- Create a FSC-A vs. SSC-A plot to gate on the primary cell population.
- Apply a single-cell gate using FSC-H vs. FSC-A to exclude doublets.
- Use the unstained sample to set a viability dye (e.g., DAPI) gate to exclude dead cells.
- Set the GFP-positive gate on the viable, single-cell population using the positive control (typically >10^3 fluorescence intensity above unstained).
- Sort Setup: Set sort mode to "Purity 1.0." Choose the collection device (e.g., 15-mL tube with collection media). Verify sort timing using test droplets.
- Sort Execution: Run the experimental sample. Monitor sort rates and abort if clogs occur or pressure fluctuates.
- Post-Sort Collection & Analysis: Centrifuge collected cells. Plate for immediate assay or culture. Re-analyze a small aliquot of sorted cells to confirm purity and viability.
Protocol 2: Isoclonal Line Generation Using a Microfluidic Workflow
Objective: Sort single, antigen-specific B-cells into nanochambers for clonal expansion and antibody secretion analysis.
Materials: See "Scientist's Toolkit" section. Procedure:
- Chip Priming: Mount a sterile, optical assay pod (chip) onto the instrument. Follow manufacturer protocol to prime all channels with priming buffer using onboard pneumatic pumps.
- Cell Sample & Reagent Loading: Load the prepared B-cell suspension (1-5 x 10^6 cells/mL in proprietary medium) into the designated sample reservoir. Load assay media, staining antibodies, and detection reagents into their respective reservoirs.
- On-Chip Cell Staining & Washing: Use instrument software to flow cells into the main circuit. Perform a series of wash steps. Flow through fluorescently labeled antigen probes to stain antigen-specific B-cells. Perform further wash steps to remove unbound probe.
- Imaging & Selection: Perform a full brightfield and fluorescence scan of the chip. Use software to identify all single cells based on brightfield morphology. Within the single-cell population, identify fluorescently labeled (antigen-specific) target cells.
- Single-Cell Dispensing: Select target cells. The instrument uses proprietary opto-electronic or gentle pressure technology to selectively move each target cell into an individual nanochamber pre-filled with culture medium and feeder cells.
- Clonal Expansion & Monitoring: Place the entire chip into the integrated incubation system. Monitor clonal growth via daily automated brightfield imaging. After 5-7 days, assay supernatant in each chamber for antibody titer via an on-chip immunoassay step.
- Retrieval: Select high-producing chambers. Use the instrument to export specific clones into a standard 96-well plate for further expansion.
The Scientist's Toolkit
Table 3: Key Research Reagent Solutions
| Item | Function | Example Product/Catalog # |
|---|---|---|
| Cell Sorting Buffer | Maintains cell viability, prevents clumping during FACS. | PBS (Ca/Mg-free) + 0.5-2% BSA/FBS + 1mM EDTA. |
| High-Affinity, Low-Volume Antibodies | For phenotyping with minimal reagent use on microfluidic platforms. | BioLegend TotalSeq antibodies, BD Horizon Brilliant reagents. |
| Viability Dye (Fixable) | Distinguishes live/dead cells; critical for sort purity. | Thermo Fisher LIVE/DEAD Fixable Viability Dyes, Zombie dyes (BioLegend). |
| Proprietary Microfluidic Media | Supports on-chip cell health, growth, and function. | Berkeley Lights Opto Serum-Free Medium. |
| Standardized Calibration Beads | Align instruments, calibrate fluorescence detectors. | BD CS&T Beads, Spherotech 8-Peak UV beads. |
| Sterile, Cell-Recovery Media | High-serum media to support sorted cell recovery. | RPMI 1640 + 20% FBS + 1% Pen/Strep. |
| Anti-Adhesion Reagent | Coats collection tubes to minimize sorted cell loss. | STEMCELL Technologies Recovery Cell Culture Freezing Medium. |
| Nuclease-Free Collection Tubes/Plates | For collecting sorted cells for genomics applications. | Eppendorf DNA LoBind tubes, Bio-Rad Hard-Shell PCR plates. |
Visualizations
Assessing Throughput, Multiplexing Capability, and Cost-Effectiveness.
Within the broader thesis on Fluorescence-Activated Cell Sorting (FACS) biosensor research, the evaluation of throughput, multiplexing capability, and cost-effectiveness is paramount. FACS biosensors are engineered cellular reporters that convert a biological event (e.g., protein-protein interaction, kinase activation, apoptosis) into a quantifiable fluorescent signal, enabling the isolation of rare cell populations based on dynamic functional responses. As the field advances towards more complex physiological models and screening applications, systematically assessing these three pillars ensures the selection of optimal biosensor configurations and experimental platforms, balancing data richness with practical constraints in drug discovery and basic research.
Quantitative Comparison of Key Platforms
The choice of platform dictates the feasible experimental scale and data dimensionality. The table below compares core technologies used in FACS biosensor analysis.
Table 1: Platform Comparison for FACS Biosensor Analysis
| Platform | Approximate Throughput (Cells/Hour) | Multiplexing Capability (Parameters) | Relative Cost per Sample | Key Application in Biosensor Research |
|---|---|---|---|---|
| Traditional Benchtop Sorter | 10,000 - 25,000 | Medium (2-4 fluorescent proteins + scatter) | $$ | Clone validation, low-complexity population isolation. |
| High-Speed Cell Sorter | 70,000 - 100,000+ | High (4-10+ fluorescent parameters) | $$$ | High-throughput screening (HTS) of biosensor libraries, rare event detection. |
| Plate-Based Flow Cytometer | 5,000 - 10,000 | High (8-50+ parameters) | $ | High-content multiplexed endpoint analysis, dose-response profiling. |
| Microfluidic Single-Cell Sorters | 1,000 - 10,000 | Low-Medium (1-4 parameters) | $$ | Sorting for integrated genomics (scRNA-seq), fragile cells. |
| Imaging Flow Cytometer | 1,000 - 5,000 | Medium (4-6 fluorescent + morphological) | $$$ | Spatial biosensor validation (e.g., translocation), co-localization analysis. |
Experimental Protocols
Protocol 1: Multiplexed Biosensor Titering & Validation
Aim: To determine optimal biosensor expression levels and validate specificity before large-scale sorting. Materials: Cell line expressing the biosensor (e.g., FRET-based caspase sensor), transfection reagent, control plasmids (positive/negative), validation compounds (e.g., staurosporine for apoptosis), flow cytometry buffer. Procedure:
- Transfection: Seed HEK293T cells at 70% confluence in a 12-well plate. Transfect with a titration (e.g., 0.5, 1.0, 2.0 µg) of biosensor plasmid using a polyethylenimine (PEI) protocol.
- Induction & Harvest: At 48h post-transfection, treat cells with validation compound or DMSO control for the required time (e.g., 6h for apoptosis). Harvest cells using gentle trypsinization, quench with serum-containing media, and pellet.
- Staining & Fixation: Resuspend pellet in flow buffer. Optional: Fix cells with 2% PFA for 15min on ice if later analysis is required. Wash twice.
- Acquisition: Analyze on a plate-based cytometer. Acquire a minimum of 10,000 events per sample. Record fluorescence intensities for all biosensor channels (e.g., CFP, YFP for FRET) and a viability dye.
- Analysis: Calculate the signal-to-noise ratio (SNR) for each transfection condition: SNR = (Mean Fluorescence Intensity (MFI) of Induced Sample) / (MFI of Uninduced Control). Select the transfection condition yielding the highest SNR for subsequent sorts.
Protocol 2: High-Throughput Drug Screening with a FACS Biosensor
Aim: To screen a compound library for modulators of a pathway using a FACS biosensor readout. Materials: Biosensor-stable cell line, 384-well compound library, automated liquid handler, high-speed cell sorter equipped with plate sampler, cell culture media. Procedure:
- Cell Dispensing: Using an automated dispenser, seed biosensor cells into 384-well assay plates at 5,000 cells/well in 40µL media. Incubate overnight.
- Compound Addition: Pin-transfer or acoustically dispense compounds from the library (typically at 100nL to 1µL volume) to achieve desired final concentration (e.g., 1µM). Include DMSO-only control wells and control compound wells (positive/negative) on each plate.
- Incubation: Incubate plates for the predetermined assay time (e.g., 24h) at 37°C, 5% CO2.
- Preparation for Sorting: Add 20µL of trypsin/EDTA to each well using a multidispenser. Incubate 15min at 37°C. Add 40µL of flow buffer containing a viability dye (e.g., propidium iodide) to quench.
- High-Throughput Sorting: Load plates onto the high-speed sorter with plate adapter. Configure the gating strategy: Gate 1 (Cells) on FSC-A vs SSC-A → Gate 2 (Singlets) on FSC-H vs FSC-A → Gate 3 (Viable) on viability dye negative → Gate 4 (Biosensor Positive) on the relevant fluorescence channel(s). Sort the top/bottom 10-15% of responding cells from each well into a 96-well recovery plate.
- Hit Validation: Culture sorted cells, expand, and re-test hits in a secondary, dose-response assay using Protocol 1.
Diagrams
Title: High-Throughput FACS Biosensor Screening Workflow
Title: Biosensor Signaling Pathway & FACS Readout
The Scientist's Toolkit: Key Research Reagent Solutions
Table 2: Essential Materials for FACS Biosensor Experiments
| Item | Function in FACS Biosensor Research |
|---|---|
| Polyethylenimine (PEI) Max | Efficient, low-cost transfection reagent for plasmid delivery into biosensor cell lines during development and titering. |
| Cell Viability Dye (e.g., Propidium Iodide, DAPI) | Distinguishes live from dead cells during sorting to ensure collection of healthy, responsive populations. |
| Bovine Serum Albumin (BSA) / Fetal Bovine Serum (FBS) | Added to flow cytometry buffer (PBS) to reduce cell clumping and non-specific binding during sort procedures. |
| Validated Control Agonists/Antagonists | Pharmacological tools essential for establishing biosensor dynamic range (Z'-factor) and validating each sort experiment. |
| Recovery Media (e.g., 50% FBS + Antibiotics) | High-serum media used in collection tubes to maximize cell viability post-sort for downstream culture or analysis. |
| BD FACSChorus Software or Equivalent | Advanced sort setup software enabling complex, multiplexed gating logic essential for isolating biosensor-defined populations. |
| 384-Well, V-Bottom, Polypropylene Plates | Ideal assay plate format for cell-based assays and compatible with high-throughput sorters' plate loaders. |
| Single-Cell RNA-Seq Kit (e.g., 10x Genomics) | Downstream analysis kit for molecular profiling of sorted biosensor-positive populations, enabling deep mechanistic insight. |
Data Reproducibility and Standards for Reporting FACS Biosensor Experiments
Fluorescence-Activated Cell Sorting (FACS) biosensor experiments are pivotal in modern cell biology and drug discovery, enabling the real-time, quantitative analysis of dynamic cellular processes like kinase activity, second messenger fluxes, and protein-protein interactions in heterogeneous populations. However, the complexity of these live-cell assays, combined with the technical nuances of flow cytometry, introduces significant challenges to data reproducibility. In the context of a broader thesis on advancing FACS biosensor methodologies, this document establishes application notes and standardized protocols designed to ensure robust, reliable, and comparable data across laboratories.
Foundational Standards and Reporting Frameworks
Adherence to community-developed reporting standards is the first critical step. Key frameworks include:
- MIAME (Minimum Information About a Microarray Experiment): While for microarrays, its principles of detailed metadata reporting are foundational.
- MIFlowCyt (Minimum Information about a Flow Cytometry Experiment): The core standard for any flow cytometry experiment. It mandates reporting of five key elements: 1) Experiment Overview, 2) Sample Description, 3) Instrument Details, 4) Data Analysis Details, and 5) Experimental Results.
- ARRIVE Guidelines (Animal Research: Reporting of In Vivo Experiments): Essential for preclinical studies involving animal-derived cells or in vivo biosensor applications.
For FACS biosensor experiments specifically, reporting must extend beyond these to include:
- Biosensor Characterization: Full genetic construct details (vector, promoter, FRET pair/marker), calibration procedures (e.g., ionomycin/ionomycin + EDTA for Ca²⁺ sensors), and specificity validation (e.g., pharmacological inhibitors, siRNA knock-down).
- Gating Strategy Justification: A clear, hierarchical gating logic for live, single cells, and sensor-positive populations must be diagrammed and justified.
- Sorting Parameters: When sorting is performed, details on nozzle size, sheath pressure, sort mode (purity/yield), drop delay calibration, and collection media must be documented.
- Data Transformation and Normalization: Explicit description of how raw fluorescence intensities (FIs) are processed (e.g., background subtraction, ratiometric calculation, fold-change over baseline).
Note: Impact of Gating Consistency on Reproducibility
Inconsistent gating is a primary source of variation. The following table summarizes population statistics from a replicated experiment analyzing a FRET-based ERK biosensor in HEK293 cells, demonstrating the effect of gate placement.
Table 1: Effect of Gating Strategy on Reported ERK Biosensor Activity
| Gating Strategy Variant | Live Cells (%) | Single Cells (%) | Sensor+ (%) | Mean Ratiometric (FRET/Donor) | Coefficient of Variation (CV%) |
|---|---|---|---|---|---|
| Stringent (Conservative) | 92.1 ± 2.3 | 98.5 ± 0.5 | 85.4 ± 3.1 | 2.45 ± 0.08 | 8.2 |
| Permissive (Broad) | 95.5 ± 1.8 | 99.1 ± 0.2 | 95.8 ± 1.5 | 2.15 ± 0.21 | 18.7 |
| No Single-Cell Gate | 92.0 ± 2.4 | N/A | 84.9 ± 3.2 | 1.98 ± 0.34 | 25.5 |
Data from n=5 independent replicates. Stringent gating uses clear separation from debris/aggregates, while permissive gating includes marginal events.
Note: Instrument Calibration & Standardization
Day-to-day instrument variation must be controlled. Using standardized calibration beads ensures inter-experimental comparability.
Table 2: Daily Calibration Metrics for a 3-Laser Flow Cytometer
| Calibration Bead Type | Target Parameter | Acceptable Range | Day 1 Value | Day 2 Value | Pass/Fail |
|---|---|---|---|---|---|
| Rainbow Beads | Laser Delay Alignment | CV < 3% | 2.1% | 2.8% | Pass |
| Anti-Mouse Ig κ / PE | PMT Voltage (PE Channel) | MFI = 35,000 ± 1,500 | 34,850 | 36,200 | Pass |
| Unstained Beads | Background (FITC Channel) | MFI < 300 | 275 | 310 | Flag |
| Cytometer Setup & Tracking (CST) | Overall Performance | Assigned Metric = 1.0 ± 0.1 | 0.98 | 1.05 | Pass |
MFI: Median Fluorescence Intensity. A "Flag" indicates a check is required but may be within acceptable noise limits depending on the experiment.
Detailed Experimental Protocols
Protocol: Validating a cAMP Biosensor Response Using FACS
Objective: To reproducibly quantify Forskolin-stimulated cAMP dynamics in live Jurkat T-cells expressing a Epac-based FRET biosensor.
The Scientist's Toolkit: Key Reagents & Materials
| Item | Function/Justification |
|---|---|
| Jurkat cells expressing Epac-camps | Stable cell line ensures consistent biosensor expression. |
| Forskolin (in DMSO) | Direct adenylate cyclase activator; positive control. |
| IBMX (3-isobutyl-1-methylxanthine) | Phosphodiesterase inhibitor; amplifies and sustains cAMP signal. |
| Hanks' Balanced Salt Solution (HBSS) with 1% FBS | Physiological sorting/buffer medium reduces stress. |
| 1.5 mL Polypropylene Collection Tubes with 500 μL FBS | Serum cushions cells during sort collection, enhancing viability. |
| 120 μm Nozzle | Optimal for mammalian cell lines; balances speed and cell integrity. |
| 8-peak UV Rainbow Calibration Beads | Validates 405nm laser alignment and UV/ Violet PMTs for CFP excitation. |
| Propidium Iodide (PI) or DAPI | Vital dye for live/dead discrimination. |
Methodology:
- Preparation: Harvest and wash Jurkat-Epac cells twice in warm HBSS + 1% FBS. Resuspend at 2 x 10⁶ cells/mL. Keep at 37°C until acquisition.
- Stimulation: Aliquot 500 μL cell suspension per condition. Pre-incubate with 100 μM IBMX for 5 min at 37°C. Add Forskolin (10 μM final) or DMSO vehicle, mix gently, and incubate for exactly 10 minutes.
- Instrument Setup: Calibrate using CST or rainbow beads. Configure channels for CFP (ex405/em475), YFP (ex405/em535), and FRET (ex405/em535). Adjust voltages so unstimulated cell ratios are centered. Set a low flow rate (≤500 events/sec).
- Acquisition & Gating:
- Create FSC-A vs. SSC-A gate to exclude debris.
- Gate single cells using FSC-H vs. FSC-A.
- Gate live cells by excluding PI+ (or DAPI+) events.
- Gate biosensor-positive cells using CFP+ signal from unstimulated controls.
- For each experimental sample, acquire ≥10,000 gated live, single, sensor+ events.
- Data Export: Export the median fluorescence intensity (MFI) for the CFP and FRET (YFP) channels for the final gated population from listmode files (e.g., .fcs). Do not rely on plotted ratios from instrument software.
- Analysis: Calculate the FRET/CFP ratio (R) for each replicate. Normalize data as (Rsample / Runstimulated) to present Fold-Change in cAMP.
Protocol: FACS Sorting Based on Biosensor Activity for Downstream -omics
Objective: Isolate live HEK293 cells exhibiting high vs. low activity of a biosensor for NF-κB translocation for subsequent RNA-seq.
Methodology:
- Sample Prep: Stimulate cells with TNF-α (20 ng/mL) for 45 min. Include unstimulated control. Prepare a single-cell suspension using gentle enzymatic dissociation.
- Control Tubes: Prepare three indispensable controls: 1) Unstained, unstimulated cells (autofluorescence), 2) Unstimulated biosensor cells (negative/ baseline), 3) Stimulated biosensor cells (positive population identifier).
- Sort Setup: Sterilize instrument line and sort chamber. Use a 100 μm nozzle for HEK293s. Perform drop delay calibration using Accudrop beads. Set sort mode to "Purity."
- Gating & Sort Gates: Apply standard live/single/sensor+ gates. Create a final 1D histogram of the biosensor readout (e.g., nuclear/cytoplasmic ratio). Set conservative, non-overlapping sort gates to collect the top 10% (High) and bottom 10% (Low) of the stimulated population.
- Collection: Sort at least 50,000 cells per population directly into collection tubes containing 500 μL of RNase-free FBS or lysis buffer (e.g., RLT plus). Keep samples on ice.
- Post-Sort Validation: Reacquire a small aliquot (~500 cells) from each collected population to confirm sort purity (>95% target population).
- Downstream Processing: Immediately proceed to RNA isolation using a column-based kit with on-column DNase treatment.
Visualizing Workflows and Signaling Pathways
Diagram 1: Standardized FACS Biosensor Workflow
Diagram 2: cAMP Biosensor Signaling Pathway
Diagram 3: FACS Biosensor Data Analysis Pipeline
Conclusion
FACS biosensors represent a powerful convergence of molecular engineering and cell analysis, transforming flow cytometers from phenotyping instruments into functional cell sorters. By mastering the foundational principles, robust methodological integration, and rigorous troubleshooting outlined, researchers can unlock unprecedented capabilities in high-throughput functional genomics, drug discovery, and cellular engineering. The future lies in developing more multiplexed, non-perturbative biosensors and integrating them with downstream multi-omics analysis of sorted cells. As validation standards mature, FACS biosensor data will become increasingly integral to translational research, enabling the direct isolation of cells based on dynamic physiological states, a critical step toward personalized diagnostics and cell therapies.