Engineering Microbial Cell Factories: The Future of Sustainable Lipid Production for Biomedicine
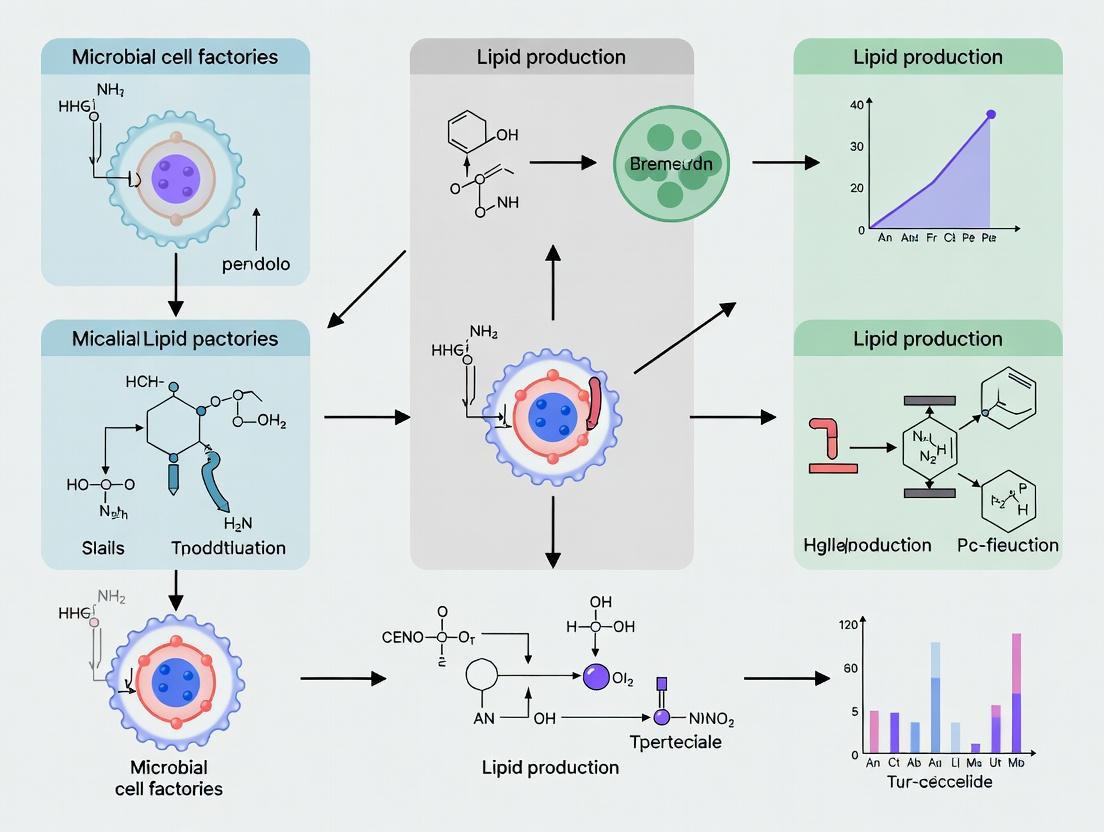
This article explores the cutting-edge development of engineered microbial cell factories for the sustainable production of high-value lipids.
Engineering Microbial Cell Factories: The Future of Sustainable Lipid Production for Biomedicine
Abstract
This article explores the cutting-edge development of engineered microbial cell factories for the sustainable production of high-value lipids. Targeting researchers and biotech professionals, it provides a comprehensive analysis spanning from foundational biology and host selection (Intent 1) to advanced genetic engineering and fermentation methodologies (Intent 2). It addresses critical challenges in yield, scalability, and contamination (Intent 3), and offers a rigorous framework for validating strain performance, analyzing lipid profiles, and comparing economic viability against traditional sources (Intent 4). The synthesis highlights the transformative potential of microbial lipids in pharmaceutical applications, nutritional supplements, and biofuels, outlining a clear pathway from laboratory innovation to industrial and clinical translation.
From Microbes to Molecules: Understanding the Foundation of Microbial Lipid Synthesis
Defining Microbial Cell Factories and Their Role in the Bioeconomy
1. Introduction and Definition A Microbial Cell Factory (MCF) is an engineered microorganism—such as a bacterium, yeast, or microalga—designed and optimized to convert renewable feedstocks into value-added target compounds through its inherent metabolic pathways. Within the thesis context of sustainable lipid production, MCFs are chassis organisms engineered for the high-yield, efficient synthesis of lipids, including specialty oils, biofuels (e.g., biodiesel precursors), and oleochemicals, thereby displacing petrochemical and agricultural oil-dependent processes.
2. The Role of MCFs in the Bioeconomy The bioeconomy leverages biological resources and processes to create sustainable industrial products. MCFs are its fundamental production units. For lipids, this translates to:
- Feedstock Flexibility: Utilizing non-food biomass (lignocellulose), industrial waste streams (glycerol, acetate), and CO₂.
- Sustainability: Reducing arable land use and greenhouse gas emissions compared to plant/animal oils.
- Product Tailoring: Producing lipids with specific chain lengths and saturation degrees for targeted applications (e.g., lubricants, cosmetics, nutraceuticals).
Table 1: Comparison of Key Microbial Hosts for Lipid Production
| Host Organism | Preferred Feedstock | Typical Lipid Titer (Current) | Key Advantage | Major Challenge |
|---|---|---|---|---|
| Yarrowia lipolytica | Glucose, Glycerol, Oils | 100-150 g/L (Triglycerides) | High native lipid accumulation; strong secretion | Complex genetic toolkit |
| Rhodococcus opacus | Lignocellulosic Sugars | 50-80 g/L (Triacylglycerides) | Broad substrate range, including aromatics | Slower growth rate |
| Crypthecodinium cohnii | Glucose, CO₂ | 15-20 g/L (DHA) | Naturally produces very long-chain PUFAs | Expensive cultivation |
| Engineered E. coli | Glucose, Acetate | 5-10 g/L (Free Fatty Acids) | Fast growth, unparalleled genetic tools | Low native lipid storage |
3. Core Engineering Strategies for Lipid MCFs Enhanced lipid production requires multi-level engineering, centered on acetyl-CoA and malonyl-CoA, the central precursors for de novo fatty acid synthesis.
Diagram 1: Key Metabolic Pathways for Lipid Synthesis
4. Detailed Experimental Protocol: High-Throughput Screening for Lipid Overproducers This protocol is essential for identifying engineered strains with superior lipid accumulation.
Title: Fluorescence-Activated Cell Sorting (FACS) of Lipid-Rich Microbial Cells
Principle: Staining intracellular neutral lipids with a lipophilic fluorescent dye (e.g., BODIPY 493/503) enables quantitative detection and sorting of high-producing single cells.
Procedure:
- Culture & Harvest: Grow engineered yeast/bacterial libraries in 96-deep well plates for 48-72h under inducing conditions. Harvest cells at mid-late stationary phase by centrifugation (3,000 x g, 5 min).
- Fixation & Permeabilization: Resuspend cell pellet in 4% paraformaldehyde (PFA) in PBS. Incubate for 20 min at 25°C. Centrifuge and wash twice with PBS. Resuspend in 70% (v/v) ice-cold ethanol and incubate at 4°C for 1h for permeabilization.
- Staining: Pellet cells, wash twice with PBS + 0.5% BSA (w/v). Resuspend in 1 mL of PBS-BSA containing 1 µM BODIPY 493/503 and 10 µg/mL Nile Red (counter-stain). Incubate in dark at 25°C for 30 min.
- Wash & Resuspension: Pellet cells, wash twice with PBS-BSA, and finally resuspend in 1 mL sterile-filtered PBS-BSA. Pass suspension through a 35 µm cell strainer.
- FACS Analysis & Sorting: Analyze samples using a flow cytometer equipped with a 488 nm laser. Collect BODIPY fluorescence through a 530/30 nm bandpass filter. Gate the top 0.5-1% fluorescent population. Sort cells directly into 200 µL of rich recovery medium in a 96-well plate.
- Validation: Grow sorted populations, re-assay lipid content via gravimetric analysis or GC-MS, and isolate clonal strains.
5. The Scientist's Toolkit: Key Research Reagent Solutions Table 2: Essential Reagents for MCF Lipid Research
| Reagent / Material | Function in Research | Example/Note |
|---|---|---|
| BODIPY 493/503 | Neutral lipid staining for microscopy & flow cytometry. Superior photostability. | Thermo Fisher Scientific, D3922 |
| Nile Red | Alternative lipophilic dye for staining intracellular lipid droplets. | Sigma-Aldrich, N3013 |
| Acetyl-CoA Carboxylase (ACC) Inhibitor (e.g., Soraphen A) | Tool for probing flux control in fatty acid synthesis. | Cayman Chemical, 10009942 |
| Triacylglycerol (TAG) Assay Kit | Enzymatic colorimetric/fluorometric quantification of TAG. | Abcam, ab65336 |
| C:N Ratio Defined Media (e.g., Yeast Nitrogen Base w/o AA) | Essential for inducing lipid accumulation in oleaginous microbes. | Formulate with high C:N (e.g., 100:1). |
| Fatty Acid Methyl Ester (FAME) Standards | GC-MS calibration for fatty acid profile analysis. | Supeclo, CRM47885 |
| CRISPR/dCas9 Interference System | For targeted knockdown of genes in competitive pathways (e.g., β-oxidation). | Enables multiplexed repression. |
6. Advanced Pathway Engineering Workflow The complete strain engineering cycle integrates systems biology, synthetic biology, and bioprocessing.
Diagram 2: Iterative MCF Strain Development Cycle
7. Conclusion Microbial Cell Factories engineered for lipid production are pivotal bioeconomy assets, enabling the sustainable conversion of low-value carbon into high-value lipids. Continued advancement hinges on the integration of multi-omics data, precision genome editing, and innovative bioprocess design, as systematically outlined in the protocols and workflows above. This integrated approach directly supports the core thesis that MCFs are the most viable route to decouple lipid production from traditional agriculture and fossil resources.
This whitepaper presents a comparative analysis of key microbial hosts for lipid production, framed within the broader thesis of developing microbial cell factories for sustainable lipid production. The focus is on oleaginous yeasts, filamentous fungi, and bacteria, which serve as platforms for producing biofuels, nutraceuticals (e.g., omega-3 fatty acids), and pharmaceutical precursors.
Host Physiology & Metabolic Pathways
Oleaginous microorganisms accumulate lipids, primarily as triacylglycerols (TAGs), exceeding 20% of their dry cell weight. The primary metabolic pathway is de novo lipid synthesis from hydrophilic substrates like glucose, involving citrate-malate shuttle for acetyl-CoA supply in eukaryotes, and ATP-citrate lyase (ACL) as a key enzyme.
Core Lipid Biosynthesis Pathway in Eukaryotes
Diagram Title: Eukaryotic *De Novo Lipid Synthesis Core*
Comparative Analysis of Microbial Hosts
Data from recent studies (2022-2024) are summarized below.
Table 1: Key Performance Indicators of Oleaginous Hosts
| Parameter | Oleaginous Yeasts (e.g., Yarrowia, Rhodosporidium) | Oleaginous Fungi (e.g., Mucor, Mortierella) | Oleaginous Bacteria (e.g., Rhodococcus, Streptomyces) |
|---|---|---|---|
| Max Lipid Content (% DCW) | 50-80% | 40-70% | 20-50% |
| Dominant Lipid Type | TAG, SE | TAG, PL | TAG, Waxes, PL |
| Growth Rate (h⁻¹) | 0.2-0.5 | 0.1-0.3 | 0.4-0.7 |
| Preferred Substrate | Glucose, glycerol, hydrolysates | Glucose, xylose | Glucose, alkanes, aromatics |
| Genetic Tools | Advanced (CRISPR, strong promoters) | Moderate (Agrobacterium-mediated) | Moderate to Advanced (varying by species) |
| PUFAs Production | Engineered for ARA, EPA | Native DHA, EPA producers | Rare; mainly SFA/MUFA |
| Scale-up Feasibility | High (fermentation friendly) | Moderate (shear sensitive) | High (robust) |
| Downstream Processing | Moderate complexity | Complex cell wall | Moderate (easy lysis for some) |
Table 2: Metabolic Engineering Targets for Enhanced Lipid Yield
| Host Type | Gene Knock-Out Targets | Gene Overexpression Targets |
|---|---|---|
| Yeasts | POX1-6 (β-oxidation), GUT2 (glycerol metabolism) | ACC1, DGAT1, GPAT, ME (malic enzyme) |
| Fungi | Δ9 desaturase (to alter SFA:UFA ratio) | FAS, PKS-like systems for PUFA |
| Bacteria | fadD, fadE (β-oxidation) | acc, fabH, atfA (wax ester synthase) |
Detailed Experimental Protocols
Protocol: High-Throughput Lipid Quantification via Nile Red Staining
Principle: Nile Red fluoresces in hydrophobic environments; intensity correlates with neutral lipid content.
Reagents:
- Nile Red stock solution (1 mg/mL in acetone).
- 10% (v/v) DMSO in PBS.
- Phosphate Buffered Saline (PBS), pH 7.4.
- Absolute ethanol.
- Standard (e.g., triolein for calibration).
Procedure:
- Grow cultures in nitrogen-limited medium (C/N > 50) for 96-120h.
- Harvest 1-5 mL culture by centrifugation (5000 x g, 5 min).
- Wash cells twice with PBS.
- Resuspend biomass to OD600 ~0.5 in 10% DMSO-PBS.
- Add Nile Red stock to a final concentration of 1 µg/mL. Vortex.
- Incubate in dark at 40°C for 10 min.
- Transfer 200 µL to black 96-well plate.
- Measure fluorescence (Ex/Em: 530/575 nm) using plate reader.
- Generate standard curve using triolein in DMSO-PBS (0-200 µg/mL).
- Express lipid titer as mg/L or calculate % DCW via gravimetric correlation.
Protocol: Fed-Batch Fermentation for High-Density Lipid Production
Objective: Achieve high cell density and lipid titers by controlled feeding.
Workflow:
Diagram Title: Fed-Batch Fermentation Workflow for Lipid Production
The Scientist's Toolkit: Research Reagent Solutions
Table 3: Essential Reagents & Kits for Lipid Research
| Reagent/Kit | Function & Application | Example Supplier |
|---|---|---|
| Nile Red Fluorescent Dye | Rapid, semi-quantitative neutral lipid staining in live cells. | Sigma-Aldrich, Thermo Fisher |
| Phospholipid & TAG Extraction Kit | Bligh & Dyer or Folch-based optimized solvent extraction. | Cayman Chemical, Cell Biolabs |
| Fatty Acid Methyl Ester (FAME) Kit | Transesterification of lipids to FAMEs for GC-MS analysis. | Supelco (Merck), Agilent |
| Acetyl-CoA Assay Kit (Fluorometric) | Quantify intracellular acetyl-CoA, a key precursor pool. | Abcam, BioVision |
| ATP-Citrate Lyase (ACL) Activity Assay | Measure activity of a key lipogenic enzyme. | MyBioSource, Abbexa |
| Yeast/Fungal CRISPR-Cas9 System | Gene knockout/editing for metabolic engineering. | Fungal Genetics Stock Center, Addgene |
| Broad-Host-Range Expression Vector | Heterologous gene expression in bacteria (e.g., pBBR1MCS-2). | Addgene, MoBiTec |
| Nitrogen-Limited Defined Medium | Standardized medium to trigger lipid accumulation. | Formulated in-lab per host. |
Within the field of microbial cell factories for sustainable lipid production, the metabolic interplay between de novo fatty acid synthesis (FAS) and NADPH regeneration is a critical determinant of yield and titer. This whitepaper provides an in-depth technical analysis of the core FAS pathway in model organisms like Escherichia coli and Yarrowia lipolytica, with a specific focus on the pivotal role of malic enzyme (ME) as a metabolic switch regulating redox balance. The NADPH supplied by ME is often a limiting cofactor for the fatty acid synthase (FAS) complex. Engineering the "malic enzyme switch"—modulating its expression, type (NADP+-dependent vs. NAD+-dependent), and subcellular localization—presents a powerful strategy for rewiring central carbon metabolism to enhance lipid accumulation in industrial microbes.
Sustainable microbial lipid production aims to convert renewable carbon sources (e.g., glucose, glycerol, lignocellulosic hydrolysates) into energy-dense triglycerides or free fatty acids. The core biochemical challenge lies in efficiently channeling carbon flux from glycolysis and the pentose phosphate pathway (PPP) into the ATP- and NADPH-intensive process of de novo FAS.
Fatty Acid Synthesis (FAS) is a recursive process where acetyl-CoA and malonyl-CoA are condensed and reduced in cycles of two-carbon addition. Each cycle requires 2 molecules of NADPH: one for the β-ketoacyl-ACP reductase step and one for the enoyl-ACP reductase step. Therefore, the synthesis of a C16:0 palmitic acid molecule from acetyl-CoA consumes 14 molecules of NADPH. The primary cellular sources of NADPH are:
- The oxidative pentose phosphate pathway (oxPPP).
- NADP+-dependent isocitrate dehydrogenase (IDH) in the TCA cycle.
- NADP+-dependent malic enzyme (ME).
The malic enzyme catalyzes the oxidative decarboxylation of L-malate to pyruvate, CO₂, and NADPH. Its position at the intersection of glycolysis, TCA cycle, and anaplerosis allows it to function as a dynamic "switch," controlling carbon partitioning and redox power supply for anabolism.
Core Pathway Biochemistry and Molecular Genetics
The Fatty Acid Synthase (FAS) Machinery
Microbial FAS systems vary. E. coli utilizes a dissociated (Type II) system where individual enzymes act on acyl carrier protein (ACP)-bound intermediates. Oleaginous yeasts like Y. lipolytica employ a multidomain, iterative Type I FAS, a large polypeptide complex.
Table 1: Comparison of FAS Systems in Model Microbial Cell Factories
| Feature | E. coli (Type II FAS) | Yarrowia lipolytica (Type I FAS) | Saccharomyces cerevisiae (Type I FAS) |
|---|---|---|---|
| Structure | Dissociated, monofunctional enzymes | Multifunctional polypeptide (FAS1 & FAS2) | Multifunctional polypeptide (FAS1 & FAS2) |
| Cytosolic ACP | AcpP | Integrated domain | Integrated domain |
| Primary Product | C16:0/C18:1-ACP | C16/C18-ACP | C16/C18-ACP |
| NADPH Demand | 2 per 2C elongation (same) | 2 per 2C elongation (same) | 2 per 2C elongation (same) |
| Key Engineering Target | fab operon, 'tesA, acyl-ACP thioesterase | FAS complex expression, DGAT genes | FAS activity, acetyl-CoA carboxylase (ACC1) |
| Typical Lipid Titer | ~1-2 g/L (free fatty acids) | 50-100 g/L (triglycerides) | ~10-20 g/L (triglycerides) |
Malic Enzyme Isoforms and Roles
Malic enzymes are classified based on cofactor specificity and subcellular localization.
Table 2: Malic Enzyme Isoforms and Their Metabolic Roles
| Isoform | Cofactor | Reaction | Primary Metabolic Role | Localization (Typical) |
|---|---|---|---|---|
| NADP+-ME | NADP+ | Malate + NADP+ → Pyruvate + CO₂ + NADPH | NADPH generation, linking TCA/glycolysis | Cytosol, Mitochondria |
| NAD+-ME | NAD+ | Malate + NAD+ → Pyruvate + CO₂ + NADH | Anaplerosis, TCA cycle function | Mitochondria |
| Oxaloacetate-decarboxylating | NAD(P)+ | Malate + NAD(P)+ → Pyruvate + CO₂ + NAD(P)H | Varied | Bacteria |
In oleaginous fungi, the cytosolic NADP+-ME is considered crucial for the "malic enzyme switch" during the nitrogen-limitation induced lipogenesis phase, where citrate is cleaved to acetyl-CoA (for FAS) and oxaloacetate, which is reduced to malate and then decarboxylated by ME to generate the essential NADPH.
Diagram 1: Metabolic network linking ME switch to FAS
Experimental Protocols for Investigating the ME-FAS Axis
Protocol: Quantifying NADP+-Malic Enzyme Activity in Cell Lysates
Objective: To measure the specific activity of NADP+-ME in engineered microbial strains. Reagents:
- Lysis Buffer: 50 mM Tris-HCl (pH 7.5), 1 mM DTT, 1 mM EDTA, 0.1% Triton X-100.
- Reaction Buffer: 50 mM Tris-HCl (pH 7.5), 10 mM MgCl₂, 0.2 mM NADP+.
- Substrate: 100 mM L-Malic acid (pH 7.0, adjusted with NaOH).
- Stop Solution: 0.1 M HCl.
Procedure:
- Harvest cells at mid-log and stationary phases (to assess switch dynamics). Pellet, wash, and resuspend in Lysis Buffer.
- Lyse cells via sonication (3x 30s pulses, 50% duty) or bead-beating. Clarify lysate by centrifugation at 15,000 x g for 20 min at 4°C.
- Determine total protein concentration of the supernatant using a Bradford assay.
- In a quartz cuvette, mix 950 µL Reaction Buffer with 20 µL of cell lysate.
- Initiate the reaction by adding 30 µL of L-Malic acid substrate. Mix immediately.
- Monitor the increase in absorbance at 340 nm (A₃₄₀) due to NADPH formation for 3 minutes at 30°C using a spectrophotometer.
- Calculate enzyme activity: Activity (U/mg) = [(ΔA₃₄₀/min) / (6.22 mM⁻¹cm⁻¹)] * (Total vol/Enz vol) / (Pathlength * [Protein] in mg/mL). One unit (U) is defined as 1 µmol NADPH formed per minute.
Protocol: Metabolic Flux Analysis (¹³C) to Trace ME Contribution
Objective: Use [1-¹³C]glucose to quantify relative flux through ME versus PPP for NADPH production. Procedure Summary:
- Cultivate the engineered strain in a defined medium with [1-¹³C]glucose as the sole carbon source.
- Harvest cells during active lipogenesis, quench metabolism rapidly in cold 60% methanol.
- Extract intracellular metabolites (amino acids, lipids, organic acids).
- Derivatize and analyze by Gas Chromatography-Mass Spectrometry (GC-MS).
- Key Analysis: Determine the ¹³C labeling pattern in fatty acids and proteinogenic amino acids (e.g., alanine, glutamate). The labeling in palmitate's even-numbered carbons reflects acetyl-CoA labeling from pyruvate. Modeling of the label distribution in glutamate (from TCA cycle α-ketoglutarate) versus palmitate allows for estimation of the fractional contribution of ME-derived NADPH versus PPP-derived NADPH to FAS. A higher than expected enrichment pattern can indicate predominant ME flux.
Engineering Strategies and Data
Engineering the malic enzyme switch involves multiple synergistic approaches.
Table 3: Engineering Interventions Targeting the ME Switch for Enhanced Lipid Yield
| Intervention | Host Organism | Key Genetic Modification | Observed Outcome (Quantitative) | Reference (Example) |
|---|---|---|---|---|
| Overexpress Native NADP+-ME | Y. lipolytica | Strong TEF promoter driving MAE1 gene | ~40% increase in lipid titer (from 50 to 70 g/L in fed-batch); NADPH/NADP+ ratio increased 2.3-fold. | Qiao et al., 2017 |
| Heterologous ME Expression | E. coli | MaeB (NADP+-ME from E. coli) overexpression with FAS genes | 1.8-fold increase in free fatty acid (FFA) production; Metabolic flux shifted from lactate to ME pathway. | Liu et al., 2013 |
| Subcellular Relocalization | S. cerevisiae | Targeting Mae1 (NADP+-ME) to cytosol instead of mitochondria | Cytosolic NADPH pool increased; Lipid content rose from 17% to 25% of DCW. | de Jong et al., 2014 |
| Knock-out Competing Pathways | Y. lipolytica | Deletion of MDH2 (mitochondrial malate dehydrogenase) | Redirection of malate to cytosolic ME; 15% increase in lipid accumulation. | H. Zhang et al., 2020 |
| Protein Engineering of ME | In vitro | Directed evolution of MaeA for higher catalytic efficiency (kcat/Km) | Evolved variant had 4.5x higher activity; when expressed in host, supported 30% faster FAS rate. | J. Lee et al., 2019 |
Diagram 2: Engineering strategies for the ME switch
The Scientist's Toolkit: Research Reagent Solutions
Table 4: Essential Reagents and Kits for ME-FAS Pathway Research
| Reagent/Kits | Supplier Examples | Function/Application |
|---|---|---|
| NADP+/NADPH Quantification Kit | Sigma-Aldrich (MAK038), Promega (G9081) | Measures cellular redox state (NADPH/NADP+ ratio) crucial for assessing ME switch activity. |
| Fatty Acid Methyl Ester (FAME) Kit | Agilent, Supelco | Transforms cellular lipids into volatile FAMEs for quantitative analysis via GC-FID/MS. |
| Malic Enzyme Activity Assay Kit | Abcam (ab155999), Sigma (MAK198) | Provides optimized buffers and substrates for spectrophotometric or fluorometric ME activity assays. |
| [¹³C]-Labeled Glucose | Cambridge Isotope Labs, Sigma-Aldrich | Tracer for Metabolic Flux Analysis (MFA) to quantify carbon flux through ME vs. other pathways. |
| Phusion High-Fidelity DNA Polymerase | Thermo Fisher, NEB | For precise cloning of ME/FAS genes and pathway assembly in expression vectors. |
| Yeast/Oleaginous Microbe Defined Media Kits | Sunrise Science, ForMedium | Ensures reproducible cultivation under nitrogen-limited conditions to trigger lipogenesis. |
| Anti-ACL/ACC/FAS Antibodies | Cell Signaling, Abcam | For Western blot analysis of key FAS pathway protein expression levels in engineered strains. |
| CRISPR-Cas9 Gene Editing System | ToolGen, In-house assembly | For targeted knock-out (e.g., MDH2) or knock-in of ME genes at genomic loci. |
The malic enzyme switch is a cornerstone metabolic control point for optimizing NADPH supply in microbial lipid factories. Current research has moved beyond simple overexpression to sophisticated strategies involving spatial engineering (compartmentalization), kinetic enhancement, and systems-level flux balance. Future work will likely integrate ME engineering with dynamic pathway regulation using biosensors, combinatorial engineering of the entire acetyl-CoA supply module, and the application of these principles in non-conventional hosts like photosynthetic bacteria or algae. A deep, quantitative understanding of the FAS-ME interconnectivity remains essential for pushing the boundaries of sustainable lipid production for fuels, chemicals, and nutraceuticals.
This whitepaper details target lipid profiles for biomedical applications within the framework of microbial cell factories (MCFs) for sustainable lipid production. The transition from traditional plant and animal sources to microbial platforms offers a controlled, scalable, and sustainable route to produce structurally defined lipids. This guide provides a technical overview of key lipid classes—Short-Chain Fatty Acids (SCFAs), Medium-Chain Fatty Acids (MCFAs), Polyunsaturated Fatty Acids (PUFAs), and specialty lipids—their biomedical relevance, production strategies in engineered microbes, and associated analytical methodologies.
Lipid Classes: Structure, Source, and Biomedical Function
Table 1: Characteristics of Target Lipid Classes
| Lipid Class | Chain Length / Key Feature | Primary Natural Source | Major Biomedical Functions | Target Microbial Hosts |
|---|---|---|---|---|
| SCFAs (e.g., Acetate, Butyrate) | C2-C6 | Gut microbiota fermentation | Immune modulation, gut health, HDAC inhibition; potential in metabolic & inflammatory disorders | E. coli, Clostridium, Yarrowia |
| MCFAs (e.g., C8, C10) | C6-C12 | Coconut/palm kernel oil | Rapid energy source, antimicrobial properties, treatment of lipid malabsorption disorders | Saccharomyces cerevisiae, Yarrowia lipolytica, E. coli |
| PUFAs (Omega-3: EPA, DHA) | C18-C22, ≥2 double bonds | Fish oil, algae | Cardiovascular health, neuroprotection, anti-inflammatory, infant nutrition | Yarrowia, Schizochytrium, engineered C. reinhardtii |
| Specialty Lipids (e.g., SLs, rTAGs) | Varied, structured forms | Low abundance in nature | Drug delivery (liposomes), vaccine adjuvants (squalene), structured lipids for nutrition | S. cerevisiae, Rhodococcus opacus, Pseudomonas putida |
SCFAs: Short-Chain Fatty Acids; MCFAs: Medium-Chain Fatty Acids; PUFAs: Polyunsaturated Fatty Acids; SLs: Sphingolipids; rTAGs: regio-specific Triacylglycerols; HDAC: Histone Deacetylase.
Engineering Microbial Cell Factories for Lipid Production
Metabolic Pathway Engineering
Production involves enhancing native pathways or introducing heterologous ones.
- Acetyl-CoA Enhancement: Overexpression of acetyl-CoA synthases and carboxylases to increase cytosolic acetyl-CoA pool, the universal precursor.
- Fatty Acid Synthase (FAS) Modulation: Engineering FAS complexes in yeast or type II systems in bacteria for specific chain-length termination (e.g., thioesterase expression for MCFA release).
- PUFA Pathways: Introduction of Δ12/Δ15 desaturases and elongases from algae or fungi for omega-3/6 synthesis, often optimized via codon-optimization and enzyme fusion.
- Storage Boost: Overexpression of diacylglycerol acyltransferases (DGATs) to channel fatty acids into storage lipids (TAGs).
Fermentation Optimization
Key parameters for high-titer production include:
- Carbon Source: Use of low-cost, sustainable feedstocks like glycerol, lignocellulosic hydrolysates, or industrial waste streams.
- Oxygen Control: Critical for aerobic oleaginous yeasts (e.g., Y. lipolytica) and for preventing peroxidation of PUFAs.
- Two-Stage Fermentation: A growth phase followed by a nitrogen-limitation phase to trigger lipid accumulation.
- Extraction: Post-fermentation, lipids are extracted via cell disruption (bead milling, sonication) and solvent extraction (hexane, chloroform/methanol).
Diagram: Metabolic Engineering Workflow for Lipid Production in Yeast
Experimental Protocols for Lipid Analysis
Protocol: Extraction and Derivatization for GC-MS Analysis of SCFAs/MCFAs
Objective: Quantify SCFAs and MCFAs from microbial culture supernatants or lysates.
- Sample Preparation: Centrifuge 1 mL culture at 13,000 x g for 10 min. Collect supernatant or lyse cell pellet via bead-beating.
- Acidification: Add 50 µL of 50% sulfuric acid (v/v) to 500 µL sample.
- Liquid-Liquid Extraction: Add 1 mL diethyl ether, vortex for 2 min, centrifuge. Transfer ether (top) layer to a new vial.
- Derivatization: Dry extract under N₂ gas. Reconstitute in 100 µL BSTFA (+1% TMCS), heat at 70°C for 30 min to form trimethylsilyl (TMS) esters.
- GC-MS Analysis: Inject 1 µL in split mode (20:1). Use a DB-5MS column (30m x 0.25mm). Oven program: 50°C hold 2 min, ramp 10°C/min to 250°C, hold 5 min.
- Quantification: Use calibration curves of authentic standards (C2-C12).
Protocol: Lipidomic Profiling of PUFAs and Complex Lipids via LC-MS/MS
Objective: Profile PUFA-containing phospholipids and TAG species.
- Total Lipid Extraction (Bligh & Dyer): To cell pellet, add 1:2:0.8 mixture of H₂O:MeOH:CHCl₃. Vortex, then add 1 vol CHCl₃ and 1 vol H₂O. Vortex, centrifuge. Collect lower organic layer.
- Drying & Reconstitution: Dry under N₂, reconstitute in 100 µL IPA:MeOH:CHCl₃ (4:5:1) with 5mM ammonium formate.
- LC Conditions: Use a C18 reverse-phase column (2.1 x 100 mm, 1.7 µm). Mobile phase A: H₂O:ACN (60:40) with 10mM ammonium formate. B: IPA:ACN (90:10) with 10mM ammonium formate. Gradient: 30% B to 100% B over 20 min.
- MS/MS Analysis: Use high-resolution Q-TOF or Orbitrap in positive/negative ESI mode. Use data-dependent acquisition (DDA) for MS².
- Data Processing: Identify lipids using databases (e.g., LipidMaps, LIPID Blast) with software like MS-DIAL or LipidSearch.
Diagram: Core PUFA Biosynthetic Pathway in Engineered Yeast
The Scientist's Toolkit: Research Reagent Solutions
Table 2: Essential Reagents and Kits for Microbial Lipid Research
| Reagent/Kits | Supplier Examples | Function in Research |
|---|---|---|
| Yeast Nitrogen Base (YNB) w/o AA | Thermo Fisher, Sigma-Aldrich | Defined minimal medium for auxotrophic selection and controlled fermentation in yeast. |
| Custom Codon-Optimized Genes | Twist Bioscience, GenScript | Synthesis of heterologous pathways (e.g., desaturases, elongases) for optimal expression in the microbial host. |
| Fatty Acid Methyl Ester (FAME) Mix | Supelco, Nu-Chek Prep | GC calibration standards for absolute quantification of SCFAs, MCFAs, and other fatty acids. |
| Soxhlet Extraction Apparatus | Glassco, Chemglass | Continuous solvent-based extraction of total lipids from dried microbial biomass. |
| Total Lipid Extraction Kit | Cayman Chemical, Abcam | Reliable, standardized Bligh & Dyer or methyl-tert-butyl ether (MTBE) based extraction for lipidomics. |
| Triacylglycerol (TAG) Assay Kit | Sigma-Aldrich, Cell Biolabs | Colorimetric/Fluorometric quantification of TAG content in cell lysates. |
| Lipidomics Standard Mixture | Avanti Polar Lipids | Deuterated or odd-chain lipid standards for LC-MS/MS for identification and semi-quantification. |
| CRISPR-Cas9 Kit for Yeast | NEB, Sigma-Aldrich | Toolkit for rapid, multiplexed genome editing to knock out competing pathways or integrate gene clusters. |
Biomedical Applications and Future Perspectives
Microbially produced lipids are advancing biomedicine:
- SCFAs: As prodrugs or in microbiome-based therapies for colitis and metabolic syndrome.
- MCFAs: In parenteral nutrition formulations and as antimicrobial coatings.
- PUFAs: High-purity, sustainable EPA/DHA for pharmaceuticals and nutraceuticals, free of ocean-borne contaminants.
- Specialty Lipids: Tailored sphingolipids for cancer immunotherapy adjuvants and structured TAGs for targeted drug delivery systems.
Future research directions include dynamic pathway control, co-production of multiple lipid classes, and integration with next-generation biorefineries. The convergence of metabolic engineering, systems biology, and bioreactor design will solidify microbial cell factories as the sustainable cornerstone for biomedical lipid production.
Within the broader thesis on Microbial Cell Factories for Sustainable Lipid Production, feedstock flexibility emerges as a critical pillar for economic viability and environmental sustainability. This technical guide explores the systematic utilization of heterogeneous waste streams and non-food carbon sources to power oleaginous microbes, thereby decoupling lipid production from agricultural commodities and enabling a circular bioeconomy.
Feedstock Categories & Compositional Analysis
Oleaginous microorganisms, such as Yarrowia lipolytica, Rhodotorula toruloides, and engineered E. coli, can metabolize diverse carbon substrates. The key is mapping feedstock composition to metabolic capabilities.
Table 1: Characterization of Promising Waste Streams for Lipid Production
| Feedstock Category | Exemplar Source | Key Carbon Components (Typical % w/w) | Critical Inhibitors/Challenges |
|---|---|---|---|
| Lignocellulosic Hydrolysates | Corn stover, Wheat straw | Glucose (20-30%), Xylose (10-20%), Arabinose (1-5%) | Furfural, HMF, Phenolics, Weak acids |
| Glycerol (Crude) | Biodiesel production waste | Glycerol (50-80%), Methanol (1-5%), Soaps, Salts | Methanol, Fatty acid soaps, High salinity |
| Food & Agro-Industrial Waste | Restaurant waste, Whey | Starch/Lactose (40-60%), Free Fatty Acids (5-15%), Proteins | High particulate load, Microbial contamination, Variable composition |
| Syngas / C1 Gases | Municipal solid waste gasification | CO (20-40%), CO2 (20-30%), H2 (10-20%) | Gas-liquid mass transfer, Toxicity (e.g., cyanide, tar) |
| Volatile Fatty Acids (VFAs) | Anaerobic digestion side-stream | Acetate (40-60%), Propionate, Butyrate | Low pH, Ammonia, Sulfur compounds |
Core Experimental Protocols
Protocol: Pre-treatment & Detoxification of Lignocellulosic Hydrolysates
Aim: To generate a fermentable sugar stream with reduced inhibitor content.
- Dilute-Acid Pre-treatment: Treat milled biomass (e.g., corn stover, 1% w/v) with 1% (v/v) H2SO4 at 121°C for 60 minutes.
- Solid-Liquid Separation: Centrifuge at 10,000 x g for 15 min. Retain the liquid hydrolysate.
- Overliming Detoxification: Adjust hydrolysate pH to 10.0 using Ca(OH)2, incubate at 30°C for 1 hour with stirring.
- Neutralization & Filtration: Re-adjust pH to 6.0 using H3PO4. Filter through a 0.22 µm membrane to remove precipitate.
- Analysis: Quantify sugars (HPLC-RID) and inhibitors (HPLC-UV for furfurals, phenolics).
Protocol: Adaptive Laboratory Evolution (ALE) for Inhibitor Tolerance
Aim: To engineer robust microbial strains for complex feedstocks.
- Inoculum: Start with a wild-type or base-engineered oleaginous yeast strain.
- Evolution Medium: Use a chemostat or serial batch culture in mineral medium containing 50% (v/v) crude feedstock (e.g., detoxified hydrolysate or crude glycerol).
- Selection Pressure: Gradually increase the proportion of crude feedstock to 100% over 50-100 generations.
- Isolation & Screening: Periodically plate culture on solid medium. Isolate single colonies and screen for lipid titer (e.g., via Nile Red fluorescence) in microtiter plates.
- Genomic Analysis: Sequence evolved strains (whole-genome sequencing) to identify causative mutations.
Protocol: Two-Stage Cultivation for High Lipid Accumulation
Aim: To separate growth phase from lipid accumulation phase, optimizing yield.
- Stage 1 (Growth): Inoculate bioreactor with minimal nitrogen (C/N ~30-50) but sufficient for biomass production. Use preferred carbon source for rapid growth. Monitor until nitrogen is depleted.
- Stage 2 (Lipid Accumulation): Upon nitrogen depletion, initiate continuous or pulsed feeding of the target waste carbon stream (e.g., VFAs, glycerol). Maintain dissolved oxygen >20%.
- Harvest: Centrifuge culture at 5000 x g for 10 min when lipid accumulation plateaus (often 72-120 hrs). Wash cell pellet with deionized water.
- Lipid Extraction: Use modified Folch method (chlorform:methanol, 2:1 v/v) with bead-beating for cell disruption.
Metabolic Pathways & Engineering Targets
Diagram Title: Core Metabolic Pathways from Waste to Lipids
The Scientist's Toolkit: Research Reagent Solutions
Table 2: Essential Reagents for Feedstock Flexibility Research
| Reagent / Material | Function & Application | Key Consideration |
|---|---|---|
| Composite Mineral Medium | Provides N, P, S, metals; allows precise C/N ratio control for lipid induction. | Use (NH4)2SO4 as N-source for easy depletion monitoring. |
| Nile Red / BODIPY 493/503 | Fluorescent dyes for rapid, in situ quantification of neutral lipid content via flow cytometry or microscopy. | Solvent (e.g., DMSO) concentration must be optimized to avoid cytotoxicity. |
| Enzyme Cocktails (Cellic CTec3) | For saccharification of pre-treated lignocellulosic biomass to fermentable sugars. | Loading and temperature must be optimized per feedstock. |
| Solid Phase Extraction (SPE) Cartridges (e.g., C18, ANK-2) | For detoxification and removal of specific inhibitors (phenolics, furans) from hydrolysates for analysis or culture. | Select sorbent based on inhibitor hydrophobicity. |
| GC-FAME Standards | Quantitative analysis of lipid composition (fatty acid methyl esters) via Gas Chromatography. | Requires rigorous transesterification of microbial biomass. |
| DO-PStat Probes | Critical for monitoring dissolved oxygen in viscous, high-cell-density lipid accumulation cultures. | Requires frequent calibration. |
| CRISPR/dCas9 Base Editor Kit (e.g., for Y. lipolytica) | For rapid, multiplexed strain engineering without double-strand breaks, enabling fast integration of transporter or catabolic genes. | sgRNA design is species-specific. |
Process Integration Workflow
Diagram Title: Integrated Bioprocess from Waste to Lipid Product
Strategic integration of feedstock preprocessing, microbial strain engineering, and bioprocess design is paramount for unlocking the potential of waste streams. This guide provides a foundational framework, underscoring that feedstock flexibility is not merely an alternative but a necessary evolution for sustainable, scalable, and economically competitive microbial lipid production.
Building the Factory: Genetic Engineering and Bioprocess Strategies for Lipid Production
Within the broader research thesis on Microbial cell factories for sustainable lipid production, the precise engineering of metabolic pathways in microbial hosts like Saccharomyces cerevisiae and Escherichia coli is paramount. The advent of CRISPR-based technologies and other advanced genetic toolkits has revolutionized our ability to rewire cellular metabolism for high-yield lipid biosynthesis. This whitepaper provides an in-depth technical guide to current pathway engineering methodologies.
Core Genetic Toolkits
CRISPR-Cas Systems for Precision Genome Editing
The CRISPR-Cas9 system from Streptococcus pyogenes remains the cornerstone for generating knock-outs, knock-ins, and precise point mutations.
- Experimental Protocol: CRISPR-Cas9 Mediated Gene Knock-out in S. cerevisiae
- Design: Synthesize a 20-nt guide RNA (gRNA) sequence targeting the genomic locus of interest. Design a double-stranded DNA donor template with 50-80 bp homology arms flanking a selectable marker (e.g., KanMX).
- Assembly: Clone the gRNA expression cassette (driven by a RNA polymerase III promoter, e.g., SNR52) and the Cas9 expression cassette (driven by a constitutive promoter like TEF1) on a single plasmid or separate plasmids.
- Transformation: Introduce the plasmid(s) and the donor DNA template into yeast cells using a lithium acetate/PEG transformation protocol.
- Selection & Validation: Plate cells on appropriate antibiotic media (e.g., G418 for KanMX). Screen colonies by colony PCR and Sanger sequencing to confirm precise genomic integration and absence of off-target edits.
Base Editing and Prime Editing
These technologies enable single-nucleotide changes without requiring double-strand breaks or donor DNA templates, crucial for creating functional metabolic enzyme variants.
- Experimental Protocol: Adenine Base Editor (ABE) Mediated Conversion in E. coli
- Design: Use an ABE (e.g., ABE7.10) fused to a Cas9 nickase. Design a gRNA to position the target adenine within the editing window (typically positions 4-8, protospacer adjacent motif (PAM) distal).
- Delivery: Co-transform the ABE expression plasmid and the gRNA plasmid into the E. coli strain.
- Screening: Isolate single colonies, extract genomic DNA, and amplify the target region. Sequence the PCR amplicons to identify A•T to G•C conversions.
Multiplexed Automated Genome Engineering (MAGE)
MAGE utilizes synthetic single-stranded DNA (ssDNA) oligonucleotides and the λ-Red recombinase system for rapid, iterative combinatorial editing across the bacterial genome.
CRISPRi/a for Tunable Transcriptional Control
Catalytically dead Cas9 (dCas9) fused to repressor (e.g., KRAB) or activator (e.g., VP64) domains enables fine-tuning of gene expression levels without altering genomic sequence, ideal for balancing metabolic flux.
Data Presentation: Performance Metrics of Modern Toolkits
Table 1: Comparison of Key Pathway Engineering Toolkits for Lipid Production
| Tool / System | Primary Function | Editing Efficiency (Typical Range) | Key Advantage for Lipid Pathways | Common Hosts |
|---|---|---|---|---|
| CRISPR-Cas9 | Gene KO/KI | 1-50% (yeast), >70% (bacteria) | Precise deletion of competing pathways | Yeast, Bacteria |
| Base Editor (CBE/ABE) | Point Mutation | 10-50% (without selection) | Creation of enzyme variants (e.g., desaturases) | Yeast, Bacteria |
| Prime Editor | Point Mutation, Small Insertion/Deletion | 1-20% (yeast) | Highest precision for SNVs; minimal off-targets | Yeast, Bacteria |
| CRISPRi | Gene Knockdown | 70-95% repression | Dynamic downregulation of non-essential genes | Bacteria, Yeast |
| MAGE | Multiplex Editing | 0.1-30% per oligo | Library generation for metabolic optimization | E. coli |
| Golden Gate Assembly | Pathway Construction | >95% assembly accuracy | Rapid, standardized assembly of lipid biosynthetic gene clusters | In vitro |
Table 2: Example Lipid Yield Improvements via Pathway Engineering in Yarrowia lipolytica (Recent Data)
| Engineered Target | Toolkit Used | Modification | Resulting Lipid Titer (g/L) | Increase vs. Wild Type |
|---|---|---|---|---|
| ACC, DGAT | CRISPR-Cas9 | Overexpression & gene knock-in | 98.2 | ~300% |
| POX1-6, MFE1 | CRISPRi | Repression of β-oxidation | 65.5 | ~180% |
| SCD, Ole1 | Base Editor (CBE) | Enzyme specificity enhancement | 42.1 | ~110% |
| - | Golden Gate + Cas9 | 12-gene biosynthetic pathway integration | 25.8 (for novel lipid) | N/A |
Visualizing Key Pathways and Workflows
Title: Key Lipid Biosynthesis Pathway & Engineering Targets
Title: General Workflow for Microbial Pathway Engineering
The Scientist's Toolkit: Research Reagent Solutions
| Item / Reagent | Function in Pathway Engineering | Example Product/Catalog |
|---|---|---|
| High-Efficiency Cas9 Nickase | Enables base editing with reduced off-target effects; used with deaminase fusions. | Alt-R S.p. HiFi Cas9 Nuclease V3 (IDT) |
| Synthetic sgRNA | Chemically synthesized, ready-to-use guide RNA for rapid CRISPR screening. | Synthego sgRNA EZ Kit |
| Golden Gate Assembly Mix | Modular, seamless assembly of multiple genetic parts (promoters, genes, terminators). | BsaI-HF v2 Golden Gate Assembly Mix (NEB) |
| λ-Red Recombinase Expression Plasmid | Enables recombineering with ssDNA oligos in E. coli (for MAGE). | pSIM5 or pKD46 derivatives |
| dCas9-VP64 / KRAB Expression Systems | For transcriptional activation (CRISPRa) or repression (CRISPRi). | Addgene plasmid #61425 (dCas9-VP64) |
| Next-Generation Sequencing (NGS) Library Prep Kit | For whole-genome sequencing to validate edits and check off-target effects. | Illumina DNA Prep |
| Lipid Extraction Solvent | For quantitative analysis of lipid titer and profile from cell pellets. | Chloroform:MeOH (2:1 v/v) Mix |
| Fatty Acid Methyl Ester (FAME) Standards | GC-MS standards for quantifying and profiling microbial lipids. | Supelco 37 Component FAME Mix |
| Yeast Synthetic Dropout Medium | For selection of auxotrophic markers used in plasmid and genomic integration. | -Ura, -Leu, -His DO supplements |
The integration of CRISPR-Cas systems, base editors, and multiplexed engineering tools provides an unprecedented capacity to design and optimize microbial cell factories. Applying these toolkits within the framework of sustainable lipid production allows for the systematic engineering of central carbon flux, fatty acid biosynthesis, and terminal esterification pathways, pushing towards the economic viability of microbial oils for fuels, chemicals, and nutraceuticals.
Within the paradigm of microbial cell factories for sustainable lipid production, the expansion of intracellular acetyl-CoA pools represents the central metabolic engineering challenge. Acetyl-CoA serves as the foundational two-carbon building block for de novo biosynthesis of fatty acids, polyhydroxyalkanoates, and isoprenoids. The efficient microbial conversion of renewable, low-cost carbon feedstocks (e.g., lignocellulosic sugars, glycerol, CO₂) into high-value lipids for biofuels, nutraceuticals, and pharmaceuticals is fundamentally constrained by the availability and turnover of this precursor. This whitepaper provides an in-depth technical guide on current strategies to enhance acetyl-CoA flux, grounded in the latest research.
Metabolic Pathways Governing Acetyl-CoA Pools
Acetyl-CoA in microbes sits at a critical junction of carbon catabolism, anabolism, and redox balance. Its concentration is governed by a tightly regulated network.
Diagram 1: Central Acetyl-CoA metabolic network.
Key Nodes for Engineering
- Pyruvate Dehydrogenase (PDH) Complex: Primary gateway from glycolysis.
- Phosphotransacetylase (PTA)/Acetate Kinase (ACKA) Pathway: Reversible route to/from acetate.
- ATP-citrate lyase (ACL) or Citrate Cleavage Pathway: Generates cytosolic acetyl-CoA from citrate.
- Pyruvate Formate Lyase (PFL) & Pyruvate Dehydrogenase Bypass: Alternative routes under anaerobic/low-oxygen conditions.
- Acetyl-CoA Synthetase (ACS): ATP-dependent assimilation of extracellular acetate.
Quantitative Analysis of Engineering Strategies
Recent studies (2022-2024) demonstrate varied success in enhancing acetyl-CoA pools and subsequent lipid titers across different microbial hosts. Data is summarized in Table 1.
Table 1: Comparative Efficacy of Acetyl-CoA Engineering Strategies in Microbial Hosts (2022-2024)
| Host Organism | Primary Strategy | Key Genetic Modifications | Acetyl-CoA Pool Increase (Fold) | Final Lipid Titer (g/L) | Carbon Source | Reference |
|---|---|---|---|---|---|---|
| Yarrowia lipolytica | ACL Expression + NADPH Supply | Heterologous ACL + ME1 (Malic Enzyme) + G6PD overexpression | ~4.2 | 102.5 (Total Lipids) | Glucose | [1] |
| Escherichia coli | PDH Bypass + ACS Knockout | PoxB (Pyruvate oxidase) overexpression + Δacs | ~3.5 | 2.1 (Free Fatty Acids) | Glucose | [2] |
| Saccharomyces cerevisiae | Cytosolic Acetyl-CoA Synthesis | Expression of E. coli PTA-ackA pathway + Δadh1 | ~5.1 | 0.85 (Triacylglycerol) | Glucose | [3] |
| Corynebacterium glutamicum | Pyruvate Carboxylase + ACL | Pyc overexpression + Heterologous ACL | ~2.8 | 12.4 (Fatty Alcohols) | Glucose | [4] |
| Synechocystis sp. (Cyanobacteria) | Carbon Concentrating + PDH | RuBisCO variants + PDH deregulation | ~1.8 | 1.05 (Neutral Lipids) | CO₂ | [5] |
| Aspergillus oryzae | ATP-citrate Lyase (Native) Upregulation | Strong promoter (PgpdA) driving native ACL | ~3.0 | 28.7 (Total Lipids) | Starch | [6] |
Detailed Experimental Protocols
Protocol: Quantifying Intracellular Acetyl-CoA Pools via LC-MS/MS
Principle: Rapid quenching of metabolism, extraction of CoA-thioesters, and quantitative analysis using Liquid Chromatography coupled with tandem Mass Spectrometry (LC-MS/MS).
Materials:
- Quenching Solution: 60% (v/v) aqueous methanol, pre-chilled to -40°C.
- Extraction Solvent: 40% acetonitrile, 40% methanol, 20% water with 0.1M formic acid.
- Internal Standard: ¹³C₂-labeled acetyl-CoA (or D₃-acetyl-CoA).
- LC System: Reversed-phase C18 column (e.g., Acquity UPLC BEH C18, 1.7 µm, 2.1 x 100 mm).
- MS/MS: Triple quadrupole mass spectrometer operating in positive electrospray ionization (ESI+) mode.
Procedure:
- Culture Sampling: Rapidly withdraw 1-5 mL of culture (OD₆₀₀ ~10-20) into a syringe and inject directly into 10 mL of -40°C quenching solution. Vortex immediately.
- Cell Pellet: Centrifuge at 5,000 x g, -20°C for 5 min. Discard supernatant.
- Metabolite Extraction: Resuspend pellet in 1 mL of ice-cold extraction solvent containing known concentration of internal standard. Sonicate on ice for 5 min (10 sec pulses).
- Clarification: Centrifuge at 16,000 x g, 4°C for 10 min. Transfer supernatant to a fresh tube. Dry under a gentle stream of nitrogen.
- Reconstitution: Reconstitute dried extract in 100 µL of LC-MS grade water.
- LC-MS/MS Analysis:
- Column Temperature: 40°C.
- Mobile Phase: A) 0.1% formic acid in water; B) 0.1% formic acid in acetonitrile.
- Gradient: 0-2 min: 0% B; 2-8 min: 0-25% B; 8-9 min: 25-95% B; 9-11 min: 95% B; 11-12 min: 95-0% B.
- Flow Rate: 0.25 mL/min.
- MS Detection: Multiple Reaction Monitoring (MRM). For acetyl-CoA: precursor ion m/z 810.1 > product ion m/z 303.0 (cleaved adenosine diphosphate). Optimize collision energy.
- Quantification: Generate a standard curve using pure acetyl-CoA and normalize peak areas to the internal standard and cell dry weight.
Protocol: Flux Analysis via ¹³C-Metabolic Flux Analysis (¹³C-MFA)
Principle: Cells are fed with a ¹³C-labeled substrate (e.g., [1-¹³C]glucose). The labeling pattern in proteinogenic amino acids (reflecting central metabolic intermediates) is measured by GC-MS and used to compute in vivo metabolic fluxes.
Procedure:
- Tracer Experiment: Grow engineered strain in minimal medium with 80% unlabeled + 20% [1-¹³C]glucose as sole carbon source. Harvest at mid-exponential phase.
- Hydrolysis & Derivatization: Hydrolyze cell pellet in 6M HCl at 105°C for 24h. Derivatize amino acids to their tert-butyldimethylsilyl (TBDMS) derivatives.
- GC-MS Analysis: Use a DB-5MS column. Detect mass isotopomer distributions (MIDs) of key fragments (e.g., alanine [M-57]⁺ from m/z 260 to 262).
- Flux Calculation: Input MIDs into software (e.g., INCA, 13CFLUX2) with a genome-scale metabolic model. Iteratively fit simulated to experimental MIDs to estimate net fluxes, including acetyl-CoA production and consumption rates.
The Scientist's Toolkit: Research Reagent Solutions
Table 2: Essential Reagents and Kits for Acetyl-CoA/Lipid Research
| Item | Supplier Examples | Function / Application |
|---|---|---|
| Acetyl-CoA, [¹³C₂]-, Sodium Salt | Cambridge Isotope Labs, Sigma-Aldrich | Internal standard for absolute quantification of acetyl-CoA pools via LC-MS/MS. |
| PicoProbe Acetyl-CoA Fluorometric Assay Kit | BioVision | Enzymatic, fluorescence-based assay for rapid, relative quantification of acetyl-CoA levels in cell extracts. |
| Fatty Acid Methyl Ester (FAME) Mix | Supelco, Nu-Chek Prep | GC standard for identifying and quantifying microbial fatty acid profiles post-lipid extraction and transesterification. |
| Phire Plant Direct PCR Kit | Thermo Scientific | Rapid PCR genotyping from yeast/fungal colonies without lengthy DNA extraction, useful for screening transformants. |
| Gibson Assembly Master Mix | New England Biolabs | Seamless assembly of multiple DNA fragments for constructing complex metabolic pathways. |
| Yeast Synthetic Drop-out Medium Supplements | US Biological, Sunrise Science | For auxotrophic selection and plasmid maintenance in S. cerevisiae and Y. lipolytica. |
| C/N Limited Media for Lipid Accumulation | Formulated per protocol; kits from HiMedia | Defined media with high C/N ratio (e.g., 60:1) to trigger oleaginous phenotype in various microbes. |
| Chloroform: Methanol (2:1 v/v) HPLC Grade | Fisher Scientific | Standard solvent for Bligh & Dyer total lipid extraction from microbial biomass. |
Integrated Engineering Workflow
A systematic approach is required to successfully enhance acetyl-CoA-driven lipid production.
Diagram 2: Integrated metabolic engineering workflow.
Enhancing acetyl-CoA pools remains the linchpin for advancing lipid biosynthesis in microbial cell factories. Success hinges on an integrated systems biology approach, combining precise genetic manipulations—such as the expression of deregulated, heterologous acetyl-CoA generating enzymes—with rigorous analytical validation. Future research must address the thermodynamic and redox bottlenecks of acetyl-CoA formation from C1 feedstocks (CO₂, methanol) and develop dynamic regulatory circuits to balance acetyl-CoA flux between growth and product synthesis, ultimately enabling economically viable and sustainable lipid production.
Within the paradigm of microbial cell factories for sustainable lipid production, a central challenge is the inherent inefficiency of metabolic networks. Native pathways in oleaginous yeasts (e.g., Yarrowia lipolytica) or bacteria (e.g., Rhodococcus opacus) are seldom optimized for maximum carbon conversion to target lipids. Metabolic bottlenecks—rate-limiting steps caused by enzyme kinetics, regulatory mechanisms, or thermodynamic constraints—divert flux away from lipid biosynthesis. This whitepaper provides an in-depth technical guide to identifying and overcoming these bottlenecks to redirect carbon flux toward enhanced lipid yield and productivity, a critical pursuit for sustainable biofuel and oleochemical production.
Identifying Key Metabolic Bottlenecks
The initial step involves systematic identification of flux control points within central carbon metabolism and lipid biosynthetic pathways.
Multi-Omics Analysis for Bottleneck Identification
Protocol: Integrated Transcriptomics, Proteomics, and Metabolomics Workflow
- Culture & Sampling: Grow the microbial strain under lipid-accumulating conditions (e.g., nitrogen limitation). Harvest cells at multiple time points (early growth, induction, stationary phase) in biological triplicate.
- RNA Sequencing (Transcriptomics): Extract total RNA using a kit with genomic DNA removal. Prepare libraries and sequence. Map reads to reference genome and quantify gene expression. Identify differentially expressed genes between high- and low-lipid producing conditions.
- LC-MS/MS Proteomics: Lyse cells, digest proteins with trypsin, and label with TMT reagents for multiplexing. Analyze peptides via Liquid Chromatography-Tandem Mass Spectrometry (LC-MS/MS). Identify and quantify proteins, focusing on metabolic enzymes.
- GC-MS Metabolomics: Perform quenching metabolism rapidly (60% methanol at -40°C). Extract intracellular metabolites. Derivatize polar metabolites (e.g., using MSTFA) for Gas Chromatography-Mass Spectrometry (GC-MS) analysis. Quantify relative abundances.
Table 1: Quantitative Multi-Omics Data Indicative of a Bottleneck in Yarrowia lipolytica
| Pathway/Enzyme | Gene | Transcript Fold Change (N-limited/Replete) | Protein Abundance Change | Metabolite Accumulation (Upstream) |
|---|---|---|---|---|
| Glycolysis (PFK) | PFK1 | +1.5 | +30% | Fructose-6-P (↑ 2.1x) |
| Pentose Phosphate (G6PDH) | ZWF1 | +3.2 | +2.1x | Glucose-6-P (↑ 1.8x) |
| TCA Cycle (ACL) | ACL1 | +0.8 | No change | Citrate (↑ 5.7x) |
| Lipogenesis (ACC) | ACC1 | +2.5 | +1.5x | Malonyl-CoA (↓ 0.3x) |
Interpretation: High citrate accumulation with unchanged ACL suggests a bottleneck at ATP-citrate lyase, limiting carbon export from the TCA cycle for acetyl-CoA synthesis. Low malonyl-CoA despite upregulated ACC indicates a potential secondary bottleneck at acetyl-CoA carboxylase.
13C Metabolic Flux Analysis (13C-MFA)
Protocol: Steady-State 13C Tracer Experiment
- Tracer Design: Use [1-13C]glucose or [U-13C]glucose as the sole carbon source in a defined minimal medium.
- Chemostat Cultivation: Achieve metabolic steady-state in a controlled bioreactor (dilution rate ~0.05 h⁻¹).
- Sampling & Analysis: Harvest cells, extract proteinogenic amino acids via hydrolysis, and analyze 13C labeling patterns via GC-MS.
- Flux Estimation: Use software (e.g., INCA, OpenFlux) to fit a metabolic network model to the measured mass isotopomer distributions, calculating intracellular reaction rates (fluxes).
Core Strategies for Redirecting Carbon Flux
Enzyme Engineering to Overcome Kinetic Limitations
For bottlenecks identified via kinetics (e.g., low kcat, high Km).
- Protocol: Directed Evolution of a Rate-Limiting Enzyme (e.g., ATP-Citrate Lyase, ACL)
- Library Construction: Create an error-prone PCR or saturation mutagenesis library of the ACL gene targeting the active site or regulatory domains.
- Functional Screening: Express the library in an auxotrophic yeast strain lacking endogenous ACL, grown on a plate with acetate as the sole carbon source. Improved ACL variants enable growth.
- Characterization: Purify top hits, measure kinetic parameters (kcat, Km, Ki), and test in the production host.
Table 2: Kinetic Parameters of Engineered vs. Wild-Type Enzymes
| Enzyme Variant | kcat (s⁻¹) | Km for Citrate (mM) | Specific Activity (U/mg) |
|---|---|---|---|
| Wild-Type ACL | 12.5 | 0.85 | 15.0 |
| Mutant A (S52P) | 9.8 | 0.21 | 18.2 |
| Mutant B (R124L) | 31.4 | 0.92 | 48.7 |
| Mutant C (S52P/R124L) | 29.8 | 0.18 | 52.1 |
Pathway Gene Dosage and Expression Tuning
Amplifying flux through a pathway by modulating expression levels.
- Protocol: Promoter and Gene Copy Number Optimization
- Construct a series of integrative expression cassettes for a target gene (e.g., ACC1) driven by promoters of varying strength (e.g., TEF1 (strong), HXT7 (medium), EXP1 (inducible)).
- Integrate single and multiple copies into a genomic locus.
- Measure mRNA levels (qPCR), protein abundance (Western blot), and resulting lipid titer.
Dynamic Regulatory Circuits
Implement feedback-insensitive or metabolite-responsive systems to dynamically control flux.
- Protocol: Engineering a Malonyl-CoA Sensor-Actuator System
- Clone the E. coli FapR repressor (binds to fapO operator in presence of malonyl-CoA) and a synthetic promoter (PfapO) upstream of a fluorescent reporter.
- Characterize the dose-response curve between intracellular malonyl-CoA and reporter output.
- Rewire the circuit: replace the reporter with a gene that consumes malonyl-CoA (e.g., C16/18 acyl-ACP synthase) or a competing pathway inhibitor. Low malonyl-CoA de-represses expression, pulling flux into lipids.
Competing Pathway Deletion
Eliminate carbon sinks by knockout of key genes.
- Protocol: CRISPR-Cas9 Mediated Gene Deletion for β-oxidation Knockout
- Design sgRNAs targeting the PEX10 gene (essential for peroxisome biogenesis, required for β-oxidation in yeasts).
- Co-transform the strain with a plasmid expressing Cas9 and the sgRNA, alongside a repair DNA template containing a selection marker.
- Verify knockout via diagnostic PCR and phenotype (inability to grow on oleic acid as sole carbon source).
Cofactor and Energy Balancing
Modify redox (NADPH/NADH) and ATP/ADP ratios to favor anabolic reactions.
- Protocol: Enhancing NADPH Supply via Pentose Phosphate Pathway (PPP) Overexpression
- Overexpress the rate-limiting PPP enzymes Glucose-6-phosphate dehydrogenase (ZWF1) and 6-Phosphogluconolactonase (SOL3) under a strong constitutive promoter.
- Measure the NADPH/NADP⁺ ratio using enzymatic cycling assays.
- Quantify the effect on lipid profile; PPP overexpression often increases lipid saturation due to higher NADPH for desaturases.
Visualization of Strategies and Pathways
Title: Metabolic Bottlenecks & Intervention Points in Lipid Synthesis
Title: Iterative Metabolic Engineering Workflow
The Scientist's Toolkit: Research Reagent Solutions
Table 3: Essential Reagents for Metabolic Flux Redirection Studies
| Reagent / Kit / Material | Function & Application |
|---|---|
| [U-13C] Glucose Tracer | Essential carbon source for 13C Metabolic Flux Analysis (13C-MFA) to quantify intracellular reaction rates. |
| Yeast/Bacterial Codon-Optimized Gene Synthesis | Provides high-expression, tailored DNA sequences for heterologous pathway expression or enzyme engineering. |
| CRISPR-Cas9 Kit (e.g., for Y. lipolytica or E. coli) | Enables precise gene knockouts (competing pathways), knock-ins (new pathways), and promoter replacements. |
| LC-MS/MS Grade Solvents & Columns (C18, HILIC) | Critical for high-resolution metabolomics and lipidomics to quantify intermediates and final products accurately. |
| NADPH/NADH Quantification Kit (Fluorometric) | Measures intracellular cofactor ratios to assess the redox state and the success of cofactor engineering strategies. |
| Lipid Extraction Kit (e.g., Methyl-tert-butyl ether method) | Standardized, high-recovery extraction of total lipids for gravimetric analysis or downstream profiling. |
| Phusion High-Fidelity DNA Polymerase | Used for error-free cloning of large constructs and assembly of multi-gene pathways via Gibson or Golden Gate assembly. |
| Strong/Inducible Promoter Plasmid Library (pTEF, pGPD, pCu) | Toolkit for fine-tuning gene expression levels of pathway enzymes to optimize flux. |
| GC-MS Derivatization Reagent (e.g., MSTFA) | Silanizes polar metabolites for accurate quantification of intracellular metabolome via GC-MS. |
| Microfluidic Droplet Generator | Enables high-throughput screening of enzyme or strain libraries based on lipid accumulation via fluorescence-activated sorting. |
The development of microbial cell factories for sustainable lipid production represents a cornerstone of next-generation biomanufacturing, aiming to produce biofuels, oleochemicals, and nutraceuticals. A critical translational step in this research is the successful scale-up of fermentation from laboratory-scale shake flasks to pilot and industrial-scale bioreactors. This transition is not merely a volumetric increase but a complex engineering challenge involving fundamental changes in physical, chemical, and biological parameters that directly impact microbial physiology, lipid yield, and productivity. Failure to adequately manage scale-up can lead to suboptimal performance, metabolic shifts away from lipid accumulation, and failed technology transfers.
Key Scale-Up Parameters and Challenges
The core challenge lies in maintaining optimal physiological conditions for the oleaginous microorganism (e.g., Yarrowia lipolytica, Rhodotorula toruloides, engineered S. cerevisiae) as the culture volume increases. Key parameters that change non-linearly with scale include:
- Mixing Time: Increases dramatically, leading to gradients in nutrients (e.g., carbon/nitrogen ratio critical for lipid induction), dissolved oxygen (DO), and pH.
- Oxygen Transfer Rate (OTR): The volumetric oxygen transfer coefficient (kLa) is often the limiting factor for aerobic lipid synthesis. Maintaining high kLa at large scales requires significant energy input via agitation and aeration.
- Heat Transfer: The metabolic heat generated per unit volume remains constant, but the surface area for cooling increases by the square, while volume increases by the cube, making temperature control more difficult.
- Shear Stress: Increased agitation and aeration to enhance mixing and OTR can subject cells to detrimental hydrodynamic shear, affecting morphology and viability.
Quantitative Comparison of Fermentation Systems
The table below summarizes the quantitative differences and typical operating ranges across scales relevant to lipid production research.
Table 1: Comparative Analysis of Fermentation Systems for Lipid Production
| Parameter | Laboratory Shake Flask (250 mL) | Benchtop Bioreactor (5 L) | Pilot-Scale Bioreactor (500 L) | Industrial Bioreactor (50,000 L) |
|---|---|---|---|---|
| Working Volume | 50-100 mL | 3-4 L | 300-350 L | 35,000-40,000 L |
| Primary Mixing Mechanism | Orbital Shaking | Rushton/Impeller + Baffles | Multi-impeller + Baffles | Multi-impeller + Baffles |
| Aeration | Surface Diffusion from Headspace | Sparged Air/ Oxygen, Controlled DO | Sparged Air/ Oxygen, Controlled DO | Sparged Air/ Oxygen, Controlled DO |
| kLa (h⁻¹) Range | 5 - 150 | 50 - 300 | 50 - 200 | 50 - 150 |
| Mixing Time | Seconds | 10 - 30 seconds | 30 - 120 seconds | 2 - 10 minutes |
| Power Input (W/m³) | Low (~50) | Medium-High (500 - 5,000) | High (1,000 - 10,000) | Varies (Optimized) |
| pH Control | None/Buffered | Automated (acid/base) | Automated (acid/base) | Automated (acid/base) |
| Feed Strategy | Batch | Fed-Batch, Continuous | Fed-Batch, Continuous | Fed-Batch, Continuous |
| Typial Lipid Titer (g/L)* | 5 - 15 | 50 - 100 | 80 - 120 | 80 - 120 |
| Lipid Productivity (g/L/h)* | 0.05 - 0.15 | 0.5 - 1.2 | 0.7 - 1.5 | 0.7 - 1.5 |
*Titer and productivity are highly strain and process-dependent. Values represent potential optima for advanced oleaginous yeast on glucose/sucrose.
A Detailed Scale-Up Protocol for Oleaginous Yeast
This protocol outlines a stepwise methodology for scaling up a fed-batch process for lipid production from a shake flask to a benchtop bioreactor, a critical first scale-up step.
Stage 1: Shake Flask Process Optimization
- Objective: Determine optimal C/N ratio, pH, and micronutrients for lipid induction.
- Media: Defined medium with high carbon (e.g., 60 g/L glucose) and limiting nitrogen (e.g., C/N molar ratio > 60).
- Protocol:
- Inoculate 50 mL of seed medium in a 250 mL flask from a single colony. Incubate at 28-30°C, 200 rpm for 24h.
- Transfer 10% inoculum to 250 mL flasks containing 50 mL of production medium with varying C/N ratios (40, 60, 80, 100).
- Incubate at 28-30°C, 220 rpm for 120h. Sample at 24h intervals.
- Analyze: Dry Cell Weight (DCW), residual glucose (HPLC), lipid content (gravimetric or Nile Red/FACS), fatty acid profile (GC-FID).
Stage 2: Benchtop Bioreactor Scale-Up
- Objective: Translate optimal conditions to a controlled environment, establishing a feeding strategy to maintain high carbon availability while avoiding catabolite repression or oxygen limitation.
- Bioreactor Setup: 5 L vessel with 3.5 L working volume. Equipped with DO, pH, temperature probes, and automated control loops.
- Protocol:
- Inoculum Prep: Scale seed culture in shake flasks to 350 mL (10% of working volume).
- Batch Phase: Charge bioreactor with initial production medium (e.g., 30 g/L glucose, limiting N). Calibrate probes. Inoculate. Set controls: T=30°C, pH=6.0 (controlled with NH4OH, which also serves as nitrogen source), DO=30% (cascaded control: agitation 300-800 rpm, aeration 0.5-2.0 vvm).
- Fed-Batch Phase: Upon glucose depletion (DO spike), initiate carbon feed (e.g., 500 g/L glucose solution). Feeding rate is critical and can be:
- Pre-defined: Exponential feed matching maximum growth rate (μmax).
- DO-Stat: Feed triggered to maintain DO above a setpoint.
- pH-Stat: Feed triggered by pH rise due to ammonia consumption.
- Process Monitoring: Sample every 6-12h for DCW, substrate, by-products, and lipid analysis.
- Harvest: At 96-144h, or when lipid productivity declines. Centrifuge cells for lipid extraction.
Key Pathways and Workflows
Diagram 1: Microbial Lipid Synthesis & Scale-Up Impact (Max 760px)
Diagram 2: Experimental Scale-Up Workflow (Max 760px)
The Scientist's Toolkit: Key Reagents & Materials
Table 2: Essential Research Reagent Solutions for Lipid Production Scale-Up
| Item | Function/Application in Lipid Research | Example/Note |
|---|---|---|
| Defined Fermentation Media | Provides controlled C/N ratio and micronutrients (e.g., high glucose, limiting ammonium sulfate). Eliminates variability of complex extracts. | Yeast Nitrogen Base (YNB) with amino acids, or custom minimal media. |
| Lipid Induction Supplements | Compounds that shift metabolism towards lipid accumulation. | Methyl Oleate (FA precursor), Tween 80 (surfactant aiding uptake), specific nitrogen source (e.g., Yeast Extract in low conc.). |
| In Vivo Lipid Stains | For rapid, quantitative assessment of lipid content in cells during fermentation. | Nile Red: Fluorometric stain for neutral lipids. Compatible with flow cytometry for population analysis. BODIPY 493/503: More specific neutral lipid stain. |
| Off-Gas Analyzers | Measures O2 and CO2 in exhaust gas. Critical for calculating OUR (O2 Uptake Rate), CER (CO2 Evolution Rate), and RQ (Respiratory Quotient). | Mass Spectrometer or Gas Analyzer. RQ >1 indicates de novo lipogenesis. |
| Nitrogen-Limited Feed Solution | Concentrated carbon source (e.g., glucose syrup) with strictly controlled trace nitrogen for fed-batch phase. | Enables extended lipid production phase by maintaining carbon excess while keeping nitrogen limiting. |
| Antifoam Agents | Controls foam formation from proteins/lipids at high aeration and agitation. | Polypropylene glycol-based (PPG) or silicone-based emulsions. Automatic dosing is essential at scale. |
| Process Control Software | For real-time monitoring and automated control of pH, DO, temperature, feed pumps, and agitation. | Enables precise implementation of feeding strategies (exponential, DO-stat) and data logging. |
| Fatty Acid Methyl Ester (FAME) Kits | For derivatization of cellular lipids for subsequent Gas Chromatography (GC) analysis of fatty acid profile. | Standardized kits (e.g., from Sigma-Aldrich) ensure reproducible conversion of TAGs to volatile FAMEs. |
This whitepaper details the critical downstream processing (DSP) pipeline required to realize the promise of microbial cell factories for sustainable lipid production. While metabolic engineering advances strain productivity, efficient extraction and purification are paramount for economic viability, especially in high-value sectors like nutraceuticals and pharmaceuticals.
Cell Disruption and Primary Recovery
The first step liberates intracellular lipids.
Experimental Protocol: High-Pressure Homogenization (HPH) for Yarrowia lipolytica
- Biomass Preparation: Harvest cells from fermentation broth via centrifugation (8,000 x g, 15 min, 4°C). Wash pellet with deionized water and concentrate to 100-150 g/L dry cell weight (DCW).
- Homogenization: Pass the cell suspension through a high-pressure homogenizer (e.g., APV Gaulin). Maintain temperature below 10°C using an ice bath or cooled jacket.
- Optimization: Perform passes at progressively increasing pressures (e.g., 500, 800, 1000 bar). Monitor disruption efficiency by measuring lipid release or direct cell counting.
- Recovery: Centrifuge the homogenate (5,000 x g, 20 min) to separate cell debris (pellet) from the crude lipid-containing supernatant.
Table 1: Efficiency of Common Cell Disruption Methods
| Method | Mechanism | Optimal Organism | Lipid Recovery Yield (%) | Energy Intensity |
|---|---|---|---|---|
| High-Pressure Homogenization | Shear stress, cavitation | Yeast, algae | 85-95 | High |
| Bead Milling | Mechanical grinding | Microalgae, fungi | 80-90 | Very High |
| Ultrasonication | Acoustic cavitation | Lab-scale bacteria | 70-85 | Medium |
| Chemical Lysis (Alkali) | Saponification of membranes | Oleaginous yeast | 75-88 | Low |
Lipid Extraction Techniques
Experimental Protocol: Modified Bligh & Dyer Solvent Extraction
- Sample: Use 1 mL of cell homogenate or 100 mg of freeze-dried biomass.
- Solvent System: Add 3.75 mL of a 1:2 (v/v) chloroform:methanol mixture to the sample in a glass centrifuge tube. Vortex vigorously for 10 minutes.
- Phase Separation: Add 1.25 mL of chloroform and 1.25 mL of deionized water. Vortex for another 2 minutes.
- Centrifugation: Centrifuge at 1,000 x g for 10 minutes to achieve a clear biphasic separation.
- Collection: Carefully aspirate the lower organic phase (chloroform layer containing lipids) using a glass syringe or pipette.
- Evaporation: Evaporate the solvent under a gentle stream of nitrogen gas. Weigh the recovered lipid.
Table 2: Comparison of Advanced Lipid Extraction Strategies
| Strategy | Principle | Key Advantage | Scalability | Purity (Total Lipids) |
|---|---|---|---|---|
| Classical Solvent (Bligh & Dyer) | Polarity-based partitioning | High yield, universal | Pilot/Industrial | ~98% |
| Supercritical CO₂ (SC-CO₂) | Tunable solvent density | Solvent-free, mild | Industrial | 85-95% |
| Ionic Liquid (IL) Assisted | Cell wall dissolution, partitioning | High selectivity for neutrals | Lab/Pilot | 90-97% |
| Electrostatic Separation | Dielectric properties | No solvent, low energy | Early-stage | 70-80% |
Purification and Fractionation
Targeted purification is essential for pharmaceutical applications.
Experimental Protocol: Solid-Phase Extraction (SPE) for Fatty Acid Methyl Ester (FAME) Purification
- Column Preparation: Condition a silica-based SPE cartridge (e.g., 500 mg/6 mL) with 5 mL of hexane.
- Sample Loading: Dissolve the crude lipid extract (~50 mg) in 0.5 mL of hexane and load onto the column.
- Fraction Elution: Elute fractions sequentially:
- Fraction 1 (Neutral Lipids): 5 mL of hexane:diethyl ether (9:1, v/v).
- Fraction 2 (Free Fatty Acids): 5 mL of diethyl ether with 2% acetic acid.
- Fraction 3 (Polar Lipids): 5 mL of methanol.
- Collection: Collect each fraction separately. Evaporate solvents and analyze via TLC or GC-MS.
The Scientist's Toolkit: Research Reagent Solutions
Table 3: Essential Materials for Microbial Lipid DSP
| Item | Function & Specification | Example Application |
|---|---|---|
| Chloroform-Methanol Mixture | Organic solvent pair for total lipid extraction via the Folch or Bligh & Dyer method. | Primary extraction from bacterial biomass. |
| Supercritical CO₂ Fluid | Green, tunable solvent for extraction; critical point at 31.1°C and 73.8 bar. | Selective extraction of triglycerides from microalgae. |
| Silica Gel SPE Cartridges | Stationary phase for normal-phase chromatography to fractionate lipid classes by polarity. | Separating phospholipids from neutral lipids. |
| Pre-coated TLC Plates (Silica G60) | Analytical tool for rapid lipid class separation and visualization. | Monitoring lipid composition post-extraction. |
| Transesterification Reagent | Methanol with catalyst (e.g., H₂SO₄ or NaOH) to convert lipids to FAMEs for GC analysis. | Fatty acid profile analysis. |
| C18 Reverse-Phase Column | HPLC column for high-resolution separation of individual lipid species. | Purification of specific omega-3 fatty acids (EPA/DHA). |
Visualization: Downstream Processing Workflow
Microbial Lipid DSP Workflow
Visualization: Lipid Fractionation Logic
Lipid Fractionation Method Selection
An optimized, integrated downstream process is the linchpin for translating advances in microbial lipid production into commercially viable and sustainable biorefineries. The choice of techniques must be tailored to the microbial host, lipid profile, and target product purity, balancing yield, cost, and environmental impact.
Solving Scale-Up Challenges: Maximizing Titer, Yield, and Productivity
Identifying and Overcoming Common Fermentation Contaminants
Within the critical pursuit of developing robust microbial cell factories for sustainable lipid production, contamination remains a primary bottleneck. This technical guide details prevalent contaminants, their impact on lipid yield, and targeted mitigation strategies for bioreactor operations.
1. Major Contaminant Classes and Impact on Lipid Production
| Contaminant Class | Common Species | Primary Impact on Oleaginous Yeast/Fungi | Typical Source |
|---|---|---|---|
| Competing Bacteria | Lactobacillus spp., Acetobacter spp. | Acidification, substrate competition, reduced lipid titer. | Feedstock, inoculum, air supply. |
| Wild Yeasts | Non-oleaginous Saccharomyces, Candida spp. | Nutrient depletion, secretion of inhibitory metabolites. | Improper sterilization, facility surfaces. |
| Filamentous Fungi | Penicillium spp., Aspergillus spp. | Mycotoxin production, hyphal disruption of rheology. | Airborne spores, raw materials. |
| Bacteriophages | Specific to bacterial hosts (if using bacterial MCFs) | Lysis of bacterial lipid producers, culture collapse. | Contaminated lysogen feedstock. |
Table 1: Quantitative Impact of Contamination on a Model Yarrowia lipolytica Fermentation
| Contaminant Introduced (at 12h) | Final DCW (g/L) | Lipid Titer (g/L) | Lipid Content (% DCW) | Reduction in Lipid Yield vs. Aseptic |
|---|---|---|---|---|
| None (Control) | 85.2 ± 2.1 | 42.1 ± 1.8 | 49.4 | 0% |
| Lactobacillus brevis | 61.5 ± 5.3 | 18.7 ± 3.1 | 30.4 | 55.6% |
| Wild S. cerevisiae | 73.8 ± 3.4 | 25.9 ± 2.2 | 35.1 | 38.5% |
| Penicillium chrysogenum | 52.1 ± 6.7 | 9.8 ± 2.5 | 18.8 | 76.7% |
2. Detection and Identification Protocols
Protocol 2.1: Rapid Gram-Staining for Bacterial Contaminant Triage
- Prepare a thin smear from a centrifuged (5,000 x g, 5 min) 1 mL broth sample on a microscope slide.
- Heat-fix the smear. Flood with crystal violet (primary stain) for 60 seconds. Rinse gently with deionized water.
- Flood with Gram's iodine (mordant) for 60 seconds. Rinse.
- Decolorize with 95% ethanol for 10-15 seconds, then rinse immediately.
- Flood with safranin (counterstain) for 45 seconds. Rinse and air dry.
- Observe under oil immersion (1000x magnification). Gram-positive bacteria (purple) are common lactic acid bacteria; Gram-negative (pink) may be Acetobacter or other.
Protocol 2.2: PCR-Based Identification of Fungal Contaminants
- DNA Extraction: Lyse pelleted cells from 5 mL culture using a commercial fungal/bacterial DNA kit (e.g., ZymoBIOMICS DNA Miniprep).
- PCR Amplification: Use universal primers ITS1 (5'-TCCGTAGGTGAACCTGCGG-3') and ITS4 (5'-TCCTCCGCTTATTGATATGC-3') targeting the ITS region.
- Reaction Mix (50 µL): 10-50 ng template DNA, 1X PCR buffer, 2.5 mM MgCl₂, 0.2 mM dNTPs, 0.5 µM each primer, 1.25 U Taq DNA polymerase.
- Cycling: Initial denaturation 95°C/3min; 35 cycles of [95°C/30s, 55°C/30s, 72°C/1min]; final extension 72°C/5min.
- Analysis: Purify PCR product and sequence. Align sequence to NCBI GenBank via BLAST for species identification.
Diagram 1: Contaminant identification and mitigation workflow.
3. Mitigation Strategies and Engineering Solutions
Table 2: Targeted Strategies for Common Contaminants
| Contaminant | Process Adjustment | Engineering Solution (Strain Modification) |
|---|---|---|
| Acid-producing Bacteria | Maintain pH >5.0; use sterilized carbon sources. | Express heterologous bacteriocins; engineer low-pH tolerance in host. |
| Wild Yeasts | Use antibiotics (e.g., cycloheximide at 0.1 g/L) in pre-culture media only. | Develop auxotrophic strains (e.g., uracil, leucine) requiring supplemented media. |
| Mold Spores | Install 0.2 µm HEPA filtration on all air inlets/outlets. | Engineer strains to utilize non-standard carbon sources (e.g., alkanes, acetate). |
| Phages (Bacterial Systems) | Rotate bacterial host strains with different phage resistance profiles. | Employ CRISPR-Cas systems for phage immunity in bacterial MCFs. |
Protocol 3.1: Fermentation Media Optimization for Contaminant Suppression For Y. lipolytica lipid production, modify standard YPD media to a defined, antibiotic-free, low-pH medium:
- Base Medium (per liter): 80g glucose, 7.5g (NH₄)₂SO₄, 1.5g KH₂PO₄, 0.5g MgSO₄·7H₂O, 0.1g NaCl, 0.02g CaCl₂·2H₂O, 0.008g FeCl₃·6H₂O, 0.001g ZnSO₄·7H₂O. Adjust to pH 4.5-5.0 using 2M HCl before sterilization (121°C, 20 min).
- Rationale: Low initial pH inhibits many bacteria. Defined minerals prevent carryover of organic contaminants. High C/N ratio (~70:1) favors lipid accumulation over growth of many contaminants.
Diagram 2: Mitigation pathways for fermentation contaminants.
4. The Scientist's Toolkit: Research Reagent Solutions
| Item | Function in Contaminant Management |
|---|---|
| Cycloheximide | Selective agent (100 µg/mL) in pre-culture plates to inhibit wild yeast/fungi. Not used in production bioreactor. |
| Chloramphenicol | Broad-spectrum bacteriostatic antibiotic (30 µg/mL) for bacterial suppression in small-scale bacterial MCF cultures. |
| ITS1/ITS4 Primers | Universal primers for amplifying fungal ITS region for PCR-based identification of eukaryotic contaminants. |
| 27F/1492R Primers | Universal primers for amplifying bacterial 16S rRNA gene for bacterial contaminant identification. |
| Gram Stain Kit | For rapid morphological classification and triage of bacterial contaminants. |
| Zymolyase / Lyticase | Enzymes for lysing fungal/yeast cell walls to extract DNA for PCR analysis. |
| pH Indicator Strips (pH 3-6) | For quick, sterile checks of broth acidity, indicating potential bacterial contamination. |
| Selective Auxotrophic Media | Defined media lacking specific amino acids/nucleotides, enabling growth only of engineered auxotrophic production strains. |
Strategies to Alleviate Metabolic Burden and Cellular Toxicity
1. Introduction
Within the context of microbial cell factories for sustainable lipid production, achieving high yields is frequently hampered by metabolic burden and cellular toxicity. Metabolic burden arises from the energetic and biosynthetic demands of heterologous pathway expression, diverting resources from growth and native metabolism. Concurrently, the accumulation of target lipids (e.g., free fatty acids, fatty alcohols) or pathway intermediates can induce membrane stress, disrupt proton motive force, and trigger reactive oxygen species (ROS) formation, leading to cellular toxicity. This technical guide outlines integrated strategies to mitigate these challenges, thereby enhancing the robustness and productivity of oleaginous microbial chassis.
2. Quantitative Data Summary of Key Strategies
Table 1: Comparative Analysis of Strategies to Alleviate Metabolic Burden & Toxicity in Lipid-Producing Cell Factories
| Strategy Category | Specific Approach | Model Organism | Reported Lipid Titer Improvement | Key Measured Reduction |
|---|---|---|---|---|
| Pathway Optimization | Dynamic Pathway Regulation (Quorum-sensing) | Yarrowia lipolytica | ~40% increase in total lipids | Acetate accumulation reduced by 60% |
| Toxicity Engineering | Membrane Lipid Remodeling (∆desA + tetA) | Escherichia coli | Free Fatty Acid titer 2.1 g/L → 4.8 g/L | Cell viability increased 3.5-fold |
| Resource Allocation | tRNA Pool Augmentation | Saccharomyces cerevisiae | Fatty Acid Ethyl Ester production +25% | Expression burden (GFP reporter) decreased 70% |
| Product Sequestration | Lipid Droplet Engineering (LD-protein overexpression) | Rhodosporidium toruloides | Lipid content 65% → 72% CDW | ROS levels reduced by ~55% |
| Cofactor Balancing | Transhydrogenase (pntAB) Overexpression | E. coli | Fatty Alcohol production 1.5 g/L → 3.2 g/L | NADPH/NADP+ ratio stabilized |
3. Detailed Experimental Protocols
Protocol 1: Implementing Quorum-Sensing-Based Dynamic Control for Lipid Production
- Objective: To decouple growth and production phases, minimizing burden during exponential growth.
- Materials: Plasmid with lasI (AHL synthase) under constitutive promoter, lipid biosynthesis genes under lasR-responsive promoter (Plux), in Y. lipolytica host.
- Method:
- Clone the lasI gene under a moderate constitutive promoter (e.g., pTEF) into a genomic integration vector.
- Clone the key burden-inducing enzyme(s) (e.g., acetyl-CoA carboxylase, ACC1) under the Plux promoter in an expression vector.
- Co-transform constructs into Y. lipolytica Po1g strain. Select on appropriate media.
- Inoculate single colony in 5 mL YPD, grow overnight.
- Dilute culture to OD600 0.1 in 50 mL minimal nitrogen-limited media (e.g., YNB without amino acids, C/N ratio 60:1).
- Incubate at 28°C, 250 rpm. Monitor OD600 and AHL concentration (via bioreporter assay or HPLC-MS).
- Induced expression from Plux occurs auto-catalytically as AHL accumulates mid-exponential phase.
- Harvest cells at 96h for lipid extraction and analysis via GC-FAME.
Protocol 2: Assessing Membrane Toxicity via Fluorescent Probe Staining
- Objective: Quantify membrane integrity and ROS stress in response to fatty acid production.
- Materials: Propidium Iodide (PI), H2DCFDA, fatty acid-producing E. coli strain, flow cytometer.
- Method:
- Grow control (empty vector) and production strains in M9 media + 2% glucose to mid-exponential phase (OD600 ~0.6).
- Induce fatty acid pathway with 0.2% L-arabinose.
- After 4h induction, harvest 1 mL culture (10,000 x g, 2 min).
- For membrane integrity: Resuspend pellet in 1 mL PBS containing 5 µg/mL PI. Incubate in dark, 10 min, RT.
- For ROS: Resuspend separate pellet in 1 mL PBS with 10 µM H2DCFDA. Incubate 30 min, dark, 37°C.
- Wash cells twice with PBS, resuspend in 500 µL PBS.
- Analyze immediately using flow cytometry (PI: ex/em 535/617 nm; DCF: ex/em 488/525 nm). Collect 50,000 events per sample.
- Calculate percentage of PI-positive (compromised membrane) and mean DCF fluorescence intensity (ROS level) populations.
4. Mandatory Visualizations
5. The Scientist's Toolkit: Research Reagent Solutions
Table 2: Essential Reagents and Materials for Metabolic Burden & Toxicity Research
| Item | Supplier Examples | Function in Research |
|---|---|---|
| H2DCFDA (DCFH-DA) | Thermo Fisher, Sigma-Aldrich | Cell-permeable fluorescent probe for detecting intracellular reactive oxygen species (ROS). |
| Propidium Iodide (PI) | Thermo Fisher, BioVision | Membrane-impermeable DNA stain to label cells with compromised membrane integrity (dead cells). |
| N-Acyl Homoserine Lactone (AHL) Standards | Cayman Chemical, Sigma-Aldrich | Quantitative standards for calibrating quorum-sensing molecule measurements via HPLC-MS/GC-MS. |
| NADPH/NADP+ Assay Kit | Promega, Abcam | Colorimetric/Fluorimetric measurement of cofactor ratios to assess metabolic redox stress. |
| Fatty Acid Methyl Ester (FAME) Mix | Supelco, Nu-Chek Prep | GC standards for identifying and quantifying microbial lipid profiles. |
| SYBR Green I / RNA-seq Kits | Illumina, Thermo Fisher | Transcriptomic analysis to map global metabolic burden responses and pathway activity. |
| Tunable Control Plasmids (pTet, pBAD, etc.) | Addgene, Takara Bio | For precise titration of gene expression to identify burden tipping points. |
| Lipid Droplet Stain (BODIPY 493/503 or Nile Red) | Thermo Fisher, Invitrogen | Fluorescent staining of intracellular lipid droplets for visualization and quantification (microscopy/flow cytometry). |
Within the broader thesis on Microbial cell factories for sustainable lipid production, this whitepaper addresses a fundamental metabolic engineering and bioprocess challenge: directing carbon flux toward de novo lipogenesis and lipid body assembly. The carbon-to-nitrogen (C:N) ratio and the feeding strategy are the two most critical operational levers for shifting microbial physiology from growth-oriented biomass proliferation to lipid accumulation. This guide provides a technical synthesis of current principles, quantitative benchmarks, and protocols for optimizing these parameters in oleaginous yeasts (e.g., Yarrowia lipolytica, Rhodotorula toruloides), fungi (e.g., Mucor circinelloides), and engineered bacterial systems.
Foundational Principles of C:N Ratio Control
Oleaginous microorganisms accumulate lipids, primarily as triacylglycerols (TAGs), under conditions of nutrient imbalance. A high C:N ratio creates an environment where carbon is in excess, but nitrogen is limiting. Nitrogen exhaustion halts cell division and protein synthesis, but carbon uptake continues. The excess carbon is channeled through central metabolism (glycolysis, citrate cycle) into cytoplasmic acetyl-CoA pools, which serve as the substrate for the fatty acid synthase (FAS) complex. In many oleaginous yeasts, the key regulatory enzyme is ATP-citrate lyase (ACL), which generates cytosolic acetyl-CoA from citrate.
Table 1: Impact of C:N Ratio on Lipid Parameters in Select Microbes
| Strain | Substrate | Optimal C:N Ratio (mol/mol) | Max Lipid Content (% CDW) | Key Lipid Product | Reference Year |
|---|---|---|---|---|---|
| Yarrowia lipolytica (PO1f) | Glucose | 60-100:1 | ~45% | TAGs, FFAs | 2023 |
| Rhodotorula toruloides | Xylose | 80:1 | 58% | TAGs, Carotenoids | 2024 |
| Mucor circinelloides | Glucose | 40:1 | 35% | GLA-rich TAGs | 2023 |
| Cryptococcus curvatus | Glycerol | 70:1 | 50% | TAGs | 2022 |
| Engineered E. coli | Glucose | 20:1 (C limited) | 25% | FFAs, Wax esters | 2023 |
Advanced Feeding Strategies
Beyond batch culture with a fixed C:N ratio, dynamic feeding strategies offer superior control over lipid titer, yield, and productivity (g/L/h).
- Pulsed Feeding: After nitrogen depletion, concentrated carbon feed is added in pulses to avoid substrate inhibition (e.g., from glucose or acetate) and maintain metabolic activity.
- Continuous/Chemostat Culture: Allows separation of growth phase (low C:N) and lipid accumulation phase (high C:N) in a two-stage chemostat.
- Fed-Batch with DO-Stat or pH-Stat: The feed rate is controlled by dissolved oxygen (DO) or pH feedback, linking substrate addition to metabolic activity. A rise in DO signals carbon limitation, triggering a feed pulse.
- Co-feeding Strategies: Utilizing mixed substrates (e.g., glycerol with acetate, glucose with hydrophobic oils) can enhance precursor supply and redox balance (NADPH for FAS).
Table 2: Comparison of Feeding Strategies for Lipid Production
| Strategy | Mode | Key Advantage | Limitation | Best For |
|---|---|---|---|---|
| Batch | Single initial charge | Simplicity, easy data analysis | Low cell density, substrate inhibition | Initial screening |
| Nitrogen-Limited Fed-Batch | Feed starts at N depletion | High lipid content, avoids catabolite repression | Requires N-sensor or offline monitoring | Scale-up (Y. lipolytica) |
| Carbon-Limited Fed-Batch | Feed controlled to maintain low [C] | High cell density, minimizes by-products | Lower lipid content, complex control | High-biomass strains |
| Two-Stage Continuous | Chemostat (Stage1: growth, Stage2: lipid) | Maximizes volumetric productivity | High capital cost, risk of contamination | Dedicated production facility |
Detailed Experimental Protocols
Protocol: Determining the Critical C:N Ratio for Nitrogen Limitation
Objective: Identify the precise C:N ratio at which nitrogen is exhausted, triggering lipid accumulation. Materials: Defined medium (e.g., Yeast Nitrogen Base without amino acids), glucose (C source), ammonium sulfate (N source), shake flasks, spectrophotometer, centrifuges, nutrient assay kits.
- Medium Preparation: Prepare a base medium with a fixed, high concentration of carbon (e.g., 60 g/L glucose). Prepare separate nitrogen stock solutions.
- Culture Inoculation: Inoculate pre-culture into a series of flasks with varying (NH₄)₂SO₄ to create a C:N gradient (e.g., 5:1 to 150:1, mol/mol).
- Monitoring: Sample periodically (every 4-6 h). Measure OD₆₀₀ (biomass), residual glucose (DNS assay), and residual ammonium (ion-selective electrode or colorimetric assay).
- Analysis: Plot biomass vs. time and residual nutrients. The condition where biomass plateaus coincident with ammonium depletion, but glucose remains, indicates the critical C:N ratio. Correlate with lipid analysis via gravimetry or GC-FAME.
Protocol: DO-Stat Fed-Batch for High-Density Lipid Production
Objective: Implement a feedback-controlled fed-batch for high cell density and lipid titer. Materials: Bioreactor with DO and pH probes, peristaltic feed pump, data acquisition/control system, concentrated feed solution (e.g., 500 g/L glucose, minerals).
- Batch Phase: Begin with a moderate C:N (e.g., 20:1) to promote biomass buildup. Allow culture to grow until the initial carbon is depleted, signaled by a sharp rise in dissolved oxygen (DO).
- Feed Initiation & Control: Start concentrated feed pump when DO spikes >80%. Set control logic: WHEN DO > 80% → PUMP ON; WHEN DO < 40% → PUMP OFF.
- Lipid Accumulation Phase: The feed solution is designed to be nitrogen-limited (C:N >100:1). Cells continue to assimilate carbon into lipids without net growth.
- Harvest: Terminate when lipid productivity declines or reactor volume limit is reached. Analyze for dry cell weight, lipid content, and FAME profile.
Visualization of Key Pathways and Workflows
Title: Metabolic Shift from Growth to Lipid Synthesis
Title: DO-Stat Fed-Batch Feedback Control Loop
The Scientist's Toolkit: Key Research Reagent Solutions
Table 3: Essential Materials and Reagents for Lipid Accumulation Studies
| Item/Category | Example Product/Kit | Function & Rationale |
|---|---|---|
| Defined Minimal Media | Yeast Nitrogen Base (YNB) w/o AA, M9 salts | Provides precise control over C and N sources for ratio manipulation. Essential for reproducible physiological studies. |
| Nitrogen Assay Kit | Ammonium Assay Kit (Colorimetric/Fluorometric) | Accurately quantifies residual ammonium in culture broth to confirm nitrogen limitation onset. |
| Carbon Assay Reagents | DNS Reagent for reducing sugars, HPLC standards (e.g., Glucose) | Monitors carbon substrate consumption kinetics, critical for feeding strategy optimization. |
| Lipid Extraction Solvent | Chloroform:Methanol (2:1 v/v) mixture | Standard Bligh & Dyer solvent for total lipid extraction from microbial biomass. |
| TAG & FAME Analysis | Triacylglycerol Quantification Kit, Fatty Acid Methylation Reagents (BF₃/Methanol) | Enables specific quantification of TAGs and compositional analysis via GC-FAME. |
| Neutral Lipid Stain | Nile Red or BODIPY 493/503 | Fluorescent vital stain for rapid, in situ visualization and semi-quantification of lipid droplets via flow cytometry or microscopy. |
| Enzymatic Assay Kits | ATP-Citrate Lyase (ACL) Activity Assay Kit | Measures activity of a key regulatory enzyme in oleaginous pathways, linking metabolic state to lipid output. |
| Bioreactor Probes & Control | Sterilizable DO & pH Probes, PID Controller Module | Enables implementation of advanced feeding strategies (DO-stat, pH-stat) in controlled bioreactors. |
This whitepaper provides an in-depth technical guide on implementing -omics-driven process monitoring within the specific research framework of Microbial Cell Factories for Sustainable Lipid Production. The transition from batch to continuous and intensively monitored bioprocesses is critical for achieving economically viable yields of microbial lipids (e.g., from Yarrowia lipolytica, Rhodotorula toruloides, or engineered cyanobacteria) for biofuels, oleochemicals, and nutraceuticals. Real-time control based on -omics data moves beyond traditional pH, dissolved oxygen, and off-gas metrics, enabling dynamic optimization of metabolic pathways toward lipid accumulation.
Core -Omics Modalities for Lipid Production Monitoring
Three primary -omics layers are integrated for holistic process insight.
Transcriptomics (e.g., via RT-qPCR, microfluidic RT-PCR, or RNA-Seq of rapidly quenched samples) reveals the real-time expression of genes in pathways like fatty acid synthase (FAS), acetyl-CoA carboxylase (ACC), and diacylglycerol acyltransferase (DGAT), as well as nitrogen-starvation responses that trigger lipid accumulation.
Proteomics (via rapid MALDI-TOF or liquid chromatography-mass spectrometry (LC-MS) of digested samples) confirms the translation of key enzymes, providing a more stable indicator of metabolic state than mRNA.
Metabolomics (via rapid sampling coupled to LC-MS or GC-MS) quantifies intracellular and extracellular metabolite pools (acetyl-CoA, NADPH, citric acid, triglycerides) and fluxes, offering the most direct snapshot of metabolic activity.
Fluxomics, though not real-time in a traditional sense, can be inferred from metabolomics and 13C-tracer studies integrated into the process to validate estimated pathway activities.
Real-Time Data Acquisition & Integration Workflow
The pathway from sample to control action must be drastically compressed. The following workflow diagram illustrates the integrated pipeline.
Diagram Title: Real-Time Multi-omics Process Control Loop
Key Experimental Protocols for Implementation
Protocol: Rapid Sampling for Intracellular Metabolomics & Transcriptomics
Purpose: Capture instantaneous metabolic state for lipid pathway analysis.
- Equipment: Automated sterile syringe sampler or fast filtration manifold.
- Quenching: Direct expulsion into cold (< -40°C) 60% aqueous methanol (for metabolomics) or into RNAprotect reagent (for transcriptomics). Contact time < 2 seconds.
- Extraction:
- Metabolites: Use cold methanol/chloroform/water (2:2:1) with bead-beating. Centrifuge. Separate polar (aqueous) and non-polar (lipid) phases for LC-MS/GC-MS.
- RNA: For transcriptomics, proceed with hot phenol-chloroform extraction or commercial kit from quenched cell pellet.
- Analysis: Direct injection to LC-MS (HILIC for polar, C18 for non-polar) or derivatization for GC-MS. For transcripts, use rapid RT-qPCR panel for ~50 key lipid genes.
Protocol: Building a Calibration Dataset for Multivariate Modeling
Purpose: Generate data to train soft-sensors (PLS, ANN) linking -omics snapshots to process outcomes.
- Design: Perform fermentations with systematic variations in key parameters (C/N ratio, pH, DO, feed rate) known to affect lipid yield.
- Sampling: Take frequent samples (every 1-3 hours) for all -omics layers and offline analytics (lipid titer by GC, cell dry weight).
- Data Alignment: Time-align all datasets. Normalize -omics data (e.g., TPM for RNA, iBAQ for proteins, peak area for metabolites).
- Model Training: Use tools like SIMCA, R (ropls), or Python (scikit-learn) to build Partial Least Squares (PLS) regression models predicting lipid accumulation rate from a subset of early -omics markers.
Data Presentation: Quantitative Performance of -Omics Monitoring
Table 1: Comparison of -Omics Modalities for Real-Time Lipid Process Monitoring
| Modality | Approx. Time-to-Result | Key Measurables in Lipid Pathways | Information Depth | Integration Complexity |
|---|---|---|---|---|
| Transcriptomics | 1-3 hours (qPCR) | ACC1, FAS1, DGA1 mRNA levels; stress response genes | High (specific pathway insight) | Medium |
| Proteomics | 2-4 hours (Rapid LC-MS) | ACC, FAS, malic enzyme protein abundance | Medium (confirms enzyme presence) | High |
| Metabolomics | 10-30 minutes (Direct MS) | Acetyl-CoA, Citrate, Malonyl-CoA, NADPH/NADP+, extracellular lipids | High (direct functional readout) | Medium |
| Fluxomics (13C) | 4-8 hours (GC-MS) | Flux through pentose phosphate vs. glycolysis; TCA cycling | Very High (dynamic fluxes) | Very High |
Table 2: Example -Omics Biomarkers for Lipid Overproduction in Y. lipolytica
| Biomarker Type | Specific Target | Expected Change during High Lipid Production | Potential Control Action |
|---|---|---|---|
| Transcript | DGA1 (Diacylglycerol acyltransferase) | >10-fold upregulation | Maintain nitrogen limitation |
| Metabolite | Intracellular Citrate | Sharp increase preceding lipid accumulation | Increase oxygen to boost TCA cycle precursor |
| Metabolite Ratio | NADPH/NADP+ | Sustained elevated ratio | Optimize carbon source (e.g., glycerol vs glucose) |
| Extracellular Metab. | Polyol secretion | Sudden appearance indicates metabolic overflow | Reduce carbon feed rate |
Signaling Pathways in Oleaginous Microbes: A Control Perspective
Understanding the nutrient-sensing pathways is key to rational control. The following diagram maps the core regulatory network linking nutrient status to lipid accumulation.
Diagram Title: Nutrient Sensing & Lipid Synthesis Regulatory Network
The Scientist's Toolkit: Research Reagent Solutions
Table 3: Essential Reagents and Kits for -Omics Bioprocess Monitoring
| Item | Supplier Examples | Function in Lipid Production Monitoring |
|---|---|---|
| RNAprotect Reagent | Qiagen | Rapid stabilization of RNA at the bioreactor for accurate transcriptomics of lipid genes. |
| ZymoBIOMICS RNA Miniprep Kit | Zymo Research | High-yield, inhibitor-free RNA extraction from oleaginous yeast/bacteria for qPCR. |
| Precellys Homogenizer & Lysing Kits | Bertin Technologies | Efficient mechanical lysis of robust lipid-accumulating microbes for metabolomics/proteomics. |
| BIOLOG MT2 MicroPlates | Biolog | Phenotypic microarray profiling to assess carbon source utilization effects on lipid yield. |
| CIL Cambridge Isotope 13C-Glucose | Cambridge Isotope Labs | Tracer for fluxomics to map carbon routing into fatty acid versus biomass pathways. |
| Lipid Extraction Kit (MTBE method) | Avanti Polar Lipids | Standardized total lipid extraction for quantitative lipidomic analysis via GC-MS/LC-MS. |
| Pierce Quantitative Colorimetric Peptide Assay | Thermo Fisher | Rapid protein quantification prior to proteomic analysis of key lipid enzymes. |
| Seahorse XFp Analyzer Kits | Agilent | Real-time ex vivo metabolic profiling (glycolysis, mitochondrial respiration) of sampled cells. |
Integrating -omics data into real-time bioprocess control represents a paradigm shift for optimizing microbial lipid factories. By implementing rapid sampling, targeted analytical pipelines, and multivariate models that translate molecular data into actionable control parameters, researchers can dynamically steer metabolism toward maximal lipid yield and productivity. This approach moves the field from passive observation to active, biology-driven control, which is essential for achieving the economic thresholds required for sustainable lipid-based bioproducts.
The development of microbial cell factories for sustainable lipid production (e.g., for biofuels, nutraceuticals, and pharmaceutical precursors) is constrained by two primary economic hurdles: the high cost of feedstocks and the significant energy inputs required for bioreactor operation and downstream processing. This whitepaper provides an in-depth technical guide to strategies and experimental methodologies aimed at mitigating these costs, thereby enhancing the commercial viability of microbial lipid biosynthesis within the broader research thesis.
Feedstock Cost Reduction Strategies
The selection and engineering of low-cost, non-competitive carbon sources is paramount.
Alternative Feedstock Evaluation
A systematic comparison of lipid titers, yields, and productivities from various low-cost feedstocks is essential for economic modeling.
Table 1: Lipid Production Performance of Yarrowia lipolytica on Alternative Feedstocks
| Feedstock Type | Specific Strain / Engineering | Lipid Titer (g/L) | Yield (g/g Substrate) | Volumetric Productivity (g/L/h) | Key Advantage |
|---|---|---|---|---|---|
| Crude Glycerol (80% purity) | Y. lipolytica Po1g | 45.2 | 0.22 | 0.31 | Low-cost by-product of biodiesel industry |
| Lignocellulosic Hydrolysate (C5/C6 mix) | Y. lipolytica A101 + XR/XDH | 38.7 | 0.18 | 0.27 | Non-food, abundant biomass |
| Acetic Acid (from syngas) | Engineered Y. lipolytica HL-AA | 32.5 | 0.20 | 0.29 | C2 substrate, gas fermentation compatible |
| Food Waste Hydrolysate | Y. lipolytica W29 (adapted) | 41.8 | 0.19 | 0.29 | Waste valorization, high organic load |
Experimental Protocol: Adaptive Laboratory Evolution (ALE) for Feedstock Utilization
Objective: To improve lipid yield and growth rate of an oleaginous yeast on a defined, complex feedstock (e.g., lignocellulosic hydrolysate).
Methodology:
- Inoculum Preparation: Grow the base strain (e.g., Y. lipolytica Po1g) in YPD to mid-exponential phase.
- Evolution Setup: Inoculate 5 mL of minimal medium containing 20% (v/v) of the target hydrolysate (filter-sterilized) to an initial OD600 of 0.1. Use baffled flasks for improved aeration.
- Serial Transfer: Incubate at 28°C, 250 rpm. Monitor growth via OD600. Once the culture reaches late-exponential phase (or after a fixed period, e.g., 48h), transfer 0.5 mL into 5 mL of fresh identical medium. Repeat for >50 generations.
- Selection Pressure: Periodically (every 10 transfers) increase the proportion of hydrolysate in the medium to 40%, 60%, and finally 80%.
- Clone Isolation: Plate evolved culture from the final transfer onto YPD agar. Pick 20-50 individual colonies.
- Screening: Inoculate each clone in 96-well deep plates with the target hydrolysate medium. Assess lipid content using high-throughput Nile Red fluorescence (Ex/Em: 530/575 nm) and growth kinetics. Select top 3-5 performers.
- Validation & Sequencing: Validate lipid titer and yield of selected evolved clones in 50 mL bioreactor tubes. Perform whole-genome sequencing to identify causal mutations.
Energy Consumption Reduction Strategies
Energy demands are highest for aeration/agitation (overcoming oxygen mass transfer) and downstream lipid extraction.
Process Intensification and Engineering
Optimizing bioreactor conditions and employing energy-efficient downstream methods can drastically cut operational expenses (OPEX).
Table 2: Energy Consumption Comparison for Lipid Extraction Methods
| Extraction Method | Conditions | Recovery Efficiency (%) | Estimated Energy Demand (MJ/kg lipid) | Key Trade-offs |
|---|---|---|---|---|
| Bligh & Dyer (Chloroform/Methanol) | 1:2:0.8 CHCl3:MeOH:H2O, room temp, 1h | 95-99 | 15-25 (solvent recovery) | High toxicity, costly solvent recovery |
| Hexane Soxhlet Extraction | 65°C, 6-8h reflux | 85-92 | 10-18 (heating & condensation) | Fire hazard, poor for wet biomass |
| Supercritical CO2 (ScCO2) | 300 bar, 40°C, 2h | 80-90 | 8-12 (compression) | High CAPEX, co-solvent may be needed |
| In Situ Transesterification | 10% H2SO4 in MeOH, 70°C, 2h | 88-95 | 4-7 (heating only) | Direct to FAMEs, simplifies process |
| Electroporation + Aqueous Separation | Pulsed electric field (5-10 kV/cm), 50°C | 75-85 | 2-5 (electricity) | Mild, no solvents; efficiency needs work |
Experimental Protocol: Two-Stage Oxygen-Limited Fermentation for Energy Savings
Objective: To reduce energy cost from aggressive aeration by employing a growth phase followed by an oxygen-limited lipid accumulation phase.
Methodology:
- Bioreactor Setup: Use a 5 L bioreactor with a working volume of 3 L. Equip with controls for dissolved oxygen (DO), pH, temperature, and agitator speed.
- Medium: Use defined mineral medium with the primary carbon source (e.g., glucose or glycerol) at a high initial concentration (e.g., 80 g/L). Maintain a high C:N ratio (>60:1) to trigger oleaginicity.
- Stage 1 - Growth Phase (0-24h): Inoculate at 10% (v/v). Maintain DO at >30% saturation via cascaded control (agitation 400-800 rpm, air flow 1-2 vvm). Maintain pH at 5.5 using 2M NaOH/HCl. Temperature at 28°C. Goal: Achieve high cell density while exhausting nitrogen.
- Stage 2 - Oxygen-Limited Accumulation Phase (24-120h): Once ammonium is depleted (confirmed by assay), shift to energy-saving mode. Reduce agitation to 150-200 rpm and set air flow to a constant 0.2 vvm. Allow DO to drop to <5%. This micro-aerobic condition redirects carbon flux from growth to lipid biosynthesis (TCA cycle slowdown, ATP citrate lyase activation). Continue feeding carbon source to maintain ~20 g/L.
- Monitoring: Take samples every 12h for dry cell weight, residual carbon/nitrogen, and lipid analysis (gravimetric or GC-FAME).
- Calculations: Compare total energy input (agitator + air compressor) per kg of lipid produced against a control high-aeration process.
Diagram 1: Two-Stage Fermentation Logic for Energy Savings
Diagram 2: ALE Protocol for Feedstock Adaptation
The Scientist's Toolkit: Key Research Reagent Solutions
Table 3: Essential Materials for Cost-Reduction Research in Microbial Lipids
| Reagent / Material | Supplier Examples | Primary Function in Research |
|---|---|---|
| Yarrowia lipolytica Po1g Strain | ATCC, Yeast Genetic Stock Center | Model oleaginous yeast with auxotrophies for genetic engineering. |
| Lignocellulosic Hydrolysate (e.g., AFEX-treated corn stover) | NREL, Cellulac | Standardized, complex feedstock for evaluating pentose/hexose co-utilization. |
| Nile Red dye | Sigma-Aldrich, Thermo Fisher | Lipid-soluble fluorescent dye for rapid, high-throughput quantification of intracellular neutral lipid content. |
| GC-FAME Standard Mix (C8-C24) | Supelco, Restek | Quantitative standard for gas chromatography analysis of Fatty Acid Methyl Esters (FAMEs) to determine lipid profile. |
| Miniature Bioreactor System (e.g., DASGIP, BioFlo) | Eppendorf, Sartorius | Enables parallel, controlled studies of aeration/feeding strategies with real-time monitoring. |
| Supercritical CO2 Extraction System (Lab-scale) | Waters, Applied Separations | For evaluating energy-efficient, solvent-free lipid recovery methods. |
| CRISPR/Cas9 Kit for Y. lipolytica | Custom, Bio Basic | Enables precise metabolic engineering to enhance feedstock utilization or lipid yield. |
| ATP Citrate Lyase (ACL) Activity Assay Kit | Sigma-Aldrich, Abcam | Quantifies activity of a key enzyme linking metabolism to lipid biosynthesis under varying O2 conditions. |
Benchmarking Success: Analytical Methods and Competitive Analysis of Microbial Lipids
Within the critical research on Microbial cell factories for sustainable lipid production, precise analytical characterization is paramount. The complex lipid profiles produced by engineered yeast, bacteria, or algae require gold-standard analytical techniques to quantify yields, elucidate structures, and verify functionality. This guide details the application of Gas Chromatography-Mass Spectrometry (GC-MS), High-Performance Liquid Chromatography (HPLC), and Nuclear Magnetic Resonance (NMR) spectroscopy as the cornerstone methods for comprehensive lipid analysis, providing researchers with the technical protocols and data interpretation frameworks necessary to advance the field.
Core Analytical Techniques: Principles and Applications
Gas Chromatography-Mass Spectrometry (GC-MS)
GC-MS is the principal method for the qualitative and quantitative analysis of fatty acid methyl esters (FAMEs), derived from saponifiable lipids (e.g., triglycerides, phospholipids). It offers high sensitivity and robust compound identification via mass spectral libraries.
Key Application: Profiling fatty acid composition from microbial oils.
Experimental Protocol: FAME Preparation and GC-MS Analysis
- Sample Preparation (Transesterification):
- Lyophilize ~50 mg of microbial biomass.
- Add 2 mL of 2% (v/v) H₂SO₄ in anhydrous methanol and 1 mL of toluene.
- Heat at 80°C for 2 hours with vortexing every 30 min.
- Cool to room temperature. Add 1 mL of saturated NaCl solution and 2 mL of hexane.
- Vortex for 1 min and centrifuge at 2,000 x g for 5 min.
- Collect the upper (hexane) layer containing FAMEs. Dry under nitrogen and reconstitute in 100 µL of hexane for GC-MS injection.
- GC-MS Parameters (Example):
- Column: Polar capillary column (e.g., DB-WAX, 30 m x 0.25 mm i.d., 0.25 µm film).
- Injector: 250°C, split mode (split ratio 10:1).
- Carrier Gas: Helium, constant flow 1.2 mL/min.
- Oven Program: 50°C (hold 2 min), ramp at 10°C/min to 240°C (hold 10 min).
- MS Interface: 250°C.
- Ion Source: 230°C.
- Mass Scan Range: 50-600 m/z.
High-Performance Liquid Chromatography (HPLC)
HPLC, particularly when coupled with evaporative light scattering (ELSD) or mass spectrometric (MS) detectors, is ideal for separating and quantifying intact lipid classes (e.g., triacylglycerols, glycolipids, phospholipids) based on polarity.
Key Application: Separation and quantification of complex lipid classes from microbial extracts.
Experimental Protocol: Normal-Phase HPLC-ELSD for Lipid Class Separation
- Sample Preparation (Total Lipid Extraction - Modified Folch):
- Homogenize 100 mg wet cell pellet with 2 mL of 2:1 (v/v) chloroform:methanol.
- Sonicate on ice for 5 min (10 sec pulse, 20 sec rest).
- Add 0.4 mL of 0.9% (w/v) KCl solution, vortex, and centrifuge at 2,000 x g for 10 min.
- Collect the lower organic layer. Dry under nitrogen and reconstitute in 1 mL of chloroform.
- HPLC-ELSD Parameters (Example):
- Column: Diol-phase silica column (e.g., 250 mm x 4.6 mm i.d., 5 µm).
- Mobile Phase A: Hexane:Isopropanol:Acetic Acid (85:15:0.1, v/v/v) + 0.08% Triethylamine.
- Mobile Phase B: Isopropanol:Water:Acetic Acid (85:14:1, v/v/v) + 0.08% Triethylamine.
- Gradient: 0% B to 100% B over 40 min, hold 10 min.
- Flow Rate: 1 mL/min.
- Column Temp: 30°C.
- ELSD Conditions: Drift tube temp 80°C, nebulizer gas (N₂) flow 1.6 SLM.
Nuclear Magnetic Resonance (NMR) Spectroscopy
NMR provides non-destructive, quantitative structural elucidation. ¹H and ³¹P NMR identify functional groups, degree of unsaturation, regio-specificity, and phospholipid headgroups. It is essential for confirming novel or unusual lipid structures.
Key Application: Structural elucidation and quantification of lipid unsaturation and functional groups.
Experimental Protocol: ¹H NMR for Lipid Structure and Composition
- Sample Preparation for NMR:
- Dissolve ~20 mg of purified lipid extract in 0.7 mL of deuterated chloroform (CDCl₃) containing 0.03% (v/v) tetramethylsilane (TMS) as an internal standard.
- Transfer to a 5 mm NMR tube.
- ¹H NMR Acquisition Parameters (Example):
- Spectrometer Frequency: 400 MHz or higher.
- Pulse Sequence: Standard single-pulse experiment with presaturation for solvent suppression.
- Spectral Width: 12 ppm.
- Relaxation Delay (D1): 5 sec.
- Number of Scans: 64-128.
- Temperature: 298 K.
Data Presentation: Quantitative Comparison of Techniques
Table 1: Comparative Analysis of Gold-Standard Lipid Characterization Techniques
| Parameter | GC-MS | HPLC (with ELSD/MS) | NMR (¹H & ³¹P) |
|---|---|---|---|
| Primary Use | Fatty acid profiling (as FAMEs) | Lipid class separation & quantification | Structural elucidation & functional groups |
| Sample Throughput | High | Medium | Low |
| Sensitivity | High (pg level) | Medium-High (ng level with MS) | Low (mg level required) |
| Quantitation | Excellent (with internal standards) | Good (relative); Excellent with standards | Absolute, without destruction |
| Structural Information | Chain length, saturation from retention | Lipid class, sometimes molecular species | Double bond position, regiochemistry, headgroups |
| Key Metric Output | % Composition of individual fatty acids | µg/mg of each lipid class | mol%, degree of unsaturation, identity |
| Sample Preparation | Derivatization required (transesterification) | Minimal for class separation; complex for MS/MS | Minimal; often direct analysis of extract |
Visualizing the Integrated Workflow
Diagram 1: Integrated Workflow for Lipid Characterization from Microbial Cell Factories
The Scientist's Toolkit: Essential Research Reagent Solutions
Table 2: Key Reagents and Materials for Lipid Characterization Experiments
| Reagent/Material | Function/Application | Example Vendor/Product |
|---|---|---|
| Chloroform & Methanol (HPLC Grade) | Solvents for total lipid extraction via Folch or Bligh & Dyer methods. | MilliporeSigma, Thermo Fisher |
| Deuterated Chloroform (CDCl₃) | NMR solvent for lipid samples; provides deuterium lock signal for instrument stability. | Cambridge Isotope Laboratories |
| N-Acetylphosphatidylethanolamine | Internal standard for quantitative ³¹P NMR analysis of phospholipid classes. | Avanti Polar Lipids |
| Fatty Acid Methyl Ester (FAME) Mix | Certified reference standard for calibration and identification of fatty acids in GC-MS. | Supelco (37 Component FAME Mix) |
| Triheptadecanoin (C17:0 TAG) | Internal standard for quantitative GC-MS of triglycerides (added prior to transesterification). | Larodan |
| Silica Gel & Diol-phase HPLC Columns | Stationary phases for normal-phase separation of lipid classes by polarity. | Waters, Phenomenex, Supelco |
| Boron Trifluoride in Methanol (BF₃-MeOH, 10-14%) | Common derivatization reagent for transesterification of lipids to FAMEs for GC-MS. | MilliporeSigma |
| Sylon BFT | Derivatization grade reagent (bis(trimethylsilyl)trifluoroacetamide) for protecting hydroxyl groups in GC-MS. | Supelco |
| Ammonium Formate/Acetate | Mobile phase additives for LC-MS lipidomics to enhance ionization in positive/negative modes. | Fisher Chemical |
Within the strategic pursuit of microbial cell factories for sustainable lipid production, the rigorous evaluation of engineered strains is paramount. This whitepaper provides an in-depth technical guide to the three core metrics—Titer, Rate, and Yield (TRY)—that form the cornerstone of performance benchmarking. These metrics collectively define the economic viability and industrial potential of oleaginous microbes such as Yarrowia lipolytica, Rhodotorula toruloides, and engineered Saccharomyces cerevisiae.
Defining the Core Metrics: The TRY Framework
The TRY framework quantifies the efficiency of a bioprocess from distinct but interconnected perspectives.
- Titer: The concentration of the target product (lipid, e.g., triacylglycerol/TAG) in the fermentation broth at the end of a batch, typically reported in grams per liter (g/L). It reflects the final process output.
- Rate: The speed of product formation, most critically the productivity (g/L/h), calculated as titer divided by total process time. It determines bioreactor throughput.
- Yield: The conversion efficiency of the primary carbon substrate (e.g., glucose, glycerol) into the target product. Expressed as grams of product per gram of substrate (g/g), it directly impacts raw material costs and process sustainability.
Quantitative Benchmark Data for Lipid-Producing Strains
The table below summarizes recent performance data for various microbial platforms, highlighting the TRY trade-offs and current state of the art.
Table 1: Benchmark Performance of Selected Microbial Lipid Factories
| Microbial Host | Substrate | Key Genetic/Process Modification | Titer (g/L) | Rate (g/L/h) | Yield (g/g) | Ref. Year |
|---|---|---|---|---|---|---|
| Yarrowia lipolytica | Glucose | Overexpression of DGA1, DGA2; Nitrogen limitation | 101.5 | 0.85 | 0.22 | 2023 |
| Rhodotorula toruloides | Lignocellulosic hydrolysate | Adaptive laboratory evolution | 82.4 | 0.49 | 0.26 | 2024 |
| Saccharomyces cerevisiae | Glucose | Engineered cytosolic acetyl-CoA pathway; ΔERG1 | 36.2 | 0.21 | 0.167 | 2023 |
| Cutaneotrichosporon oleaginosus | Glycerol | Fed-batch optimization | 65.0 | 0.54 | 0.28 | 2022 |
Experimental Protocols for Metric Determination
Protocol 1: Fermentation for Titer and Rate Determination
- Inoculum Preparation: Grow seed culture of the oleaginous strain in a rich medium (e.g., YPD) to mid-exponential phase.
- Fermentation Setup: Inoculate a defined nitrogen-limited production medium (e.g., Yeast Nitrogen Base with high C:N ratio) in a bioreactor. Standard conditions: 30°C, pH 5.5-6.0, dissolved oxygen >30%.
- Fed-Batch Operation: Maintain a limiting feed of carbon source (e.g., glucose at 20 g/L/hr) to promote lipid accumulation while minimizing overflow metabolism.
- Sampling: Aseptically remove samples at regular intervals (e.g., every 12 h) for analysis.
- Titer Measurement: Harvest cells, lyse, and extract total lipids via Folch or Bligh & Dyer method. Quantify via gravimetric analysis or gas chromatography (GC-FID) for fatty acid methyl esters (FAMEs).
- Rate Calculation: Plot lipid titer vs. time. Volumetric productivity (Rate) = (Final Titer) / (Total fermentation time, including feed phase).
Protocol 2: Yield Determination via Stoichiometric Analysis
- Substrate & Biomass Quantification: Precisely measure initial and residual carbon substrate concentration (e.g., via HPLC). Measure dry cell weight (DCW) at harvest.
- Lipid Quantification: Determine total lipid titer as in Protocol 1.
- Calculation:
- Substrate Consumed (Scons, g) = (Initial [S] - Final [S]) * Culture Volume.
- Product Yield (Yp/s) = (Lipid Titer * Culture Volume) / Scons.
- Biomass Yield (Yx/s) = (DCW * Culture Volume) / S_cons.
- Validation: Compare theoretical maximum yield (from genome-scale metabolic models) with experimental Yp/s to assess pathway efficiency.
Visualizing Metabolic Pathways and Workflows
Diagram 1: Core Lipid Biosynthesis Pathway in Yeast
Diagram 2: Strain Evaluation Experimental Workflow
The Scientist's Toolkit: Research Reagent Solutions
Table 2: Essential Reagents for Lipid Strain Evaluation
| Item | Function/Application | Example Product/Specification |
|---|---|---|
| Nitrogen-Limited Medium | Creates high C:N ratio to trigger lipid accumulation in oleaginous microbes. | Yeast Nitrogen Base w/o amino acids, with defined carbon (e.g., 80 g/L glucose). |
| Chloroform-Methanol Mix | Solvent system for total lipid extraction from cell biomass. | 2:1 (v/v) CHCl₃:MeOH for Folch method. |
| Fatty Acid Methylation Kit | Derivatizes lipids to volatile FAMEs for GC analysis. | Supelco FAME Kit (Methanolic HCl + Toluene). |
| C13-Glucose | Tracer for metabolic flux analysis (MFA) to determine pathway yield and activity. | U-¹³C Glucose, 99% isotopic purity. |
| Lipid Quantification Dye | Rapid, high-throughput screening of intracellular lipid droplets. | Nile Red or BODIPY 493/503 stain for flow cytometry/microscopy. |
| Cerulenin | Inhibitor of fatty acid synthase (FAS); used in metabolic studies to probe flux. | ≥98% (HPLC), dissolved in ethanol. |
Within the pursuit of sustainable lipid production via microbial cell factories, a comparative lipidomics framework is essential. This analytical discipline maps and quantifies complete lipid profiles, enabling a direct, data-driven comparison between traditional sources (plants, marine organisms) and engineered microbial systems. Such comparison informs metabolic engineering strategies to produce high-value or specialized lipids microbially, reducing ecological pressure on conventional sources.
Lipidomic profiles are defined by the headgroup (defining the class) and the acyl chain composition (defining molecular species). The following tables summarize key quantitative differences.
Table 1: Comparative Abundance of Major Lipid Classes (%)
| Lipid Class | Microbial (e.g., Yarrowia lipolytica) | Plant (e.g., Soybean) | Marine (e.g., Fish Oil) |
|---|---|---|---|
| Triacylglycerols (TAG) | 40-80% (storage) | 95-99% (seed oil) | 10-30% |
| Phospholipids (PL) | 15-50% (membrane) | 1-5% | 50-70% (membrane) |
| Sphingolipids | 1-5% | Trace | Trace |
| Glycolipids | 1-10% (e.g., in algae) | Trace (in oils) | 1-5% (in algae) |
| Polyunsaturated Fatty Acids (PUFAs) | Varies by engineering (e.g., EPA up to 30% TFA*) | C18:2, C18:3 (15-60%) | EPA/DHA (10-30% total lipids) |
| Odd-Chain/Branched-Chain FA | Present (e.g., from propionate) | Rare | Rare |
| Sterols/Stanols | Ergosterol (fungi) | β-Sitosterol, Stigmasterol | Cholesterol |
*TFA: Total Fatty Acids
Table 2: Signature Fatty Acid Profile (Relative % of Total Fatty Acids)
| Fatty Acid | Microbial (Oleaginous Yeast) | Plant (Soybean Oil) | Marine (Salmon Oil) |
|---|---|---|---|
| C14:0 (Myristic) | 1-2% | <0.1% | 3-5% |
| C16:0 (Palmitic) | 10-25% | 10-12% | 10-15% |
| C18:0 (Stearic) | 1-5% | 4-5% | 2-4% |
| C18:1 (Oleic) | 20-40% | 20-25% | 10-15% |
| C18:2 (Linoleic) | 10-20% | 50-55% | 1-3% |
| C18:3 (α-Linolenic) | <1% | 7-10% | <1% |
| C20:5 (EPA) | Engineered Strains (up to 30%) | 0% | 5-10% |
| C22:6 (DHA) | Engineered Strains (up to 15%) | 0% | 10-15% |
Experimental Protocols for Comparative Lipidomics
3.1. Sample Preparation for Comprehensive Lipid Extraction Protocol: Modified Bligh & Dyer or Methyl-tert-butyl ether (MTBE) Method
- Homogenization: Lyse microbial cells (bead beating), plant tissue (liquid N₂ grinding), or marine tissue (Polytron homogenizer) in PBS.
- Lipid Extraction: To 1 volume of sample, add 3.75 volumes of MeOH:MTBE (1:2.5, v/v) mixture. Vortex vigorously for 1 hr at 4°C.
- Phase Separation: Add 1.25 volumes of LC-MS grade water. Incubate 10 min at RT, then centrifuge at 1000 x g for 10 min.
- Collection: Collect the upper organic (MTBE) layer. Dry under a gentle nitrogen stream.
- Reconstitution: Redissolve dried lipids in 1:1 (v/v) dichloromethane:methanol for MS analysis or in appropriate solvent for GC.
3.2. Lipidomic Analysis via LC-MS/MS Protocol: Reversed-Phase Liquid Chromatography Coupled to Tandem Mass Spectrometry
- Chromatography:
- Column: C8 or C18 column (e.g., 2.1 x 150 mm, 1.7 μm).
- Mobile Phase A: 60:40 (v/v) Acetonitrile:Water with 10 mM ammonium formate and 0.1% formic acid.
- Mobile Phase B: 90:10 (v/v) Isopropanol:Acetonitrile with 10 mM ammonium formate and 0.1% formic acid.
- Gradient: 32% B to 97% B over 20 min, hold 5 min, re-equilibrate.
- Flow Rate: 0.26 mL/min, 55°C.
- Mass Spectrometry:
- Instrument: Q-Exactive HF or similar high-resolution mass spectrometer.
- Ionization: Heated Electrospray Ionization (HESI), positive and negative polarity switching.
- Full Scan: m/z 200-2000, resolution 120,000.
- Data-Dependent MS/MS (dd-MS²): Top 10 precursors, resolution 15,000, stepped NCE 20, 30, 40.
- Data Processing: Use software (e.g., LipidSearch, MS-DIAL) for peak alignment, identification (against LIPID MAPS database), and quantification using internal standards (e.g., SPLASH LIPIDOMIX).
3.3. Fatty Acid Methyl Ester (FAME) Analysis via GC-FID Protocol: Transesterification and Gas Chromatography
- Transesterification: To dried lipids, add 2 mL of 1% H₂SO₄ in MeOH. Incubate at 80°C for 1 hr.
- Extraction: Cool, add 1 mL of hexane and 1 mL of saturated NaCl solution. Vortex, centrifuge.
- GC Analysis:
- Column: Highly polar bis-cyanopropyl polysiloxane column (e.g., SP-2560, 100 m x 0.25 mm).
- Oven Program: 140°C hold 5 min, increase to 240°C at 4°C/min, hold 20 min.
- Detection: Flame Ionization Detector (FID). Identify/quantify using FAME mix standards (e.g., Supelco 37 Component FAME Mix).
Metabolic Pathway Diagrams
Title: Core Triacylglycerol (TAG) Biosynthesis Pathway
Title: Comparative Lipidomics Experimental Workflow
The Scientist's Toolkit: Key Research Reagent Solutions
| Reagent/Material | Function in Comparative Lipidomics |
|---|---|
| SPLASH LIPIDOMIX Mass Spec Standard | A quantitative cocktail of stable isotope-labeled lipid standards across classes. Enables absolute quantification and correction for ionization efficiency in LC-MS. |
| MTBE (Methyl-tert-butyl ether) | Primary solvent for lipid extraction in the high-recovery MTBE method. Provides cleaner separation with less protein/phospholipid interference. |
| Bis(trimethylsilyl)trifluoroacetamide (BSTFA) | Derivatization agent for GC-MS analysis of sterols and other non-FAME lipids, adding trimethylsilyl groups to enhance volatility and detection. |
| Supelco 37 Component FAME Mix | Gold-standard reference for GC-FID analysis. Used for peak identification and response factor calculation for fatty acid profiling. |
| Silica Gel Solid-Phase Extraction (SPE) Cartridges | Used for fractionation of complex lipid extracts into neutral lipids, glycolipids, and phospholipids prior to in-depth analysis. |
| Ammonium Formate (LC-MS Grade) | Critical mobile phase additive for LC-MS lipidomics. Promotes efficient and stable ionization, especially in negative mode for phospholipids and FFA. |
| Internal Standards (e.g., C17:0 TAG, C17:0 PC) | Individual odd-chain lipid standards added at the beginning of extraction to monitor and correct for losses during sample preparation. |
| Porous Graphitic Carbon (PGC) LC Column | Used for separating lipid isomers (e.g., sn-position, double bond location) not resolved by standard reversed-phase columns. |
The pursuit of microbial cell factories (MCFs) for sustainable lipid production represents a paradigm shift in sourcing oils for biofuels, nutraceuticals, and pharmaceuticals. While laboratory successes in strain engineering and yield optimization are critical, their true environmental merit must be validated through a systematic Life Cycle Assessment (LCA). This technical guide details the application of LCA to quantify the potential environmental sustainability gains of lipid-producing MCFs compared to conventional agricultural (e.g., palm, soybean) or chemical production routes.
LCA Methodology: A Four-Phase Protocol
LCA is standardized by ISO 14040/14044 and comprises four iterative phases.
Experimental Protocol 2.1: Goal and Scope Definition
- Objective: Define the purpose, system boundaries, and functional unit (FU).
- Procedure:
- Goal: State the study's aim (e.g., "Compare the global warming potential of lipid from Yarrowia lipolytica vs. palm oil").
- Functional Unit (FU): Define the quantitative reference for all inputs/outputs (e.g., "1 kg of purified triacylglycerol (TAG) at 99% purity").
- System Boundaries: Define the "cradle-to-gate" or "cradle-to-grave" processes. For MCFs, a typical cradle-to-gate boundary includes:
- Upstream: Production of carbon source (e.g., glucose, glycerol), nutrients, and utilities.
- Core Process: Bioreactor fermentation (inoculation, fermentation, monitoring).
- Downstream: Cell harvesting, lipid extraction, and purification.
- Cut-off Criteria: Specify excluded processes (e.g., capital equipment manufacturing, R&D activities).
Experimental Protocol 2.2: Life Cycle Inventory (LCI) Data Collection
- Objective: Compile quantitative input/output data for all processes within the system boundary.
- Procedure:
- Primary Data Collection: For the MCF process, gather measured lab/pilot-scale data:
- Mass/energy inputs per FU: Amount of carbon source, salts, water, electricity (kWh), heat (MJ).
- Outputs per FU: Mass of product, by-products (e.g., cell biomass), waste streams, emissions.
- Protocol Example: Fermentation of Y. lipolytica on glycerol.
- Cultivate in a 10L bioreactor with defined media (glycerol as C-source).
- Monitor and log consumption of glycerol, NH₄Cl, MgSO₄, electricity (for agitation, sterilization), and cooling water.
- Harvest cells, measure dry cell weight and extracted lipid yield via Bligh & Dyer method.
- Scale data to the defined FU (1 kg TAG).
- Secondary Data: Use commercial LCA databases (e.g., Ecoinvent, GaBi) for background processes (e.g., electricity grid mix, nutrient production, waste treatment).
- Primary Data Collection: For the MCF process, gather measured lab/pilot-scale data:
Experimental Protocol 2.3: Life Cycle Impact Assessment (LCIA)
- Objective: Convert LCI data into potential environmental impacts.
- Procedure:
- Selection of Impact Categories: Choose categories relevant to bioprocessing (e.g., Global Warming Potential (GWP), Freshwater Eutrophication, Land Use, Water Consumption, Fossil Resource Scarcity).
- Characterization: Multiply inventory flows by characterization factors (e.g., kg CO₂-equivalent for GWP) using LCIA methods like ReCiPe 2016 or EF 3.0, implemented in LCA software (OpenLCA, SimaPro).
Experimental Protocol 2.4: Interpretation
- Objective: Analyze results, check consistency, and draw conclusions.
- Procedure:
- Contribution Analysis: Identify which process stages (e.g., carbon source production, fermentation energy) dominate each impact category.
- Scenario & Sensitivity Analysis: Test the effect of key parameters (e.g., renewable vs. grid electricity, different carbon sources, improved lipid yield).
- Comparative Assertion: Statistically compare impact profiles of the MCF system and its conventional counterpart.
The following table summarizes potential impacts based on recent literature and model-based LCA studies for microbial lipids. Data is illustrative and normalized to a functional unit of 1 kg of lipid.
Table 1: Comparative LCA Results for Lipid Production Pathways
| Impact Category | Unit | Microbial Lipids (Model: Y. lipolytica on Glucose) | Palm Oil (Milled, Cradle-to-Gate) | Soybean Oil (Cradle-to-Gate) | Key Drivers for MCF |
|---|---|---|---|---|---|
| Global Warming Potential (GWP) | kg CO₂-eq | 2.5 - 5.0 | 3.0 - 4.5 | 1.8 - 3.2 | Electricity source for fermentation & sterilization. |
| Fossil Resource Scarcity | kg oil-eq | 1.2 - 2.5 | 0.3 - 0.6 | 0.4 - 0.8 | Production of glucose and process energy. |
| Land Use | m²a crop-eq | < 0.5 | 7.0 - 12.0 | 10.0 - 15.0 | Minimal direct land use is the major advantage. |
| Freshwater Eutrophication | kg P-eq | 0.001 - 0.004 | 0.010 - 0.020 | 0.012 - 0.025 | Nutrient (N, P) runoff in agriculture. |
| Water Consumption | m³ | 10 - 25 | 2.5 - 5.0 | 2.0 - 4.5 | High process water demand in bioreactors & cooling. |
Critical Signaling & Metabolic Pathways in LCA Context
The environmental footprint of an MCF is directly linked to its metabolic efficiency. Key pathways determine the yield and titer, which are primary levers for improving LCA outcomes.
The Scientist's Toolkit: Research Reagent & Material Solutions for LCA-Informed Strain Development
Table 2: Essential Reagents for Metabolic Engineering and Analysis
| Item / Reagent | Function in Research | Relevance to LCA Outcomes |
|---|---|---|
| CRISPR-Cas9 Systems | Precise genome editing to knock out competing pathways or insert lipid biosynthesis genes. | Directly impacts lipid yield, a primary factor reducing resource inputs per FU. |
| Fluorescent Probes (e.g., BODIPY 493/503) | Live-cell staining and visualization of intracellular lipid droplets via fluorescence microscopy or flow cytometry. | Enables rapid screening of high-yield strains, accelerating development and reducing overall R&D resource footprint. |
| GC-MS with FAME Kit | Quantitative analysis of Fatty Acid Methyl Esters (FAME) for lipid composition and titer. | Provides critical LCI output data (product quantity/quality) and informs downstream processing energy needs. |
| Defined Minimal Media Components | Precise salts, vitamins, and carbon sources (e.g., glucose, glycerol, agro-waste hydrolysates). | Allows for accurate tracking of nutrient inputs for LCI. Using waste carbon streams dramatically improves GWP. |
| High-cell Density Fermentation Bioreactors | Scalable systems for optimizing process parameters (pH, DO, feeding strategy). | Generates scale-up data for realistic LCA modeling of energy and material flows at industrial scale. |
| LCA Software (e.g., OpenLCA) | Modeling tool to compile inventory data and calculate environmental impacts. | The primary tool for quantifying and comparing the sustainability gains of engineered strains. |
Regulatory Pathways and Safety Assessment for Clinical-Grade Microbial Lipids
Within the broader thesis of Microbial Cell Factories for Sustainable Lipid Production, the translation of laboratory-scale discoveries to clinical-grade therapeutics necessitates rigorous regulatory and safety evaluation. Microbial lipids, produced in engineered yeast, algae, or bacteria, are promising for applications ranging from lipid nanoparticle (LNP) delivery systems to novel adjuvants and active pharmaceutical ingredients (APIs). This guide details the regulatory pathways and experimental frameworks required to ensure their safety and efficacy for human use.
Clinical-grade microbial lipids are regulated primarily as Biologics, New Drugs, or as components of Combination Products, depending on their final application. The primary regulatory pathways involve:
- Investigational New Drug (IND) Application: Required to initiate clinical trials in the US (FDA).
- Biologics License Application (BLA) / New Drug Application (NDA): For market approval.
- Chemistry, Manufacturing, and Controls (CMC) Section: A critical component of regulatory submissions, detailing the characterization, manufacture, and control of the lipid product.
Key regulatory considerations include Product Characterization, Manufacturing Consistency, Preclinical Safety/Toxicology, and Clinical Trial Design. The specific pathway is determined by the lipid's function (e.g., structural component vs. active immunomodulator).
Safety Assessment Framework: Core Components
A comprehensive safety assessment is built on a multi-tiered experimental approach.
3.1. Lipid Characterization and Quality Control Thorough physicochemical characterization is the foundation of safety.
Table 1: Key Analytical Methods for Microbial Lipid Characterization
| Parameter | Analytical Method | Purpose & Relevance to Safety |
|---|---|---|
| Fatty Acid Profile | GC-MS / FAME Analysis | Identifies and quantifies lipid species; ensures batch consistency and absence of undesirable fatty acids. |
| Lipid Class Composition | HPLC-ELSD / LC-MS | Determines percentages of phospholipids, triglycerides, etc.; critical for functionality and reproducibility. |
| Chain Length & Saturation | NMR Spectroscopy | Confirms molecular structure; impacts biophysical properties and metabolic fate. |
| Purity & Impurities | HPLC-CAD, GC-MS | Detects residual process solvents, host cell lipids, and other contaminants (e.g., endotoxins). |
| Physical Properties | Dynamic Light Scattering (DLS), DSC | Measures particle size (for LNPs), phase transition temperature; influences stability and in vivo behavior. |
3.2. Preclinical Toxicology Studies Standardized in vitro and in vivo studies are required to identify potential hazards.
Table 2: Standard Preclinical Toxicology Assays
| Study Type | Standard Protocol (OECD/ICH Guideline) | Key Endpoints |
|---|---|---|
| Genotoxicity | Bacterial Reverse Mutation Assay (Ames Test) (OECD 471) | Gene mutations in S. typhimurium/E. coli. |
| In vitro Micronucleus Assay (OECD 487) | Chromosomal damage in mammalian cells. | |
| Systemic Toxicity | Repeat-Dose Toxicity Study (ICH S4, S6) | 28-day or 90-day study in two species (rodent + non-rodent); clinical pathology, histopathology. |
| Pyrogenicity | Limulus Amebocyte Lysate (LAL) Assay | Quantification of endotoxin levels (<5 EU/kg/hr for injectables). |
| Hemocompatibility | In vitro Hemolysis Assay (ASTM F756) | Red blood cell lysis and aggregation potential. |
| Immunotoxicity | Cytokine Release Assay (PBMC or whole blood) | Assessment of potential for adverse immunostimulation. |
3.3. Detailed Experimental Protocol: In Vivo Repeat-Dose Toxicity Study Objective: To evaluate the toxicological effects of the microbial lipid after repeated administration. Model: Sprague-Dawley rats (or another appropriate species). Groups: Control (vehicle), Low Dose, Mid Dose, High Dose (justification based on anticipated human dose). Administration: Daily intravenous/oral/intramuscular injection for 28 days. Endpoints:
- Clinical Observations: Mortality, morbidity, behavior, body weight, food consumption.
- Clinical Pathology: Hematology, clinical chemistry, coagulation markers.
- Gross Necropsy & Histopathology: Organ weights and microscopic examination of all major organs (liver, spleen, kidney, heart, lungs, injection site). Analysis: Statistical comparison to control group to identify no-observed-adverse-effect-level (NOAEL).
The Scientist's Toolkit: Research Reagent Solutions
Table 3: Essential Materials for Safety & Regulatory Experiments
| Item / Reagent | Function & Explanation |
|---|---|
| Certified Reference Standards | Accurately quantify lipid components and impurities via GC-MS/LC-MS; essential for method validation. |
| Pyrogen-Free Water/Labware | Prevents false-positive endotoxin results; critical for all steps in preparing injectable lipid formulations. |
| Limulus Amebocyte Lysate (LAL) Reagent | Gold-standard for detecting and quantifying bacterial endotoxins, a critical safety release test. |
| Good Laboratory Practice (GLP) Compliant Assay Kits | Validated kits for clinical pathology (enzymes, electrolytes) ensure reliable, auditable data for regulatory submission. |
| Standardized In Vitro Toxicity Assay Kits | Ready-to-use kits for Ames test, micronucleus, or cytotoxicity (e.g., MTT) improve reproducibility and throughput. |
| SPF-Rodent Models from Certified Breeders | Ensure consistent, defined animal models for in vivo toxicology, reducing confounding variables. |
| Stable Isotope-Labeled Substrates (e.g., ^13C-glucose) | Used in metabolic flux studies during fermentation to track lipid synthesis and ensure metabolic fidelity of the production organism. |
Visualizing Key Pathways and Workflows
Diagram 1: Microbial Lipid Clinical Development Pathway
Diagram 2: Core Preclinical Safety Assessment Workflow
Diagram 3: Key CMC & Regulatory Interrelationship
Conclusion
The engineering of microbial cell factories represents a paradigm shift towards sustainable and precise lipid manufacturing. By integrating foundational metabolic understanding with sophisticated genetic tools (Intent 1 & 2), and systematically addressing scale-up and economic challenges (Intent 3), this field is moving beyond proof-of-concept. Rigorous validation and comparative analysis (Intent 4) confirm that microbial platforms can match or surpass traditional sources in quality, while offering superior control, scalability, and environmental benefits. Future directions point toward the clinical translation of these lipids as drug delivery vehicles (e.g., lipid nanoparticles for mRNA vaccines), essential pharmaceutical excipients, and high-purity nutraceuticals. The convergence of synthetic biology, systems biology, and bioprocess engineering will further unlock the potential of microbes to produce a tailored lipidome, cementing their role as indispensable allies in sustainable biomedical innovation.