Beyond the Cell: A Comprehensive Guide to Cell-Free Biocatalysis for Sustainable Alka(e)ne Production from Fatty Acids
This article provides a detailed examination of the cell-free biocatalytic conversion of fatty acids to alka(e)nes, a promising route for sustainable biofuel and biochemical synthesis.
Beyond the Cell: A Comprehensive Guide to Cell-Free Biocatalysis for Sustainable Alka(e)ne Production from Fatty Acids
Abstract
This article provides a detailed examination of the cell-free biocatalytic conversion of fatty acids to alka(e)nes, a promising route for sustainable biofuel and biochemical synthesis. Tailored for researchers and industry professionals, it covers foundational enzymatic pathways (e.g., carboxylic acid reductase/aldehyde deformylating oxygenase and cytochrome P450s), current methodological approaches for constructing and applying cell-free systems, common troubleshooting and optimization strategies for yield and stability, and validation techniques with comparative analysis against whole-cell and chemical catalysis. The review synthesizes the state of the art, highlighting key challenges and future directions for translating this technology into scalable biomedical and industrial applications.
The Science and Promise of Decoupling Metabolism: Foundational Pathways for Cell-Free Alkane Synthesis
Within the context of research on the cell-free biocatalytic conversion of fatty acids to alka(e)nes, the choice of platform is critical. Cell-free systems (CFS) offer distinct strategic advantages over traditional microbial fermentation for specific metabolic engineering goals.
Core Advantages:
- Simplified Product Isolation: Eliminates the cell membrane/wall barrier, allowing direct access to products from the reaction mixture and drastically reducing downstream purification complexity.
- Enhanced Control & Flexibility: Reaction conditions (pH, temperature, redox potential) can be optimized independently of cellular viability. Toxic intermediates or products can be tolerated at higher concentrations.
- Rapid Prototyping: Bypasses the need for genetic engineering, transformation, and cell growth cycles. Enzyme pathways can be assembled and tested in hours to days.
- High Specific Productivity: Resources are devoted solely to the biocatalytic conversion of interest, not to biomass accumulation or cellular maintenance.
- Tolerance to Toxic Substrates/Products: Enables reactions involving compounds that would inhibit or kill whole cells (e.g., long-chain alka(e)nes themselves).
Comparative Data: The following table quantifies key performance metrics for alkane production via fermentation versus cell-free systems, based on recent literature.
Table 1: Quantitative Comparison: Microbial vs. Cell-Free Alkane Production
| Metric | Microbial Fermentation | Cell-Free System | Notes & References |
|---|---|---|---|
| Primary System | Engineered E. coli or cyanobacteria | Purified/POR/CAR/ADO enzymes + cofactors | |
| Typical Titer | 0.1 - 1.2 g/L | 10 - 50 mg/L (batch) | CFS titers rising with continuous systems. |
| Volumetric Productivity | 0.005 - 0.04 g/L/h | 0.2 - 1.0 g/L/h (theoretical max higher) | CFS concentrates catalysts, removing growth lag. |
| Time to First Product | 24 - 72 hours | 1 - 4 hours | CFS avoids cell division and metabolic routing. |
| Pathway Construction Time | Weeks (cloning/selection) | Days (enzyme expression/mixing) | |
| Cofactor Recycling | In vivo metabolism | Must be engineered (e.g., GDH/glucose) | A key challenge for CFS scalability. |
Application Notes & Protocols
AN-1: Establishing a Base Cell-Free Fatty Acid Decarboxylation System
Objective: To reconstitute the carboxylic acid reductase (CAR) and aldehyde deformylating oxygenase (ADO) pathway for converting dodecanoic acid (C12) to undecane (C11).
Research Reagent Solutions Toolkit
| Reagent/Material | Function in the System | Typical Source/Concentration |
|---|---|---|
| Purified CAR Enzyme | ATP-dependent reduction of fatty acid to fatty aldehyde. | Recombinant Nocardia CAR, 5-10 µM final. |
| Purified ADO Enzyme | O2-dependent deformylation of aldehyde to alkane (Cn-1) + formate. | Recombinant Prochlorococcus ADO, 10-20 µM final. |
| ATP | Energy source for the CAR-catalyzed reduction step. | 5-10 mM final. |
| NADPH | Reducing equivalent for CAR catalytic cycle. | 2-5 mM final. |
| MgCl₂ | Essential divalent cation cofactor for ATP/NADPH. | 10-20 mM final. |
| Phosphate Buffer (pH 7.4) | Maintains optimal enzymatic pH. | 50-100 mM final. |
| Glucose Dehydrogenase (GDH) | Co-Expression system for NADPH regeneration from glucose. | Bacillus subtilis GDH, 5-10 U/mL. |
| D-Glucose | Substrate for GDH to regenerate NADPH. | 20-50 mM final. |
| Dodecanoic Acid (C12:0) | Model fatty acid substrate. | 1-5 mM final, may require solubilizer. |
| Oxygen Scavenging System | Maintains low O2 for ADO activity (optional, see protocol). | Glucose Oxidase/Catalase. |
Protocol 1.1: Two-Enzyme Decarboxylation Batch Reaction
- Reaction Setup: On ice, assemble a master mix in a 1.5 mL microtube:
- 50 µL 1M Potassium Phosphate Buffer, pH 7.4
- 10 µL 1M MgCl₂
- 20 µL 100 mM ATP
- 10 µL 100 mM NADPH
- 50 µL 200 mM D-Glucose
- 5 µL GDH enzyme solution (100 U/mL stock)
- 10 µL 50 mM Dodecanoic Acid (in 10% DMSO)
- X µL Purified CAR enzyme (to 5 µM final)
- Y µL Purified ADO enzyme (to 15 µM final)
- Nuclease-free water to 490 µL total volume.
- Pre-equilibration: Transfer the mix to a sealed, anaerobic vial if using an O2-scavenging system. Incubate at 30°C for 5 min with shaking (200 rpm).
- Reaction Initiation: Add 10 µL of 100 mM Sodium Formate (an ADO activity enhancer) to start the reaction. Final volume: 500 µL.
- Incubation: Continue incubation at 30°C with shaking (200 rpm) for 4-24 hours.
- Termination & Extraction: Stop the reaction by adding 500 µL of ethyl acetate. Vortex vigorously for 2 minutes. Centrifuge at 14,000 x g for 5 min to separate phases.
- Analysis: Recover the organic (top) layer for analysis by GC-MS or GC-FID. Use undecane standard for quantification.
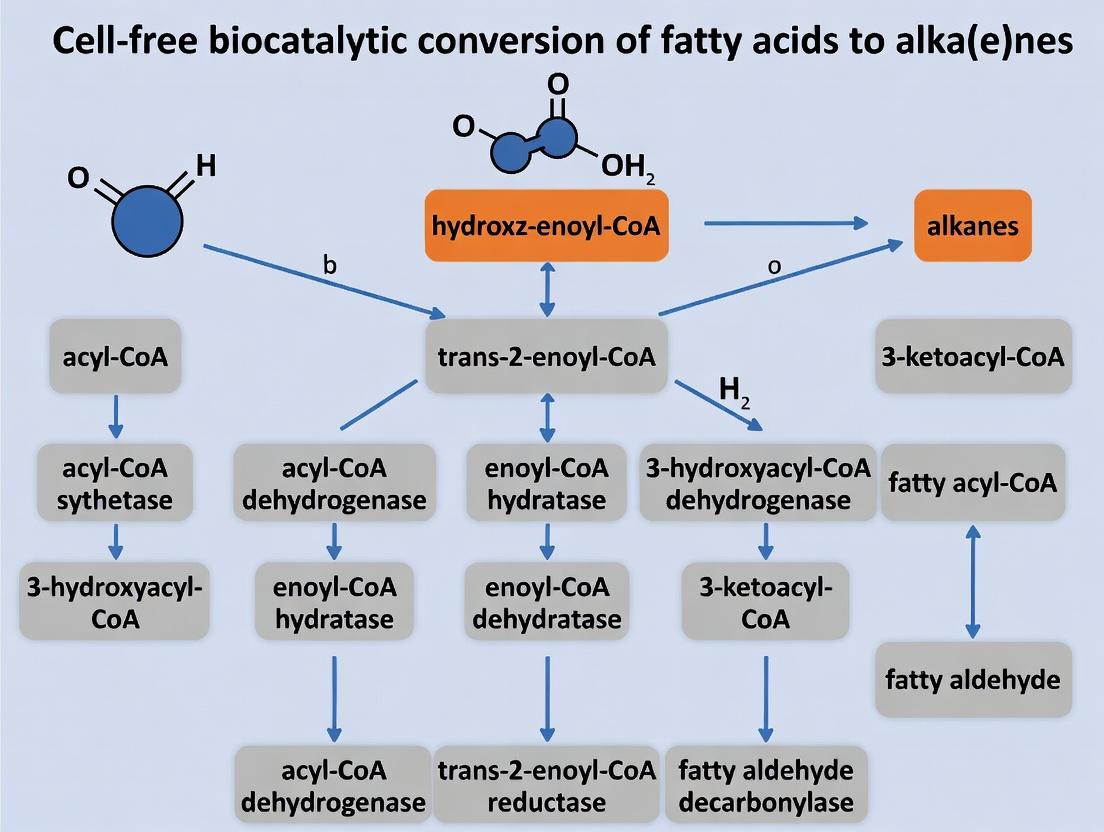
Diagram 1: Cell-Free Alkane Synthesis Pathway
AN-2: Implementing a Continuous Cofactor Recycling System
Objective: To couple alkane production with enzymatic cofactor regeneration for sustained activity.
Protocol 2.1: Continuous-Flow Membrane Reactor Setup
- Reactor Configuration: Use a stirred cell ultrafiltration unit (10 kDa MWCO membrane) connected to a syringe pump for feed input and a peristaltic pump for harvest.
- Feed Reservoir Preparation: Prepare 50 mL of Reaction Mix (as in Protocol 1.1, but without enzymes) containing 2 mM C12, 5 mM ATP, 2 mM NADP+, 50 mM Glucose.
- Enzyme Load: In the reactor chamber, load 5 mL of a concentrated enzyme mix (CAR 20 µM, ADO 40 µM, GDH 50 U/mL) in phosphate buffer.
- Operation: Start stirring. Initiate feed flow at a dilution rate (D) of 0.1 h⁻¹ (e.g., 0.5 mL/min feed into 5 mL chamber). Simultaneously, start harvest pump from the filtrate line.
- Monitoring & Collection: Collect filtrate in fractions over time. Monitor alkane (GC), glucose (enzyme assay), and NADPH fluorescence (ex 340/em 460 nm).
- Analysis: Product titer in the filtrate represents the system's steady-state productivity. Compare batch vs. continuous yield over 24-48 hours.
Diagram 2: Continuous Cell-Free Reactor Workflow
This application note details key enzymatic systems for the cell-free biocatalytic conversion of fatty acids to alka(e)nes, a critical pathway for producing next-generation biofuels and pharmaceutical hydrocarbons. Within a cell-free framework, the carboxylic acid reductase (CAR)/aldehyde deformylase (ADO) pathway, cytochrome P450 peroxygenases, and the acyl-ACP reductase (AAR)/ADO pathway offer distinct routes for decarboxylative and decarbonylative alkane synthesis. The protocols herein are designed for researchers and drug development professionals aiming to reconstitute these pathways in vitro for high-yield, tunable production.
Pathway Comparison Table
Table 1: Comparative Metrics for Enzymatic Alka(e)ne Synthesis Pathways
| Pathway | Key Enzymes | Primary Substrate | Cofactor Requirements | Reported Max Yield (in vitro) | Typical Product Chain Length | Major Advantage |
|---|---|---|---|---|---|---|
| CAR/ADO | CAR, ADO | Free Fatty Acid | ATP, NADPH, [2Fe-2S] cluster (for ADO) | ~85% (C12) | C8-C18 | Broad substrate specificity of CAR |
| P450 Peroxygenase (OleTJE) | CYP152 family P450 (e.g., OleT) | Free Fatty Acid | H2O2 (or NADPH redox partners) | ~92% (C18:1) | C12-C20 | Direct decarboxylation, single enzyme |
| AAR/ADO | AAR, ADO | Fatty Acyl-ACP | NADPH, [2Fe-2S] cluster (for ADO) | ~70% (C16) | C10-C18 | Native algal pathway, high specificity |
Enzyme Performance Data
Table 2: Kinetic Parameters of Core Enzymes
| Enzyme | Source Organism | kcat (min-1) | Km (μM) | Optimal pH | Optimal Temp (°C) |
|---|---|---|---|---|---|
| CAR | Mycobacterium marinum | 12.5 (C12 acid) | 45 (C12 acid) | 7.5 | 30 |
| ADO | Prochlorococcus marinus | 8.2 (C12 aldehyde) | 120 (C12 aldehyde) | 8.0 | 25 |
| P450 OleTJE | Jeotgalicoccus sp. | 280 (C16 acid) | 35 (C16 acid) | 8.5 | 35 |
| AAR | Synechococcus elongatus | 5.8 (C16-ACP) | 2.1 (C16-ACP) | 7.2 | 25 |
Experimental Protocols
Protocol: CAR/ADO Pathway Reconstitution for Alkane Production
Objective: To convert free fatty acids to alkanes using a purified, two-enzyme system. Materials: Purified CAR (with N-terminal phosphopantetheinylation domain), purified ADO, substrate fatty acid (e.g., dodecanoic acid), ATP, NADPH, MgCl2, Tris-HCl buffer (pH 7.5), DTT, anaerobic chamber/cuvettes. Procedure:
- Reaction Setup: In a 1 mL anaerobic cuvette, combine:
- 100 mM Tris-HCl, pH 7.5
- 5 mM MgCl2
- 1 mM ATP
- 0.5 mM NADPH
- 2 mM DTT
- 0.5 mM fatty acid substrate (from 100 mM stock in DMSO; final DMSO < 1% v/v)
- 5 μM CAR enzyme
- 10 μM ADO enzyme
- Initiation & Monitoring: Seal cuvette, purge headspace with argon for 2 min. Initiate reaction by adding NADPH. Monitor NADPH oxidation at 340 nm (ε = 6220 M-1cm-1) for 30 min at 30°C.
- Product Extraction & Analysis: Terminate reaction with 200 μL 6M HCl. Extract twice with 500 μL hexane, pool organic phases, dry under N2. Resuspend in 50 μL hexane for GC-MS analysis (HP-5ms column, 50-300°C ramp).
- Controls: Run parallel reactions minus enzyme, minus ATP, or with heat-inactivated enzymes.
Protocol: P450OleTDecarboxylation Using H2O2Shunt
Objective: To produce terminal alkenes from fatty acids using the peroxide-driven decarboxylase activity of P450 OleTJE. Materials: Purified P450 OleTJE (CYP152), substrate fatty acid (e.g., palmitoleic acid), H2O2 (30% w/w), Potassium Phosphate Buffer (pH 8.5), catalase. Procedure:
- Reaction Assembly: In a 2 mL microtube, mix:
- 100 mM Potassium Phosphate buffer, pH 8.5
- 0.25 mM fatty acid substrate (from ethanol stock)
- 10 μM P450 OleTJE
- Final volume 500 μL.
- H2O2 Feeding: Place tube on a vortexer at low speed. Using a syringe pump, add a bolus of H2O2 to a final concentration of 5 mM over 10 seconds. Caution: Rapid addition causes enzyme inactivation.
- Incubation & Quench: Incubate at 35°C for 20 min. Quench by adding 5 μL of catalase (10,000 U/mL) and vortexing.
- Analysis: Extract products with ethyl acetate (2 x 500 μL). Analyze by GC-FID or LC-MS.
Protocol: AAR/ADO Pathway from Acyl-ACP Substrates
Objective: To convert acyl-acyl carrier protein (ACP) substrates to alkanes, mimicking the native cyanobacterial system. Materials: Purified AAR and ADO enzymes, acyl-ACP substrate (commercially synthesized or prepared via in vitro acyltransferase reaction), NADPH, Tris-HCl (pH 7.2), DTT, Fe(NH4)2(SO4)2, anaerobic workstation. Procedure:
- Anaerobic Enzyme Activation: Prepare ADO under anaerobic conditions (glove box) with 10 μM Fe(NH4)2(SO4)2 for 30 min to reconstitute its [2Fe-2S] cluster.
- Master Mix: In an anaerobic vial, combine:
- 50 mM Tris-HCl, pH 7.2
- 5 mM DTT
- 0.5 mM NADPH
- 50 μM acyl-ACP (e.g., C16-ACP)
- 2 μM AAR
- 5 μM Fe-reconstituted ADO
- Reaction & Sampling: Incubate at 25°C with gentle shaking. At intervals (0, 10, 30, 60 min), remove 100 μL aliquot, quench with 20 μL 10% formic acid.
- Product Detection: Extract quenched samples with pentane. Analyze alkane product via highly sensitive GC-MS with selected ion monitoring (SIM).
Pathway & Workflow Visualizations
Diagram Title: CAR/ADO Two-Step Alkane Synthesis Pathway
Diagram Title: P450 Peroxygenase Direct Decarboxylation
Diagram Title: AAR/ADO Experimental Workflow
The Scientist's Toolkit
Table 3: Essential Research Reagent Solutions for Cell-Free Alkane Synthesis
| Reagent/Material | Supplier Examples | Function & Critical Notes |
|---|---|---|
| CAR Enzyme (His-tagged) | Sigma-Aldrich (recombinant), in-house expression (pET vector) | Catalyzes ATP/NADPH-dependent reduction of fatty acid to aldehyde. Requires phosphopantetheinylation for activity. |
| ADO Enzyme (Fe-S cluster) | Arbor Assays, in-house expression & anaerobic reconstitution | Performs the deformylation of aldehydes to alkanes/alkenes. Critical: Requires anaerobic [2Fe-2S] cluster reconstitution prior to use. |
| P450 OleTJE (CYP152) | Cayman Chemical, recombinant from E. coli | Direct decarboxylase using H2O2. Purity >95% required to minimize peroxidase side reactions. |
| Fatty Acyl-ACP Substrates | Avanti Polar Lipids (limited), custom synthesis (e.g., Genscript) | Native substrate for AAR/ADO pathway. Store at -80°C in neutral buffer to prevent hydrolysis. |
| NAPH Regeneration System | Sigma-Aldrich (Glucose-6-phosphate, G6P-DH) | Maintains NADPH pool for multi-turnover CAR or AAR reactions, crucial for yield. |
| Anaerobic Chamber | Coy Laboratory Products, Plas Labs | Essential for handling oxygen-sensitive ADO and for AAR/ADO pathway assays. |
| H2O2 (30%, stabilized) | Fisher Scientific | Used for P450 peroxide shunt. Must be added slowly to avoid enzyme bleaching. |
| Fe(NH4)2(SO4)2 | Sigma-Aldrich (Anaerobic grade) | Iron source for in vitro reconstitution of ADO's di-iron cluster. Prepare fresh in anaerobic buffer. |
| C18 Solid-Phase Extraction Columns | Waters, Agilent | For rapid cleanup and concentration of hydrophobic alkane products from aqueous reaction mixtures. |
Application Notes
This document details the application of a cell-free biocatalytic system for the conversion of diverse fatty acid substrates into alka(e)nes. This work is part of a broader thesis focused on developing a versatile enzymatic platform for biofuel and oleochemical precursor production. The system employs a two-enzyme cascade, typically featuring a fatty acid reductase (e.g., from Synechococcus elongatus) and an aldehyde deformylative oxygenase (ADO), which together convert acyl-CoA or ATP-activated fatty acids to alkanes/alkenes.
Recent advancements have expanded the native substrate scope of these enzymes. Key findings, synthesized from current literature, are summarized in Table 1. The system demonstrates robust conversion of saturated linear fatty acids (C12-C18). Conversion efficiency for unsaturated fatty acids (e.g., oleic acid, C18:1) is moderate, often lower than their saturated counterparts due to potential substrate-binding pocket constraints. Hydroxy fatty acids, such as ricinoleic acid, present a unique challenge; while they can be accepted, the presence of the hydroxyl group typically necessitates engineered enzyme variants or coupled systems with auxiliary reductases for efficient conversion to alkanes or alkane-diols.
Table 1: Substrate Scope and Conversion Efficiency of the Fatty Acid-to-Alka(e)ne System
| Substrate Class | Specific Example | Chain Length | Key Feature | Relative Conversion Yield* | Primary Product | Notes |
|---|---|---|---|---|---|---|
| Saturated | Lauric acid | C12:0 | Linear | ++++ (95-100%) | Undecane (C11) | Optimal substrate range. |
| Saturated | Palmitic acid | C16:0 | Linear | ++++ (90-98%) | Pentadecane (C15) | High activity observed. |
| Saturated | Stearic acid | C18:0 | Linear | +++ (80-90%) | Heptadecane (C17) | Slightly reduced yield vs C16. |
| Unsaturated | Oleic acid | C18:1 (Δ9) | Mono-unsaturated | ++ (50-70%) | Heptadecene (C17:1) | cis double bond may be retained or reduced. |
| Unsaturated | Linoleic acid | C18:2 (Δ9,12) | Poly-unsaturated | + (20-40%) | Mixture | Low yield, potential for side products. |
| Hydroxy | Ricinoleic acid | C18:1-OH (12-OH) | Monohydroxy, unsaturated | +/++ (30-60%) | Heptadecene / Heptadecanediol | Yield depends on ADO variant; may require decarboxylation & reduction. |
*++++: >90%; +++: 70-90%; ++: 40-70%; +: <40%. Yields are approximate and system-dependent.
Experimental Protocols
Protocol 1: Standard Cell-Free Biocatalytic Conversion Assay
Objective: To convert free fatty acids to alka(e)nes using a reconstituted enzyme system.
Research Reagent Solutions:
- Purified Enzymes: Fatty acid reductase (FAR, e.g., SeFAR) and Aldehyde deformylative oxygenase (ADO). Stored in 20 mM HEPES pH 7.5, 10% glycerol at -80°C.
- Reaction Buffer (5X): 250 mM HEPES-KOH pH 7.5, 50 mM MgCl2, 5 mM DTT.
- Substrate Solution: 50 mM fatty acid (e.g., palmitic acid) solubilized in 10% (v/v) Triton X-100.
- Cofactor Mix: 100 mM ATP, 50 mM NADPH, prepared fresh in nuclease-free water.
- Quenching/Extraction Solvent: Ethyl acetate with 0.1 mg/mL internal standard (e.g., tetradecane).
- GC-MS Analysis Setup: Gas Chromatograph coupled with Mass Spectrometer, equipped with a DB-5ms column.
Procedure:
- Prepare a 100 µL reaction mix on ice: 20 µL 5X Reaction Buffer, 2 µL Substrate Solution (final 1 mM), 10 µL Cofactor Mix (final 10 mM ATP, 5 mM NADPH), 0.5 µM FAR, 2 µM ADO. Bring to volume with nuclease-free water.
- Vortex gently and incubate at 30°C for 4 hours with mild shaking (300 rpm).
- Quench the reaction by adding 200 µL of Quenching/Extraction Solvent. Vortex vigorously for 2 minutes.
- Centrifuge at 14,000 x g for 5 minutes to separate phases.
- Carefully transfer the upper organic layer to a fresh GC vial.
- Analyze by GC-MS using a temperature ramp (e.g., 50°C hold 2 min, ramp 15°C/min to 300°C, hold 5 min). Identify products by retention time and mass spectra compared to authentic standards. Quantify via internal standard calibration curve.
Protocol 2: Screening Substrate Scope with Hydroxy Fatty Acids
Objective: To assess and optimize conversion of hydroxy fatty acids (e.g., ricinoleic acid).
Modifications to Protocol 1:
- Substrate Solution: Prepare 50 mM ricinoleic acid in 10% Triton X-100. Sonicate if necessary.
- Enzyme Variants: Include engineered ADO variants with broader substrate tunnels or enhanced activity.
- Optional Additive: Consider adding a phosphopantetheine transferase (PPTase) and coenzyme A (CoA, final 0.5 mM) to first activate the hydroxy acid to its CoA ester, which may be a preferred substrate for some FARs.
- Extended Incubation: Increase incubation time to 6-8 hours.
- Product Analysis: Use a derivatization step (e.g., silylation with BSTFA) before GC-MS to analyze polar products like alkanediols.
The Scientist's Toolkit
| Reagent / Material | Function in the Experiment |
|---|---|
| Fatty Acid Reductase (FAR) | Activates the carboxylic acid to a fatty acyl-adenylate, then reduces it to the corresponding fatty aldehyde using NADPH. |
| Aldehyde Deformylative Oxygenase (ADO) | Cleaves the C1-C2 bond of the fatty aldehyde, using O2 and reducing equivalents, to form alk(a/e)ne and formate. |
| NADPH | Essential cofactor providing reducing power for both FAR and ADO catalytic cycles. |
| ATP | Drives the initial adenylation activation of the fatty acid substrate by FAR. |
| MgCl₂ | Divalent cation required as a cofactor for ATP-dependent enzymatic steps. |
| HEPES Buffer | Maintains physiological pH (7.5) for optimal enzyme stability and activity. |
| Triton X-100 | Non-ionic detergent to solubilize hydrophobic fatty acid substrates in aqueous reaction mixtures. |
| Ethyl Acetate | Organic solvent for quenching reactions and extracting hydrophobic alkane products. |
| GC-MS with DB-5ms Column | Analytical platform for separating, identifying, and quantifying volatile alkane products and remaining substrates. |
Visualizations
Enzymatic Conversion Pathways for Fatty Acid Classes
Two-Step Enzymatic Mechanism for Alkane Synthesis
Within the field of cell-free biocatalysis for the conversion of fatty acids to alka(e)nes, the precise management of cofactor pools is the principal determinant of system efficiency, titer, and scalability. This research area, pivotal for producing renewable drop-in biofuels and biochemical precursors, decouples alkane production (e.g., via enzymes like carboxylic acid reductase (CAR) and aldehyde deformylating oxygenase (ADO)) from cellular metabolism. However, this liberation introduces the critical challenge of in vitro cofactor regeneration.
NADPH is the essential electron donor for the reduction steps catalyzed by CAR and ADO. Its consumption is stoichiometric to fatty acid conversion. ATP is required by CAR for the adenylation-activation of the fatty acid substrate. Each catalytic cycle consumes 2 equivalents of NADPH and 1-2 ATP per fatty acid molecule. Electron transport mechanisms are crucial for coupling regeneration systems, often involving redox mediators or enzyme cascades to recycle oxidized cofactors (NADP⁺, ADP) back to their reduced/phosphorylated forms.
Sustained catalysis requires recycling these expensive cofactors in situ. Failure to maintain their reduced/charged states results in rapid reaction arrest, limiting total turnover numbers (TTNs) and product yields. The following protocols and data address these dependencies.
Table 1: Cofactor Stoichiometry & Kinetic Parameters for Key Enzymes in Alka(e)ne Synthesis
| Enzyme (EC Number) | Cofactor Consumed | kₘₐₜ (s⁻¹) | Kₘ for Cofactor (µM) | Turnover Number (TTN) in vitro |
|---|---|---|---|---|
| CAR (1.2.1.-) | ATP, NADPH | 0.5 - 2.1 | ATP: 80-120; NADPH: 40-90 | 10³ - 10⁴ |
| ADO (1.14.18.-) | NADPH, O₂ | 0.05 - 0.3 | NADPH: 15-50 | 10² - 10³ |
| Glucose Dehydrogenase (GDH, 1.1.1.47) | NADP⁺ | ~300 | NADP⁺: ~110 | > 10⁶ |
| Polyphosphate Kinase (PPK, 2.7.4.1) | PolyP (for ADP→ATP) | ~15 | ADP: ~200 | > 10⁴ |
Table 2: Performance of Cofactor Regeneration Systems in Cell-Free Alka(e)ne Synthesis
| Regeneration System | Cofactor Recycled | Max Reported Yield (Alka(e)ne) | Cofactor Turnover Number (CTN) | Key Limitation |
|---|---|---|---|---|
| GDH / Glucose | NADPH | 85% (C12) | > 500 | Osmotic stress, side products |
| Phosphite Dehydrogenase (PTDH) / Phosphite | NADPH | 92% (C8) | > 1000 | Substrate (phosphite) cost |
| PPK / Polyphosphate | ATP | 78% (C16) | ~ 2000 | Polyphosphate chain length sensitivity |
| Coupled: GDH + PPK | NADPH & ATP | 95% (C10) | NADPH: >400; ATP: >1500 | System complexity |
Experimental Protocols
Protocol 1: Reconstituted Cell-Free Alka(e)ne Production with Cofactor Regeneration
Objective: To convert dodecanoic acid (C12:0) to undecane using a purified enzyme system with full cofactor recycling.
Materials:
- Enzymes: Purified CAR (from M. marinum), ADO (from Prochlorococcus marinus), GDH (Bacillus subtilis), PPK (E. coli).
- Substrates: Dodecanoic acid (10 mM), D-Glucose (50 mM), Polyphosphate (PolyP₆₅, 20 mM as phosphate monomer).
- Cofactors: NADP⁺ (0.5 mM), ADP (0.5 mM), MgCl₂ (10 mM).
- Buffer: 100 mM HEPES-KOH, pH 7.5, 150 mM KCl.
- Analysis: GC-FID for alkane quantification; HPLC for cofactor assay.
Procedure:
- Master Mix Preparation: In a 2 mL reaction vial, combine on ice:
- 500 µL 2x Reaction Buffer (200 mM HEPES, 300 mM KCl, pH 7.5)
- 20 µL 1 M MgCl₂ (final 20 mM)
- 20 µL 25 mM NADP⁺ (final 0.5 mM)
- 20 µL 25 mM ADP (final 0.5 mM)
- 100 µL 500 mM D-Glucose (final 50 mM)
- 100 µL 200 mM PolyP₆₅ stock (final 20 mM)
- 20 µL 500 mM Dodecanoic Acid (in DMSO, final 10 mM)
- Add nuclease-free water to 980 µL.
- Enzyme Addition: Just prior to incubation, add:
- 5 µg CAR
- 10 µg ADO
- 10 µg GDH
- 5 µg PPK
- Bring final volume to 1.0 mL with water.
- Reaction Incubation: Seal vial, vortex gently. Incubate at 30°C with shaking at 250 rpm for 16 hours.
- Termination & Extraction: Add 1 mL of ethyl acetate containing 0.1 mM dodecane as internal standard. Vortex vigorously for 2 min. Centrifuge at 14,000 x g for 5 min. Recover organic layer.
- Analysis: Analyze 1 µL of organic extract by GC-FID. Quantify undecane against standard curve. Monitor cofactor levels by HPLC (C18 column, isocratic 100 mM phosphate buffer, pH 6.0, UV detection at 260 nm & 340 nm).
Protocol 2: Assessing Electron Transport & NADPH Limitation via Real-Time Kinetics
Objective: To monitor the rate of NADPH consumption/regeneration and its direct correlation with alkane formation.
Materials:
- Spectrophotometer or plate reader capable of kinetic reads at 340 nm and 600 nm.
- Reaction components as in Protocol 1, minus ADO for initial NADPH oxidation assay.
- Redox dye: Resazurin (0.1 mM) for optional coupled electron transport monitoring.
Procedure:
- Direct NADPH Assay: In a quartz cuvette or clear 96-well plate, prepare a 300 µL reaction containing all components from Protocol 1, Step 1 (scaled down), plus enzymes. Omit ADO to isolate the CAR + regeneration system.
- Kinetic Measurement: Immediately place in spectrophotometer. Record absorbance at 340 nm (A₃₄₀, NADPH) every 10 seconds for 10 minutes. The initial linear decrease reflects CAR activity; subsequent steady-state indicates regeneration by GDH.
- Full System with Electron Sink: Repeat Step 1 including ADO. Monitor A₃₄₀. The steady-state A₃₄₀ will be lower, indicating higher NADPH turnover due to the additional electron sink (ADO).
- (Optional) Redox Coupling Assay: Include 0.1 mM resazurin. Monitor A₆₀₀ (reduction of resazurin to resorufin) concurrently with A₃₄₀. A rise in A₆₀₀ indicates electron flux from NADPH to ADO via possible non-enzymatic electron shuttling, especially under O₂ limitation.
Diagrams
Title: Cofactor-Driven Pathway for Cell-Free Alkane Synthesis
Title: Experimental Workflow for Alka(e)ne Cofactor Studies
The Scientist's Toolkit: Research Reagent Solutions
Table 3: Essential Reagents for Cell-Free Alka(e)ne Biocatalysis
| Reagent / Solution | Function & Rationale | Example Supplier / Catalog |
|---|---|---|
| Carboxylic Acid Reductase (CAR) | Key enzyme for ATP/NADPH-dependent reduction of fatty acid to aldehyde. Often used as His-tagged recombinant protein from Mycobacterium marinum. | Purified in-house from expression in E. coli BL21(DE3). |
| Aldehyde Deformylating Oxygenase (ADO) | Non-heme di-iron enzyme that converts fatty aldehyde to alkane (Cn-1) using O₂ and NADPH. Rate-limiting step; requires careful O₂ management. | Purified in-house (e.g., Prochlorococcus marinus). |
| Glucose Dehydrogenase (GDH), B. subtilis | Robust, substrate-specific NADPH regeneration enzyme. Converts inexpensive D-glucose and NADP⁺ to gluconolactone and NADPH. | Sigma-Aldrich, G2620; or Codexis engineered variants. |
| Polyphosphate Kinase (PPK) | Regenerates ATP from ADP using inorganic polyphosphate (PolyP), a low-cost phosphate polymer. Critical for sustained CAR activity. | Enzymatic, from E. coli; or thermostable variants. |
| Nicotinamide Cofactors (NADP⁺/NADPH) | Essential redox cofactors. Using NADP⁺ with regeneration systems is more economical than supplying NADPH stoichiometrically. | Roche, 10128031001 (NADP⁺); 10107824001 (NADPH). |
| Inorganic Polyphosphate (PolyP₆₅) | Long-chain phosphate polymer serving as phosphoryl donor for ATP regeneration via PPK. Chain length affects activity. | Kerafast, ES006; or Sigma-Aldrich, 72553. |
| O₂-Scavenging / Controlling System | ADO is O₂-sensitive. Systems like glucose/glucose oxidase/catalase can maintain microaerobic conditions to optimize ADO turnover. | Prepared fresh: Glucose oxidase (Sigma G7141), Catalase (Sigma C9322). |
| HEPES-KOH Buffer (pH 7.5, 100-200 mM) | Standard in vitro biocatalysis buffer with excellent pH stability, minimal metal chelation, and compatibility with Mg²⁺/ATP. | Thermo Fisher, 15630080. |
| Dodecanoic Acid (C12:0) in DMSO | Model substrate for alkane (undecane) production. Solubilized in DMSO for easy addition to aqueous reaction mixes. | Sigma-Aldrich, D3643. |
Historical Evolution and Key Milestones in Cell-Free Biocatalysis Research
Thesis Context
This article details the historical evolution of cell-free biocatalysis, with application notes and protocols framed within a broader thesis on the cell-free biocatalytic conversion of fatty acids to alka(e)nes—a critical pathway for producing next-generation biofuels and pharmaceuticals.
Key Historical Milestones and Data
The progression of cell-free biocatalysis is marked by foundational discoveries and quantitative improvements in yield, stability, and complexity.
Table 1: Key Historical Milestones in Cell-Free Biocatalysis
| Year | Milestone | Key Innovation | Relevance to Fatty Acid to Alkane Conversion |
|---|---|---|---|
| 1897 | Eduard Buchner's Zymase | Discovery of cell-free fermentation. | Proved biochemical reactions could occur outside living cells. |
| 1960s | Purified Enzyme Systems | Use of isolated enzymes for synthesis. | Enabled study of individual enzymatic steps in fatty acid metabolism. |
| 1980s | Cofactor Regeneration Systems | Development of NAD(P)H recycling methods. | Critical for redox-heavy pathways like fatty acid decarboxylation. |
| 2000s | Metabolic Engineering Integration | Use of cell extracts for complex pathways. | Allowed reconstitution of multi-enzyme pathways like the acyl-ACP reductase (AAR)/aldehyde-deformylating oxygenase (ADO) system. |
| 2010-2015 | High-Yield Alkane Production | Optimization of cell-free systems for fuel synthesis. | Achieved titers of ~300 mg/L alkanes from fatty acids using purified enzymes. |
| 2016-2020 | Cofactor and Energy Optimization | ATP/NADPH regeneration systems in lysates. | Improved total turnover numbers (TTN) for ADO beyond 10,000. |
| 2021-Present | Machine Learning & High-Throughput Screening | AI-driven enzyme engineering and microfluidics. | Increased alkane productivity by 5-10 fold in selected systems; enabled rapid testing of novel enzyme variants. |
Table 2: Quantitative Evolution of Cell-Free Alkane Production from Fatty Acids
| System Type | Typical Alkane Titer (mg/L) | Time to Peak Titer (hours) | Key Limitation Overcome | Approx. Year Reported |
|---|---|---|---|---|
| Early Purified Enzymes (AAR/ADO) | 5-30 | 24-48 | Low enzyme stability, poor cofactor recycling. | 2010 |
| Optimized Cofactor Regeneration | 80-150 | 12-18 | Inefficient NADPH supply. | 2014 |
| Engineered Enzyme Variants | 200-400 | 8-12 | Low catalytic efficiency of native ADO. | 2018 |
| Hybrid Systems (Synthetic Biology & CF) | 600-1200+ | 6-10 | Pathway bottlenecks and side-reactions. | 2022-2023 |
Application Notes & Protocols
Application Note 1: High-Yield Alkane Production from Free Fatty Acids Using a Purified Enzyme System
Objective: To convert free fatty acids (e.g., palmitic acid, C16:0) to corresponding alkanes (pentadecane, C15) using the two-enzyme AAR/ADO pathway with in vitro cofactor regeneration. Background: This purified system offers precise control over enzyme ratios and avoids competing reactions present in cell lysates, leading to clearer mechanistic insights and higher per-enzyme efficiency.
Protocol 1: Reconstituted AAR/ADO Reaction with Cofactor Regeneration
Principle:Acyl-ACP reductase (AAR) reduces activated fatty acyl-ACP to fatty aldehyde using NADPH. Aldehyde-deformylating oxygenase (ADO) converts the aldehyde to alkane (n-1) and formate, consuming O₂ and requiring reducing equivalents (ferredoxin/ferredoxin-NADP⁺ reductase (FNR) system).
Materials (Research Reagent Solutions):
- Purified Enzymes: His-tagged AAR (from Synechococcus elongatus), His-tagged ADO (from S. elongatus), Spinach FNR.
- Substrate Solution: 1 mM Palmitoyl-Acyl Carrier Protein (ACP), prepared in 50 mM Tris-HCl, pH 8.0.
- Cofactor Master Mix: 1 mM NADP⁺, 10 mM Glucose-6-Phosphate, 1 U/µL Glucose-6-Phosphate Dehydrogenase (for NADPH regeneration).
- Redox Partner System: 10 µM Ferredoxin (Fd, spinach), 100 µM Fe(NH₄)₂(SO₄)₂, 100 µM L-Cysteine (for [2Fe-2S] cluster maintenance).
- Reaction Buffer: 50 mM HEPES-NaOH, pH 7.5, 100 mM NaCl, 10 mM MgCl₂.
*Analytical Standard:500 µg/mL Pentadecane in dodecane.
Procedure:
- Reaction Setup: In a 2 mL anaerobic vial, combine on ice:
- 100 µL Reaction Buffer
- 10 µL Substrate Solution (final [Palmitoyl-ACP] = 100 µM)
- 20 µL Cofactor Master Mix
- 5 µL Redox Partner System (Fd, Fe²⁺, Cysteine)
- 2 µg purified AAR enzyme
- 5 µg purified ADO enzyme
- 1 µg purified FNR
- Bring total volume to 200 µL with nuclease-free water.
- Initiation: Seal the vial with a PTFE/silicone septum cap. Flush the headspace with a gentle stream of argon for 2 minutes to create micro-aerobic conditions (ADO requires limited O₂).
- Incubation: Place the vial in a thermoshaker at 30°C, 500 rpm for 6 hours.
- Extraction: Stop the reaction by adding 200 µL of ethyl acetate containing 10 µg/mL tetradecane (internal standard). Vortex vigorously for 2 minutes.
- Analysis: Centrifuge at 14,000 x g for 5 min. Analyze the organic phase by GC-MS or GC-FID. Quantify pentadecane against the internal standard using a calibrated standard curve. Expected Outcome: Yield of 60-100 mg/L pentadecane under optimal conditions.
Diagram Title: Alkane Synthesis and Analysis Workflow
Application Note 2: Screening ADO Enzyme Variants in a High-Throughput Cell-Free Format
Objective: To rapidly screen libraries of engineered ADO mutants for improved activity and stability using a cell-free coupled assay in microtiter plates. Background: Directed evolution of ADO is crucial for improving the rate-limiting deformylation step. Cell-free screening bypasses cell wall and viability constraints.
Protocol 2: 96-Well Plate-Based ADO Activity Coupled Assay
Principle:ADO activity is coupled to formaldehyde production from the aldehyde substrate. Formaldehyde is quantified colorimetrically using Purpald reagent (4-amino-3-hydrazino-5-mercapto-1,2,4-triazole), which turns purple upon oxidation.
Materials (Research Reagent Solutions):
- Cell-Free Reaction Mix: E. coli S30 or S12 extract overexpressing AAR, 50 µM Octadecanal (substrate), 5 mM NADPH, 2 mM L-Cysteine, 50 µM Ferredoxin.
- ADO Variant Library: Lysates from E. coli expressing different His-tagged ADO mutants (normalized for total protein).
- Purpald Reagent: 65 mM Purpald in 2 M NaOH (prepare fresh).
- Oxidant Solution: 640 mM Potassium Periodate (KIO₄) in water.
- Assay Buffer: 100 mM HEPES-KOH, pH 7.4.
*Positive/Negative Controls:Wild-type ADO lysate, empty vector lysate.
Procedure:
- Coupling Reaction: In a 96-well PCR plate, mix:
- 10 µL Cell-Free Reaction Mix
- 10 µL of each ADO variant lysate (or control)
- Seal plate, incubate in a thermocycler at 30°C for 90 min.
- Formaldehyde Detection: Transfer 15 µL of each reaction to a new clear-bottom 96-well assay plate.
- Add 50 µL of Purpald Reagent. Incubate at room temperature for 20 min. A purple color develops proportionally to formaldehyde concentration.
- Add 50 µL of Oxidant Solution. Incubate for 5 min to stabilize color.
- Measurement: Read absorbance at 550 nm using a plate reader.
- Analysis: Calculate relative activity of mutants compared to the wild-type ADO control (set at 100%). Normalize for background from the empty vector control. Expected Outcome: Identification of mutants with 1.5 to 3-fold higher specific activity than wild-type ADO.
Diagram Title: Fatty Acid to Alkane Core Pathway
The Scientist's Toolkit: Research Reagent Solutions
Table 3: Essential Materials for Cell-Free Alkane Production Experiments
| Reagent/Material | Function & Rationale | Example Source/Notes |
|---|---|---|
| Fatty Acyl-ACP Substrates | Physiological substrate for the AAR enzyme; ensures correct enzyme recognition and activity. | Chemically synthesized or enzymatically loaded using ACP synthase. |
| Purified AAR/ADO Enzymes | Core biocatalysts for the defined two-step decarboxylation pathway. | Recombinant His-tagged proteins purified from E. coli via Ni-NTA chromatography. |
| NADPH Regeneration System (G6P/G6PDH) | Maintains NADPH pool without costly stoichiometric addition; drives the reductase step. | Commercial enzymes (e.g., from Leuconostoc mesenteroides) ensure high efficiency. |
| Ferredoxin (Fd) / FNR System | Supplies reducing equivalents to ADO, which cannot directly use NADPH. Essential for ADO turnover. | Spinach ferredoxin and FNR are commonly used due to commercial availability and compatibility. |
| O₂-Scavenging/Control System | Controls micro-aerobic conditions as ADO is O₂-sensitive but requires limited O₂ for catalysis. | Glucose Oxidase/Catalase system or controlled headspace flushing with Ar/O₂ mixes. |
| Cell-Free Protein Synthesis (CFPS) Kit | For rapid expression and testing of enzyme variants without cellular constraints. | Commercial E. coli-based systems (e.g., from Arbor Biosciences) or homemade S30 extracts. |
| Purpald Reagent (4-Amino-3-hydrazino-5-mercapto-1,2,4-triazole) | Enables high-throughput colorimetric detection of ADO activity via formaldehyde quantification. | Must be prepared fresh in strong base for optimal sensitivity. |
| GC-MS with FID Detector | Gold-standard analytical method for identifying and quantifying alkane products in complex mixtures. | Requires a non-polar capillary column (e.g., DB-5MS). |
Building the Reaction from Scratch: Methodologies for Robust Cell-Free System Assembly and Application
Within the framework of cell-free biocatalytic conversion of fatty acids to alka(e)nes, enzyme sourcing is a critical determinant of yield, cost, and operational stability. The pathway typically involves fatty acid activation (e.g., by a fatty acyl-AMP ligase, FAAL) followed by a decarbonylative reduction step (e.g., by an aldehyde deformylating oxygenase, ADO). This application note compares three enzyme sourcing strategies for implementing this cascade.
Purified Enzymes: Isolated, homogeneous enzyme preparations. Offer maximum specificity and minimal side reactions, enabling precise kinetic modeling. Ideal for mechanistic studies and high-value product synthesis, but costly and time-intensive to produce. Crude Lysates: Cell extracts containing the target enzymes alongside host cell proteins and metabolites. Provide a more "cellular" environment with potential cofactor regeneration systems. Significantly lower cost and preparation time, suitable for rapid prototyping and pathway balancing. Immobilized Formats: Enzymes (purified or from lysates) attached to solid supports. Enhance thermostability, enable enzyme reuse, and simplify product separation. Crucial for continuous flow bioreactors and scalable, industrial bioprocessing.
Table 1: Quantitative Comparison of Enzyme Sourcing Strategies for Cell-Free Alka(e)ne Production
| Parameter | Purified Enzymes | Crude Lysate | Immobilized (on Carrier Beads) |
|---|---|---|---|
| Relative Preparation Cost | High ($500-1000/g) | Low ($10-50/g) | Medium-High ($200-600/g + carrier) |
| Typical Total Yield (C16 acid to alkane) | 85-95% | 60-80% | 70-90% (over multiple cycles) |
| Time to Experiment Ready | 3-5 days | 1 day | 2-4 days (incl. immobilization) |
| Operational Half-life (t½ @ 30°C) | 4-8 hours | 2-6 hours | 48-120 hours |
| Specific Activity (U/mg total protein) | 10-20 U/mg | 2-8 U/mg | 5-15 U/mg (of loaded enzyme) |
| Cofactor Regeneration Required | Explicit system needed | Often endogenous | Explicit system needed |
| Best Application Context | Pathway kinetics studies, High-purity synthesis | Rapid screening, Multi-enzyme complex studies | Continuous bioconversion, Scalable processes |
Experimental Protocols
Protocol 3.1: Generating CrudeE. coliLysates Expressing FAAL/ADO Pathway
Objective: Prepare an active cell-free system containing fatty acid to alkane conversion machinery. Reagents: E. coli BL21(DE3) strains expressing His-tagged FAAL and ADO, Lysozyme, DNase I, Protease Inhibitor Cocktail, Reaction Buffer (50 mM HEPES pH 7.5, 10 mM MgCl₂). Procedure:
- Grow 500 mL culture to OD₆₀₀ ~0.6-0.8, induce with 0.5 mM IPTG, and incubate 16-18h at 18°C.
- Harvest cells by centrifugation (4,000 x g, 20 min, 4°C). Resuspend pellet in 10 mL lysis buffer (Reaction Buffer + 1 mg/mL lysozyme, 1x protease inhibitor).
- Incubate on ice for 30 min, then sonicate on ice (10 cycles of 30 sec pulse, 59 sec rest).
- Clarify lysate by centrifugation (16,000 x g, 30 min, 4°C). Aliquot supernatant (crude lysate) and store at -80°C.
- Determine total protein concentration via Bradford assay.
Protocol 3.2: Alkane Production Assay Using Immobilized Enzymes
Objective: Perform and recycle a biocatalytic reaction using enzymes immobilized on Ni-NTA magnetic beads. Reagents: Purified His-FAAL and His-ADO, Ni-NTA Magnetic Beads, Sodium Phosphate Buffer (50 mM, pH 8.0, 300 mM NaCl), Palmitic Acid (C16), ATP, NADPH, Tween-20. Immobilization:
- Wash 200 µL bead slurry 3x with 500 µL Sodium Phosphate Buffer.
- Incubate beads with 500 µg each of His-FAAL and His-ADO in 1 mL total volume for 1h at 4°C with gentle mixing.
- Wash beads 3x with buffer to remove unbound enzyme. Resuspend in 200 µL storage buffer (add 20% glycerol). Bioconversion Reaction:
- In a 2 mL tube, combine: 100 µL immobilized enzyme beads, 1 mM Palmitic Acid (from 100 mM stock in 5% Tween-20), 5 mM ATP, 2 mM NADPH, in 1 mL total Reaction Buffer.
- Incubate at 30°C with shaking (300 rpm) for 4 hours.
- Separate beads using a magnetic rack. Recover supernatant for product analysis via GC-MS.
- Wash beads with 1 mL Reaction Buffer. Reuse beads for next reaction cycle by adding fresh substrates and cofactors.
Diagrams
Diagram 1: Core enzymatic pathway for fatty acid to alkane conversion.
Diagram 2: Decision workflow for selecting an enzyme sourcing strategy.
The Scientist's Toolkit: Research Reagent Solutions
Table 2: Essential Materials for Cell-Free Alka(e)ne Biocatalysis
| Reagent/Material | Function & Rationale | Example Vendor/Source |
|---|---|---|
| His-Tagged FAAL/ADO Vectors | Enables overexpression and one-step purification or direct immobilization via His-Tag. | Addgene, Custom gene synthesis |
| Nickel-NTA Agarose/Magnetic Beads | Affinity resin for purifying His-tagged enzymes or for direct enzyme immobilization. | Qiagen, Thermo Fisher Scientific |
| NADPH Regeneration System | Sustains reductant supply for ADO; e.g., Glucose-6-phosphate + G6PDH. | Sigma-Aldrich, Roche |
| Fatty Acid Substrate (e.g., C16:0) | Primary reactant. Use Tween-20 solublization for aqueous compatibility. | Cayman Chemical, Sigma-Aldrich |
| GC-MS System | Gold-standard for quantifying gaseous/short-chain alkane products. | Agilent, Shimadzu |
| Lysozyme & Protease Inhibitors | Essential for generating active, stable crude lysates by controlled lysis. | Thermo Fisher Scientific |
| HEPES or Phosphate Buffer | Maintains optimal pH (7.5-8.0) for FAAL and ADO activity. | Various biochemical suppliers |
| Continuous Flow Bioreactor (Mini-scale) | Enables testing of immobilized enzymes in a continuous process. | Cole-Parmer, Cytiva |
Within the broader thesis on Cell-free biocatalytic conversion of fatty acids to alka(e)nes, optimizing the reaction cocktail is paramount for achieving high titer, yield, and productivity. This application note details protocols and considerations for three critical components: the buffer system, cofactor regeneration, and enzyme stabilizers, based on the most current research and methodologies.
Buffer Systems: Maintaining Optimal pH
The choice of buffer is critical for maintaining the optimal pH for aldehyde-deformylating oxygenase (ADO) and associated enzymes (e.g., carboxylic acid reductase, CAR). Tris-HCl and HEPES are common, but phosphate buffers can interfere with certain enzymes or precipitation reactions.
Protocol 2.1: Buffer Screening for ADO Activity
- Objective: Determine the optimal buffer type and pH for maximal ADO activity.
- Materials: Purified ADO, substrate (fatty aldehyde, e.g., octadecanal), NADPH, oxygen scavenging system (e.g., glucose/glucose oxidase/catalase).
- Method:
- Prepare 100 mM buffer solutions across a pH range of 6.5-8.5 (e.g., MES for pH 6.5, HEPES for pH 7.0-7.5, Tris-HCl for pH 8.0-8.5).
- Assemble 200 µL reactions containing: 50 mM buffer, 100 µM substrate, 200 µM NADPH, 5 µM ADO, oxygen scavenging system.
- Incubate at 30°C with shaking (250 rpm) for 1 hour.
- Terminate the reaction by adding 200 µL ethyl acetate.
- Extract the alkane product and quantify via GC-MS using pentadecane as an internal standard.
- Key Data Table: Buffer Performance
| Buffer (50 mM) | pH | Relative Activity (%) | Alkane Titer (µM) | Notes |
|---|---|---|---|---|
| Potassium Phosphate | 7.5 | 100 (reference) | 85.2 | May precipitate Mg²⁺ |
| HEPES-KOH | 7.5 | 118 | 100.5 | Recommended for high ionic strength |
| Tris-HCl | 8.0 | 95 | 80.9 | pH sensitive to temperature |
| Bicine | 8.0 | 105 | 89.3 | Good metal chelation |
| Glycine-NaOH | 8.5 | 78 | 66.4 | Poor buffering capacity near pH 8.0 |
Cofactor Regeneration: Sustaining NADPH Supply
ADO requires NADPH as a reductant. An efficient, cost-effective regeneration system is essential for preparative synthesis.
Protocol 3.1: Coupled NADPH Regeneration via Glucose-6-Phosphate Dehydrogenase (G6PDH)
- Objective: Implement a closed-loop system to recycle NADP⁺ back to NADPH.
- Materials: ADO, G6PDH (from Saccharomyces cerevisiae), NADP⁺, Glucose-6-Phosphate (G6P), MgCl₂.
- Method:
- Prepare a master mix containing: 100 mM HEPES-KOH (pH 7.5), 10 mM MgCl₂, 2 mM NADP⁺, 20 mM G6P, 5 U/mL G6PDH.
- Add fatty acid/aldehyde substrate (final 1 mM) and ADO (final 5 µM).
- Incubate at 30°C. Monitor NADPH consumption spectroscopically at 340 nm or take time points for product extraction and GC-MS analysis.
- Compare against a control reaction with a single bolus of NADPH (no regeneration system).
Protocol 3.2: Phosphite Dehydrogenase (PTDH) Based Regeneration
- Objective: Utilize an alternative, kinetically favorable regeneration system.
- Materials: Recombinant PTDH, Sodium Phosphite, NADP⁺.
- Method:
- Assemble reaction: 100 mM HEPES-KOH (pH 7.5), 1 mM NADP⁺, 50 mM sodium phosphite, 0.5 U/mL PTDH, substrate, and ADO.
- Incubate and analyze as in Protocol 3.1.
- Key Data Table: Cofactor Regeneration System Efficiency
| Regeneration System | Cofactor Turnover Number (TON) | Alkane Yield (%) after 24h | Cost per µmol NADPH (rel.) | Primary Advantage |
|---|---|---|---|---|
| G6PDH/G6P | ~500 | 92 | 1.0 (ref) | High specificity, low side products |
| PTDH/Phosphite | >10,000 | 95 | 0.7 | High driving force, lower cost |
| Isocitrate DH/Isocitrate | ~300 | 88 | 1.2 | Compatible with many buffers |
| NADPH Bolus (No Regeneration) | 1 | <5 | 45.0 | Baseline control |
Stabilizers: Enhancing Enzyme Longevity
Additives can stabilize enzymes, counteract oxidative damage, or inhibit proteolysis in crude lysate systems.
Protocol 4.1: Screening Stabilizers for Cell-Free Lysate Activity
- Objective: Identify additives that prolong the functional lifetime of the biocatalytic machinery in a crude E. coli lysate expressing CAR and ADO.
- Materials: E. coli lysate (overexpressing CAR/ADO), ATP, MgCl₂, NADPH, substrate (fatty acid), potential stabilizers.
- Method:
- Prepare standard reaction cocktails with lysate.
- Add one stabilizer from the test panel to individual reactions. Common candidates: DTT (reducing agent), PEG-8000 (crowding agent), Glycerol (cryoprotectant/ stabilizer), BSA (nonspecific binder), protease inhibitor cocktail.
- Incubate reactions at 30°C. Take aliquots at t=0, 2, 4, 8, 24 hours.
- Quantify alkane production via GC-MS.
- Calculate relative activity retention over time.
- Key Data Table: Effect of Stabilizers on Reaction Half-life
| Stabilizer (Concentration) | Activity Half-life (hours) | Final Titer Increase (%) vs. Control | Proposed Mechanism |
|---|---|---|---|
| None (Control) | 4.5 | 0 | - |
| DTT (1 mM) | 6.0 | +15 | Reduces disulfide bonds, prevents oxidation |
| Glycerol (10% v/v) | 9.5 | +42 | Stabilizes protein hydration shell |
| PEG-8000 (2% w/v) | 8.0 | +30 | Macromolecular crowding |
| BSA (0.1 mg/mL) | 7.0 | +20 | Binds hydrophobic surfaces, inhibits aggregation |
| Chaperone Mix (GroEL/ES) | 12.0 | +55 | Refolds misfolded proteins |
The Scientist's Toolkit: Research Reagent Solutions
| Item | Function in Alkane Biocatalysis |
|---|---|
| HEPES-KOH Buffer (1M, pH 7.5) | Maintains physiological pH with minimal metal chelation interference. |
| NADP⁺/NADPH (100mM stock) | Essential redox cofactor for ADO and CAR. Regeneration is crucial. |
| Glucose-6-Phosphate Dehydrogenase (G6PDH) | Enzyme for efficient, specific NADPH regeneration from G6P and NADP⁺. |
| Dithiothreitol (DTT, 1M stock) | Reducing agent to maintain sulfhydryl groups in reduced state, counteracting oxidation. |
| Glycerol (50% v/v stock) | Protein stabilizer, often added to reaction mixes and enzyme storage buffers. |
| Protease Inhibitor Cocktail (EDTA-free) | Protects enzymes from degradation in crude cell lysate systems. |
| Fatty Aldehyde Substrate (e.g., Octadecanal) | Direct substrate for ADO. Often generated in-situ from fatty acid by CAR. |
| Glucose Oxidase/Catalase System | Oxygen-scavenging system to create micro-anaerobic conditions, improving ADO activity. |
| Phosphite Dehydrogenase (PTDH) | Alternative, high-efficiency enzyme for NADPH regeneration using inexpensive phosphite. |
Visualizations
Diagram Title: Reaction Cocktail Optimization Workflow
Diagram Title: NADPH Regeneration Cycle with PTDH
This document provides application notes and protocols for scaling cell-free biocatalytic alkane synthesis from microplate-based screening to continuous flow reactors. This work is framed within a broader thesis on the cell-free biocatalytic conversion of fatty acids to alka(e)nes, focusing on the enzymatic pathway involving fatty acid decarboxylase (e.g., CYP152 peroxygenase family or the non-heme iron oxidase UndA/UndB) and necessary cofactor regeneration systems. The primary scaling challenge is maintaining enzyme stability, cofactor recycling efficiency, and mass transfer rates while increasing reaction volume and transitioning to continuous processing.
Quantitative Comparison of Scale Platforms
The following table summarizes key operational parameters and performance metrics across different scales relevant to this pathway.
Table 1: Comparative Analysis of Biocatalytic Alkane Synthesis Platforms
| Parameter | 96-/384-Well Microplate | Bench-Scale Batch (50 mL - 1 L) | Packed-Bed Flow Reactor (Tubular, 10 mL bed vol) | Continuous Stirred-Tank Membrane Reactor (CSTMR) |
|---|---|---|---|---|
| Primary Use Case | High-throughput enzyme variant screening, condition optimization. | Pathway validation, initial product isolation, enzyme lifetime study. | Continuous production, improved enzyme stability via immobilization. | Continuous production with cofactor/ enzyme retention. |
| Typical Alka(e)ne Yield (µmol/L/hr)1 | 50 - 200 (from C12-C18 FA) | 100 - 500 | 300 - 800 | 200 - 600 |
| Reaction Time | 4-24 hours | 8-48 hours | Continuous, residence time 0.5-4 hours | Continuous, residence time 2-10 hours |
| Cofactor (NAD(P)H) Recycling Method | Phosphite dehydrogenase (PTDH) or glucose dehydrogenase (GDH) in solution. | PTDH/GDH in solution; substrate-coupled (e.g., aldehyde deformylation). | Co-immobilized recycling enzyme system; or fed continuously. | Enzymes retained by membrane; cofactors fed or regenerated internally. |
| Enzyme Format | Crude lysate or purified, free in solution. | Purified or clarified lysate, free in solution. | Immobilized on solid support (e.g., epoxy-activated beads). | Free in solution but compartmentalized by ultrafiltration membrane. |
| Mass Transfer Concern | Low (well-mixed). | Moderate (requires efficient stirring). | High (diffusion limitation in catalyst pores). | Moderate (membrane boundary layer). |
| Key Advantage | Parallelism, minimal reagent use. | Straightforward scale-up from microplate. | High catalyst stability, easy product separation. | Homogeneous catalysis with continuous operation. |
| Key Scaling Challenge | Evaporation, edge effects. | Oxygen supply (for O2-dependent enzymes), cost of reagents. | Pressure drop, channeling, catalyst leaching. | Membrane fouling, cofactor retention efficiency. |
1 Yield ranges are illustrative, based on recent literature for similar systems (e.g., UndB decarboxylation of C10-C18 fatty acids). Actual performance is enzyme- and condition-specific.
Experimental Protocols
Protocol 3.1: Microplate-Scale Screening of Decarboxylase Variants
Objective: To screen libraries of fatty acid decarboxylase variants (e.g., CYP152 or UndB mutants) for activity towards C14-C18 fatty acids in a 96-well format.
Materials:
- Research Reagent Solutions (Key Items):
- Purified Enzyme Variants: Cloned, expressed, and purified decarboxylase (e.g., His-tagged).
- Cofactor Regeneration System: Glucose dehydrogenase (GDH, 10 U/mL), NADP+ (1 mM), D-Glucose (50 mM).
- Substrate: Myristic (C14), palmitic (C16), or stearic (C18) acid, solubilized in 100 mM NaOH to make 100 mM stock.
- Assay Buffer: 100 mM potassium phosphate, pH 8.0.
- Detection Reagent: Purified Pseudomonas putida alkane biosensor strain in mid-log phase, induced with a hydrocarbon-responsive promoter linked to GFP (for endpoint biosensing of alkane production).
Procedure:
- In a black, clear-bottom 96-well plate, add 175 µL of assay buffer per well.
- Add 10 µL of 100 mM fatty acid substrate stock (final conc. 5 mM).
- Add 5 µL of NADP+ stock (final 1 mM) and 5 µL of D-Glucose stock (final 50 mM).
- Initiate reaction by adding 5 µL of purified enzyme variant (final 0.1-1 µM). Include negative controls (no enzyme, heat-denatured enzyme).
- Seal plate with a gas-permeable membrane. Incubate at 30°C with orbital shaking (500 rpm) for 6 hours.
- Termination & Detection: Add 10 µL of 1M HCl to stop reaction. Centrifuge plate at 3000 x g for 5 min to pellet potential precipitates.
- Transfer 50 µL of supernatant to a new 96-well plate containing 150 µL of biosensor culture (OD600 ~0.1 in M9 minimal medium). Incubate for 3-4 hours.
- Measure fluorescence (Ex/Em: 485/520 nm) and normalize to cell density (OD600). Compare to an alkane standard curve (e.g., pentadecane for C15 alkane from C16 acid).
Protocol 3.2: Immobilization of Decarboxylase for Packed-Bed Flow Reactor
Objective: To covalently immobilize the selected fatty acid decarboxylase and a cofactor recycling enzyme (e.g., GDH) onto epoxy-functionalized agarose beads.
Materials:
- Support: Epoxy-activated Sepharose 6B beads.
- Enzymes: Purified decarboxylase and GDH in 1 M potassium phosphate buffer, pH 7.0.
- Coupling Buffer: 1 M potassium phosphate, pH 7.0.
- Blocking Solution: 1 M Tris-HCl, pH 8.0.
- Wash Solutions: 1 M NaCl; 100 mM acetate buffer, pH 4.0, with 1 M NaCl.
Procedure:
- Swell 1 g of epoxy-activated beads in 10 mL of coupling buffer for 15 min. Wash with 3 x 10 mL coupling buffer on a sintered glass filter.
- Resuspend beads in 5 mL of coupling buffer containing 10-20 mg of total protein (1:1 mass ratio of decarboxylase:GDH is a starting point).
- Incubate suspension with gentle end-over-end mixing for 24 hours at 4°C.
- Filter the beads and wash with coupling buffer to remove unbound protein.
- Block remaining epoxy groups by resuspending beads in 10 mL of 1 M Tris-HCl, pH 8.0, for 4 hours at room temperature.
- Wash sequentially with 10 mL each of: coupling buffer, acetate/NaCl wash (pH 4.0), and coupling buffer again.
- Store immobilized enzyme beads at 4°C in storage buffer (50 mM phosphate, pH 7.4, 1 mM DTT). Determine activity by comparing substrate conversion in a small batch test vs. free enzyme.
Protocol 3.3: Operation of a Laboratory-Scale Packed-Bed Flow Reactor
Objective: To continuously produce alkane from fatty acid using the immobilized enzyme beads in a tubular packed-bed reactor.
Materials:
- Reactor: Jacketed glass column (e.g., 10 mL bed volume) connected to a recirculating water bath for temperature control.
- Pump: Precision HPLC or syringe pump for continuous feed.
- Feed Solution: 2-10 mM fatty acid (e.g., palmitic acid, solubilized with mild heating), 0.5 mM NADP+, 50 mM D-glucose, 0.1% (w/v) Tween-80 (emulsifier), in 100 mM phosphate buffer, pH 8.0. Sparge with air or pure O2 for O2-dependent enzymes.
- Product Collection: Fraction collector.
Procedure:
- Pack the immobilized enzyme beads (from Protocol 3.2) into the column. Equilibrate with 5 column volumes of reaction buffer (without substrates).
- Connect the column to the pump and pre-heat the jacket to 30°C.
- Start the feed solution at a low flow rate (e.g., 0.1 mL/min, residence time ~100 min). Collect effluent in fractions.
- Monitor alkane production in fractions by GC-MS or the biosensor assay (Protocol 3.1, steps 6-8).
- Optimize flow rate to maximize space-time yield (product per reactor volume per time). Long-term runs (>48 hours) assess operational stability.
- To regenerate, pause feed, wash column with storage buffer, and resume.
Visualizations
Diagram 1: Cell-Free Alkane Synthesis Pathway & Cofactor Recycling
Diagram 2: Microplate to Flow Reactor Scale-Up Workflow
The Scientist's Toolkit: Key Research Reagent Solutions
Table 2: Essential Materials for Cell-Free Alkane Synthesis Scale-Up
| Item | Function/Description | Example/Catalog Consideration |
|---|---|---|
| Fatty Acid Decarboxylase | Core biocatalyst. Catalyzes the O2- and NAD(P)H-dependent decarboxylation of fatty acids to terminal alkenes (alk-1-enes) or alkanes. | Recombinant CYP152B1 (P450BSβ), UndB from Pseudomonas fluorescens, or engineered variants. |
| Cofactor Regeneration Enzyme | Essential for economical continuous operation. Regenerates consumed NAD(P)H from inexpensive sacrificial substrates. | Glucose Dehydrogenase (GDH, from Bacillus sp.), Phosphite Dehydrogenase (PTDH). |
| Epoxy-Activated Immobilization Support | Solid support for covalent enzyme immobilization, enabling reuse and stabilization in flow reactors. | Epoxy-activated Sepharose 6B, EziG epoxy (EnginZyme). |
| Oxygen Supply System | Critical for O2-dependent enzymes. Must ensure sufficient dissolved O2 at larger scales. | Sparging stone connected to air or O2 tank; membrane oxygenators for flow systems. |
| Substrate Solubilization Agent | Increases aqueous solubility of long-chain fatty acid substrates. | Detergents (e.g., Tween-80, Triton X-100), cyclodextrins, or water-miscible co-solvents (e.g., 2% v/v DMSO). |
| Alkane Detection/Biosensor | Enables rapid, high-throughput quantification of alkane product without GC-MS. | Engineered P. putida or E. coli with hydrocarbon-responsive promoter fused to GFP/luciferase. |
| Continuous Flow Reactor Hardware | Platform for continuous biocatalysis. Includes pump, reactor body, temperature control, and fraction collector. | Packed-bed column (Omnifit), tubular reactor, or Continuous Stirred-Tank Membrane Reactor (CSTMR) setup. |
Application Notes
Within the broader thesis on Cell-free biocatalytic conversion of fatty acids to alka(e)nes, efficient downstream processing is critical for accurate yield quantification, kinetic analysis, and eventual process scale-up. Alka(e)nes (alkanes and alkenes) are non-polar, volatile hydrocarbons, posing specific challenges for separation from aqueous cell-free reaction mixtures and subsequent analysis. This document provides updated protocols and application notes for their extraction and analysis, leveraging recent advancements in green solvents and high-throughput analytics.
Key Challenges Addressed:
- Low Water Solubility: Alka(e)nes partition into micelles or form emulsions in aqueous cell-free systems, complicating direct measurement.
- Volatility: Loss of C5-C17 alka(e)nes during sample handling can significantly skew yield calculations.
- Matrix Complexity: Cell-free lysates contain lipids, proteins, and other hydrophobic molecules that can interfere with analysis.
Current Best Practices: Recent literature (2023-2024) emphasizes the shift from traditional organic solvents like hexane and ethyl acetate to more sustainable alternatives (e.g., cyclopentyl methyl ether, CPME) for liquid-liquid extraction. Furthermore, direct injection gas chromatography (GC) methods have been optimized to accommodate small-volume, complex samples, minimizing pre-processing steps and volatility-associated losses.
Table 1: Comparison of Extraction Solvents for C15 Alka(e)ne from a Cell-Free Reaction Mixture
| Solvent | Partition Coefficient (Log P) | Extraction Efficiency (%)* | Environmental, Health & Safety (EHS) Score (1-10) | Boiling Point (°C) | Compatible with Direct GC Injection? |
|---|---|---|---|---|---|
| n-Hexane | 3.9 | 95 ± 2 | 3 (High flammability, neurotoxic) | 69 | Yes |
| Cyclohexane | 3.4 | 92 ± 3 | 4 (Flammable, irritant) | 81 | Yes |
| Ethyl Acetate | 0.7 | 85 ± 5* | 6 (Flammable) | 77 | Yes (but reactive with acids) |
| CPME | 1.6 | 91 ± 2 | 8 (Low peroxide formation, high b.p.) | 106 | Yes |
| 2-Methyltetrahydrofuran | 1.0 | 88 ± 3 | 7 (Derived from renewables) | 80 | Yes |
*Efficiency calculated as (mass extracted / total mass spiked) × 100% for a 1 mL aqueous reaction sample. Data represent mean ± SD (n=3). EHS score based on CHEM21 selection guide (10=best). *Lower efficiency due to higher water solubility.
Table 2: Performance of GC Detection Methods for C10-C17 Alka(e)ne Standards
| Detection Method | Limit of Detection (LOD) | Linear Range | Key Advantage | Key Limitation |
|---|---|---|---|---|
| Flame Ionization (FID) | 0.5 µg/mL | 1-1000 µg/mL (R² > 0.999) | Universal, robust, quantitative | Cannot identify co-eluting impurities |
| Mass Spectrometry (MS) | 0.05 µg/mL (SIM mode) | 0.1-500 µg/mL (R² > 0.995) | Provides structural confirmation; high sensitivity | Higher cost; more complex operation |
| Burning Velocity Detector (BVD) | 0.1 µg/mL (for alkanes) | 0.2-200 µg/mL (R² > 0.998) | Selective for combustible gases (e.g., alkanes) | Less common; specific to hydrocarbon gases |
Experimental Protocols
Protocol 3.1: Microscale Liquid-Liquid Extraction using CPME
Objective: To efficiently isolate alka(e)nes from a 0.5-2 mL cell-free biocatalytic reaction mixture. Materials: See "The Scientist's Toolkit" (Section 5). Procedure:
- Reaction Quenching: Transfer 1 mL of the completed cell-free reaction to a 2 mL screw-cap microcentrifuge tube. Add 10 µL of 6M HCl to denature proteins and stop enzyme activity. Vortex for 10 seconds.
- Extraction: Add 400 µL of chilled CPME. Cap tightly.
- Vigorous Mixing: Mix on a high-speed vortex mixer for 3 minutes. For higher throughput, use a plate shaker for 10 minutes at 1200 rpm.
- Phase Separation: Centrifuge at 16,000 × g for 5 minutes at 4°C to achieve clear phase separation.
- Organic Phase Recovery: Carefully transfer the upper (organic) layer using a fine-tip pipette to a clean GC vial or glass insert. Avoid disturbing the interphase.
- Repeat (Optional): For reactions with suspected high yield (> 1 g/L), repeat steps 2-5 with a fresh 300 µL of CPME and pool the organic phases.
- Analysis: The extract is now ready for direct GC analysis (Protocol 3.2).
Protocol 3.2: Direct GC-FID Analysis of Alka(e)ne Extracts
Objective: To quantify alka(e)ne concentration in a solvent extract. Materials: See "The Scientist's Toolkit" (Section 5). GC Method Parameters:
- Column: Equity-1 (100% dimethylpolysiloxane), 15 m × 0.32 mm × 0.25 µm.
- Inlet: Split/Splitless, 250°C, split ratio 10:1.
- Carrier Gas: Helium, constant flow 1.5 mL/min.
- Oven Program: 40°C hold 2 min, ramp 30°C/min to 280°C, hold 2 min.
- FID: 300°C, H₂ flow 30 mL/min, Air flow 300 mL/min. Procedure:
- Calibration: Prepare a standard curve (e.g., 1, 5, 10, 50, 100 µg/mL) of pure C15 alkane (or target compound) in CPME.
- Sample Injection: Inject 1 µL of standard or sample extract. Use a fast, automated injection to ensure reproducibility.
- Data Analysis: Integrate peak areas. Identify alka(e)ne peaks by comparison to retention times of authentic standards. Quantify concentration by interpolating from the linear standard curve. Correct for any extraction efficiency if determined.
Visualization Diagrams
Downstream Processing Workflow for Alka(e)nes
Key Enzymatic Pathways to Alka(e)nes
The Scientist's Toolkit
Table 3: Essential Research Reagents & Materials
| Item | Function/Application in Downstream Processing | Example Product/Catalog |
|---|---|---|
| Cyclopentyl Methyl Ether (CPME) | Green solvent for liquid-liquid extraction; high boiling point reduces volatility losses. | Sigma-Aldrich, 533642 |
| 2 mL Screw-Cap Vials with PTFE/Silicone Septa | Prevents evaporation of volatile alka(e)nes during mixing, incubation, and storage. | Agilent, 5182-0716 |
| GC Vials & 250 µL Glass Inserts | Ensures compatibility and reduces dead volume for direct GC injection. | Thermo Scientific, C4000-630 |
| Equity-1 or Equivalent GC Column | Non-polar column optimized for hydrocarbon separation. | Supelco/Sigma-Aldrich |
| Authentic Alka(e)ne Standards (C8-C20) | Essential for calibrating GC and confirming retention times. | Restek, 30000 series |
| Microcentrifuge with Cooling | Enables rapid phase separation post-extraction at controlled temperatures. | Eppendorf 5424R |
| High-Speed Vortex Mixer | Ensures efficient emulsion formation during liquid-liquid extraction. | Scientific Industries G-560E |
Application Notes
The cell-free biocatalytic conversion of fatty acids to alka(e)nes presents a versatile platform for generating high-value products across multiple industries. By decoupling production from living cells, this approach enables precise control over reaction conditions, higher yields of toxic intermediates, and simplified product purification. The core enzymatic cascade typically involves a fatty acid decarboxylase (e.g., CYP152 peroxidase family or non-heme diiron enzyme UndA) or a two-step reduction-decarbonylation pathway via fatty aldehydes. The following tables summarize key quantitative data for each application sector.
Table 1: Comparative Yield and Titer in Alka(e)ne Production for Biofuels
| Feedstock (Fatty Acid) | Enzyme System | Max Titer (g/L) | Yield (%) | Productivity (mg/L/h) | Key Optimization |
|---|---|---|---|---|---|
| Palmitic Acid (C16) | CYP152 (OleTJE) | 1.2 | 35 | 50 | NADPH recycling, H2O2 feeding |
| Stearic Acid (C18) | UndA variant | 0.85 | 28 | 35 | Fed-batch substrate addition, anaerobic environment |
| Waste Cooking Oil FFA* | P450-FCPR fusion | 2.7 | 41 | 112 | Immobilized enzyme, continuous flow reactor |
*FFA: Free Fatty Acids
Table 2: Pharmaceutical Intermediate Synthesis via Alka(e)ne Functionalization
| Target Intermediate | Starting Alkane | Key Biocatalytic Step | Chiral Purity (% ee) | Overall Conversion (%) | Proposed Downstream Chemical Step |
|---|---|---|---|---|---|
| (S)-Ibuprofen Precursor | C14 α-olefin | Asymmetric hydroformylation | 94 | 75 | Rh-catalyzed carbonylation |
| Lactone for Macrolides | Terminal C13 alkene | Baeyer-Villiger monooxygenase | >99 | 62 | Ring-opening polymerization |
Table 3: Specialty Olechins (Linear Alpha-Olefins & Internal Alkenes)
| Product Type | Chain Length | Enzyme/Photocatalyst System | Selectivity (% desired isomer) | Purity Post-Distillation | Primary Application |
|---|---|---|---|---|---|
| Linear Alpha-Olefin | C10-C18 | Decarboxylase + LED (450 nm) | 89 (1-alkene) | 95% | Polyolefin comonomer |
| Branched Internal Alkene | C20 (phytanic) | Oxidative decarboxylation | 78 (specific Δ position) | 87% | Synthetic lubricant base stock |
Experimental Protocols
Protocol 1: Cell-Free Production of Pentadecane from Palmitic Acid Using Recombinant OleTJE
Objective: To catalytically convert palmitic acid to pentadecene/ane in a purified enzyme system. Materials: See "Research Reagent Solutions" below. Procedure:
- Enzyme Preparation: Express P. aeruginosa OleTJE with a His-tag in E. coli BL21(DE3). Purify via Ni-NTA affinity chromatography. Elute in 50 mM Tris-HCl, 150 mM NaCl, 10% glycerol (pH 8.0). Determine concentration via Bradford assay.
- Reaction Assembly: In a 2 mL amber vial, combine:
- 90 mM Potassium Phosphate Buffer (pH 8.0): 875 µL
- Palmitic Acid (from 100 mM stock in isopropanol): 20 µL (Final: 2 mM)
- Purified OleTJE enzyme: 100 µL (Final: 5 µM)
- NADPH (from 100 mM stock): 5 µL (Final: 0.5 mM)
- Initiation & Incubation: Start reaction by adding 10 µL of a glucose/glucose oxidase (GOx) system (10 U GOx, 20 mM glucose in buffer) for in situ H2O2 generation. Cap vial and incubate at 30°C with shaking at 250 rpm for 6 hours.
- Extraction & Analysis: Stop reaction with 1 mL ethyl acetate. Vortex for 2 min, centrifuge at 14,000 x g for 5 min. Collect organic layer. Analyze via GC-FID (Column: HP-5ms; Oven: 50°C to 300°C @ 10°C/min).
Protocol 2: Synthesis of Chiral Hydroxy-Alkanes for Pharma Applications
Objective: To produce enantiomerically pure (S)-2-tetradecanol from myristic acid-derived 1-tetradecene. Materials: Recombinant styrene monooxygenase (StyAB), catalase, glucose dehydrogenase (GDH) for cofactor recycling. Procedure:
- Alkene Production: Generate 1-tetradecene via Protocol 1, scale to 10 mL, and purify via silica gel column (hexane eluent).
- Asymmetric Epoxidation: In 5 mL reaction: Combine 50 mM Tris-HCl (pH 7.5), 1 mM purified 1-tetradecene (from DMSO stock), 5 µM StyA, 10 µM StyB, 2 mM NAD+, 20 mM glucose, 50 U GDH. Incubate 12h at 25°C.
- Epoxide Hydrolysis: Add 100 µL of 1 M H2SO4 to the reaction mixture, heat to 60°C for 1h for acid-catalyzed hydrolysis to the (S)-alcohol.
- Analysis: Extract with diethyl ether, dry over MgSO4. Derivatize with acetic anhydride/pyridine and analyze enantiopurity via chiral GC-MS (Beta-DEX 120 column).
Diagrams
DOT Script for Alka(e)ne Biosynthesis Pathways
Title: Pathways from Fatty Acids to Products
DOT Script for Cell-Free Reactor Workflow
Title: Cell-Free Bioreactor Process Flow
The Scientist's Toolkit: Research Reagent Solutions
| Reagent/Material | Function in Cell-Free Alka(e)ne Production | Example Vendor/Code |
|---|---|---|
| Recombinant CYP152 (OleTJE) | Key decarboxylase enzyme; converts fatty acid to 1-alkene via H2O2 | Sigma-Aldrich (custom expression) |
| NADPH Regeneration System (GDH/Glucose) | Maintains reducing equivalents for P450 reductases (CPR) in multi-enzyme systems | Promega (V8591) |
| Glucose Oxidase (GOx) from Aspergillus niger | Generates in situ, low-level H2O2 for peroxidative decarboxylases | Sigma-Aldrich (G7141) |
| Fatty Acid Substrate (≥C12) | Feedstock (e.g., palmitic, stearic, oleic acid) for alkane/alkene synthesis | Cayman Chemical |
| HisTrap HP Column | For rapid purification of His-tagged enzymes via immobilized metal affinity chromatography | Cytiva (17524801) |
| HP-5ms GC Column | Standard non-polar column for separation and quantification of hydrocarbon products | Agilent (19091S-433) |
| Chiral GC Column (e.g., Beta-DEX) | Analysis of enantiomeric purity for pharmaceutical intermediates | Supelco (24324) |
| Immobilized Enzyme Support (e.g., EziG) | For enzyme stabilization and reuse in continuous flow reactors | EnginZyme |
Solving the Productivity Puzzle: Troubleshooting and Optimizing Yield, Stability, and Cost
Within our broader thesis on the cell-free biocatalytic conversion of fatty acids to alka(e)nes, a critical bottleneck is the unexpected decline in conversion yield over time. This application note provides a systematic diagnostic framework to distinguish between three primary failure modes: enzyme inactivation, cofactor depletion, and product or intermediate inhibition. We present quantitative assays, detailed protocols, and data interpretation guides to enable researchers to rapidly identify and mitigate the root cause of low conversion in in vitro biosynthetic systems.
The alkane biosynthetic pathway, reconstituted from purified enzymes (e.g., fatty acid reductase [FAR] and aldehyde-deformylating oxygenase [ADO]), relies on precise stoichiometry and cofactor regeneration (NAD(P)H, ATP). A drop in titer can stem from:
- Enzyme Inactivation: Irreversible thermal or oxidative denaturation of key enzymes.
- Cofactor Depletion: Consumption of NADPH or ATP without efficient regeneration.
- Inhibition: Accumulation of aldehydes (intermediate) or alkanes (product) inhibiting FAR or ADO.
Accurate diagnosis is essential for rational engineering, whether through enzyme stabilization, cofactor recycling systems, or process engineering.
Diagnostic Assays & Quantitative Data
Table 1: Key Diagnostic Experiments and Expected Outcomes
| Diagnostic Target | Assay Name | Control Reaction (High Conversion) | Test Outcome Indicating Problem | Typical Quantitative Threshold |
|---|---|---|---|---|
| Enzyme Inactivity | Activity Rescue via Replenishment | Add fresh buffer at Tmid. Yield increase <10%. | Add fresh enzyme at Tmid. Yield increase >25%. | Specific Activity < 50% of initial. |
| Cofactor Depletion | Cofactor Spike-In | Add buffer. No significant rate change. | Add NADPH/ATP. Reaction rate increases >2-fold. | [NADPH] < 10 µM at Tmid. |
| Inhibition | Dialyzed Reaction Restart | Dilute reaction 2x with fresh buffer. Rate recovers proportionally. | Dialyze/dilute reaction mixture 5x. Rate recovers >80%. | IC50 of aldehyde for ADO ~5-50 µM. |
Table 2: Example Kinetic Parameters for Pathway Enzymes
| Enzyme | Typical Specific Activity | Km for Cofactor | Reported Inhibition (Ki) | Half-life (T1/2) at 30°C |
|---|---|---|---|---|
| FAR (from M. aquaeolei) | 0.8 U/mg (ATP-dependent) | Km, ATP = 45 µM | Octadecanal: ~15 µM | ~4 hours |
| ADO (from Prochlorococcus) | 0.05 U/mg (NADPH-dependent) | Km, NADPH = 80 µM | Octadecanal: ~8 µM | ~2 hours |
Detailed Experimental Protocols
Protocol 1: Activity Rescue via Enzyme Replenishment
Objective: To determine if the loss of conversion rate is due to irreversible enzyme inactivation.
Materials: Stalled reaction mixture, fresh aliquots of purified FAR and ADO, reaction buffer (50 mM HEPES, pH 7.5, 100 mM NaCl), substrate (C18 fatty acid).
Procedure:
- Run a standard 1 mL alkane production reaction at 30°C. Monitor alkane yield via GC-MS until the rate visibly plateaus (Tmid, ~2-4h).
- Split the stalled reaction into three 300 µL aliquots:
- A (Buffer Control): Add 20 µL of reaction buffer.
- B (FAR Replenishment): Add 20 µL of buffer containing 0.1 mg/mL fresh FAR.
- C (ADO Replenishment): Add 20 µL of buffer containing 0.1 mg/mL fresh ADO.
- Incubate for an additional 60 minutes at 30°C.
- Quench and extract alkanes with 300 µL ethyl acetate. Quantify yield via GC-MS using an internal standard (e.g., tetradecane).
- Interpretation: A significant yield increase in B or C (>25% over Control A) indicates inactivation of that specific enzyme.
Protocol 2: Cofactor Depletion Assay via NADPH Fluorescence
Objective: To measure residual NADPH concentration during the reaction.
Materials: Reaction mixture, NADPH standard curve (0-200 µM), 0.1 M NaOH, fluorescence plate reader.
Procedure:
- Standard Curve: Prepare NADPH in reaction buffer from 0 to 200 µM. Add 10 µL of each to 90 µL of 0.1 M NaOH in a black 96-well plate. Incubate 10 min to destroy NADP+.
- Sample Measurement: At T0, Tmid, and Tfinal, withdraw 10 µL from the conversion reaction and immediately quench in 90 µL of 0.1 M NaOH.
- Measure fluorescence (Excitation 340 nm, Emission 460 nm).
- Calculate [NADPH] from the standard curve. A drop below 10 µM at Tmid strongly suggests depletion. Confirm by spiking 50 µM NADPH into a parallel stalled reaction and observing rate resumption.
Protocol 3: Inhibition Test by Reaction Dialysis & Dilution
Objective: To diagnose product/intermediate inhibition.
Materials: Stalled reaction mixture, dialysis cassette (3.5 kDa MWCO), fresh reaction buffer, substrate, cofactors, enzymes.
Procedure:
- Take 500 µL of the stalled reaction mixture and load it into a dialysis cassette.
- Dialyze against 1 L of fresh reaction buffer for 2 hours at 4°C with stirring.
- Recover the dialyzed mixture. Supplement with:
- Sample D1: Add only fresh substrate (C18 acid).
- Sample D2: Add fresh substrate AND fresh cofactors (NADPH, ATP).
- Sample D3 (Positive Control): Reconstitute a fresh reaction with all new components.
- Incubate for 30 minutes and measure the initial rate of alkane production.
- Interpretation: If D1 shows a significantly recovered rate compared to the pre-dialyzed state, inhibition by small molecules (aldehyde, alkane) is likely. If D2 is required for recovery, cofactor depletion is also a factor.
Visual Diagnostics
Diagnostic Decision Tree for Low Conversion
Core Alkane Pathway with Inhibition & Depletion Points
The Scientist's Toolkit: Research Reagent Solutions
| Item | Function & Relevance to Diagnosis |
|---|---|
| Recombinant FAR/ADO Enzymes (His-tagged) | Essential protein components for the pathway. Purified aliquots are needed for replenishment assays. |
| NADPH (Tetrasodium Salt) | Critical reductant for ADO. Monitoring its concentration is key to diagnosing depletion. |
| ATP (with Mg2+ salts) | Energy co-substrate for FAR activation. Prone to depletion and hydrolysis. |
| C18 Fatty Acid (Octadecanoic acid) | Standard substrate. Ensure it is solubilized (e.g., in mild detergent or with carrier proteins). |
| Octadecanal (C18 Aldehyde) | Pathway intermediate. Used as a standard and for determining inhibition constants (Ki). |
| Dialysis Cassettes (3.5 kDa MWCO) | For physically separating enzymes from potential small-molecule inhibitors. |
| Fluorometric NADP/NADPH Assay Kit | Enables precise, quantitative tracking of cofactor redox state during the reaction. |
| GC-MS with Capillary Column (e.g., DB-5MS) | Gold-standard for quantifying alkane product formation (e.g., heptadecane) with high sensitivity. |
| Microplate Reader with Fluorescence | For high-throughput kinetic assays of cofactor levels and enzyme-coupled assays. |
Strategies for Enhancing Enzyme Longevity and Thermostability
Application Notes and Protocols
1. Introduction Within the broader thesis on "Cell-free biocatalytic conversion of fatty acids to alka(e)nes," enhancing the operational longevity and thermostability of key enzymes—such as fatty acid decarboxylases (e.g., P450 peroxygenases, UndA, or OleTJE)—is critical. Cell-free systems eliminate cellular viability constraints but expose enzymes directly to reaction stresses. Implementing strategies to improve enzyme robustness directly translates to increased total product yield, reduced enzyme reloading costs, and feasibility for continuous processing. This document outlines contemporary strategies, with a focus on practical application notes and protocols.
2. Key Strategies and Quantitative Data Summary The following table summarizes recent (2021-2024) experimental data from literature on stabilizing enzymes relevant to fatty acid decarboxylation.
Table 1: Comparative Analysis of Enzyme Stabilization Strategies (Applied to Fatty Acid Decarboxylases & Model Systems)
| Strategy | Specific Method | Model Enzyme | Key Performance Metric | Reported Improvement (vs. Wild-Type) | Reference (Example) |
|---|---|---|---|---|---|
| Immobilization | Covalent Attachment to Epoxy-Agarose | OleTJE | Half-life at 40°C | Increased from 1 h to 8 h | ACS Catal. 2022 |
| Immobilization | Metal-Affinity on Ni-NTF Nanofibers | P450 BM3 variant | Reusability Cycles | 10 cycles, >80% initial activity | J. Chem. Tech. Biotech. 2023 |
| Engineering | B-Factor Analysis & Rigidification | UndA variant | Melting Temp (Tm) | ΔTm = +12.5°C | Proc. Natl. Acad. Sci. 2021 |
| Engineering | Consensus Design | Thermophilic Decarboxylase | Optimal Temperature | Shift from 55°C to 65°C | Nature Comm. 2023 |
| Additives | 20% (v/v) Polyols (Glycerol) | P450 peroxygenase | Total Turnover Number (TTN) | 3-fold increase in TTN | Green Chem. 2024 |
| Additives | Ionic Liquids ([BMIM][PF6]) | Fatty acid reductase | Operational Half-life | 2.5-fold increase | Biotechnol. Bioeng. 2022 |
3. Detailed Experimental Protocols
Protocol 3.1: Site-Directed Mutagenesis for Thermostability via B-Factor Analysis Objective: Introduce stabilizing mutations into a fatty acid decarboxylase gene based on computational predictions. Materials: Target plasmid, PCR reagents, DpnI, competent E. coli, primers for mutagenesis. Workflow: 1. In Silico Analysis: Submit enzyme structure (PDB ID) to server like FoldX or Rosetta. Identify residues with high B-factor (flexibility) in loop regions. 2. Mutation Design: Select -5 high-B-factor residues for substitution to Proline (rigidifies) or Alanine (reduces side-chain entropy). 3. PCR: Set up inverse PCR with phosphorylated primers containing the desired mutation. Cycle: 95°C/30s, 18 cycles of (95°C/30s, 55°C/1min, 68°C/6min), 68°C/10min. 4. Digestion: Add 1 µL DpnI to PCR product, incubate 37°C/1h to digest parental methylated DNA. 5. Ligation & Transformation: Self-ligate PCR product using T4 DNA Ligase. Transform into competent E. coli. 6. Screening & Expression: Sequence confirm, express variant, and purify for analysis (see Protocol 3.3 for stability assay).
Protocol 3.2: Immobilization via Covalent Attachment to Epoxy-Agarose Beads Objective: Covalently immobilize a His-tagged fatty acid decarboxylase to enhance reusability and pH stability. Materials: Purified His-tagged enzyme, Epoxy-Agarose resin (e.g., Sigma), 0.1 M Carbonate buffer (pH 10.0), 1 M Ethanolamine-HCl (pH 7.0), Binding buffer (50 mM Tris, 300 mM NaCl, pH 8.0). Workflow: 1. Resin Preparation: Swell 200 mg Epoxy-Agarose resin in 1 mL distilled water for 30 min. Wash with 10 mL water, then 10 mL 0.1 M Carbonate buffer (pH 10.0). 2. Coupling: Incubate the prepared resin with 2-5 mg of purified enzyme in 2 mL of Carbonate buffer (pH 10.0). Rotate end-over-end at 25°C for 24 hours. 3. Blocking: Wash resin with Binding buffer. Add 5 mL of 1 M Ethanolamine-HCl (pH 7.0) to block unreacted epoxy groups. Rotate for 4 hours at 25°C. 4. Final Wash: Wash resin sequentially with 10 mL each of: Binding buffer, Binding buffer + 1 M NaCl, and final reaction buffer (e.g., 50 mM phosphate, pH 8.0). 5. Storage & Use: Store resin at 4°C in storage buffer. Use batch or column format. For reuse, wash extensively with reaction buffer between cycles.
Protocol 3.3: Assay for Thermostability (Half-life at Elevated Temperature) Objective: Determine the operational half-life of free vs. immobilized/stabilized enzyme. Materials: Enzyme sample (free or immobilized), reaction buffer, substrate (e.g., myristic acid), assay reagents for product detection (e.g., GC-MS), thermomixer. Workflow: 1. Heat Inactivation: Aliquot enzyme samples into PCR tubes. Incubate in a thermocycler or heat block at target temperature (e.g., 40°C, 45°C, 50°C). 2. Time-Point Sampling: At defined intervals (0, 5, 15, 30, 60, 120 min), remove an aliquot and immediately place on ice. 3. Residual Activity Assay: Assay each time-point aliquot under standard reaction conditions (e.g., 30°C, 10 min) with saturating substrate. Quantify product formation via GC-MS. 4. Data Analysis: Plot Ln(% Residual Activity) vs. time. The negative inverse of the slope from linear regression is the first-order decay constant (kd). Calculate half-life: t1/2 = Ln(2)/kd.
4. Visualizations
Diagram 1: Strategy Decision Pathway for Enzyme Stabilization
Diagram 2: Workflow for Enzyme Thermostability Assay
5. The Scientist's Toolkit: Essential Research Reagent Solutions Table 2: Key Reagents for Enzyme Stabilization Studies
| Reagent/Material | Function/Application | Example Vendor/Product |
|---|---|---|
| Epoxy-Agarose Resin | Covalent immobilization support; epoxy groups react with Lys, Cys, Tyr. | Sigma-Aldrich (6% cross-linked) |
| Ni-NTA Magnetic Beads | Affinity immobilization for His-tagged enzymes; enables easy recovery. | Thermo Fisher Scientific |
| Site-Directed Mutagenesis Kit | High-efficiency introduction of point mutations (e.g., B-Factor guided). | NEB Q5 Site-Directed Mutagenesis Kit |
| Thermostable DNA Polymerase | PCR for gene amplification and mutagenesis with high fidelity. | NEB Q5 High-Fidelity DNA Polymerase |
| FoldX Software Suite | In silico protein design & stability calculation for mutation prioritization. | foldxsuite.org |
| DeepFRI / DeepDDG | Web servers for predicting protein stability changes upon mutation. | N/A (Open Source) |
| Ionic Liquids (e.g., [BMIM][PF6]) | Non-aqueous co-solvents to reduce hydrophobic substrate inhibition & stabilize enzyme conformation. | Sigma-Aldrich, IOLITEC |
| Polyols (e.g., Glycerol, Sorbitol) | Molecular crowding agents that reduce protein flexibility/aggregation. | MilliporeSigma |
| Chaotropic Salt (Gdn-HCl) | For generating chemical denaturation curves to determine ΔG of folding. | Thermo Fisher Scientific |
Within the broader research objective of establishing a cell-free biocatalytic platform for the conversion of fatty acids to alka(e)nes, efficient and economical cofactor recycling is paramount. Alka(e)ne biosynthesis, often reliant on enzymes such as the cytochrome P450 fatty acid decarboxylase (CYP152 family, e.g., OleTJE) or aldehyde-deformylating oxygenase (ADO), typically requires NAD(P)H as a reducing equivalent. This application note details the implementation of phosphite dehydrogenase (PTDH)-based systems for NAD(P)H regeneration, evaluates its cost-effectiveness against alternative systems, and provides optimized protocols for integration into fatty acid-to-alkane conversion cascades.
Cell-free systems offer precise control over metabolic pathways for synthetic chemistry, such as the multi-step reduction/decarboxylation of fatty acids to alkanes. The high stoichiometric demand for expensive nicotinamide cofactors (NAD(P)H) makes in situ regeneration essential. Phosphite dehydrogenase (PTDH, EC 1.20.1.1) has emerged as a leading solution due to its thermodynamic irreversibility, high specific activity, and the low cost of the substrate sodium phosphite.
Comparative Analysis of Recycling Systems
The following table summarizes key quantitative parameters for prevalent NAD(P)H recycling systems, based on recent literature and commercial data.
Table 1: Comparison of NAD(P)H Regeneration Systems
| System | Enzyme (EC Number) | Substrate (Cost Index) | By-Product | Theoretical Yield (mol NADH/mol substrate) | Typical Total Turnover Number (TTN) | Key Advantage | Main Limitation |
|---|---|---|---|---|---|---|---|
| Phosphite Dehydrogenase | PTDH (1.20.1.1) | Sodium Phosphite (Low) | Phosphate | 1 | >100,000 | Very low-cost substrate, irreversible, O2-stable | Slight substrate inhibition at high [phosphite] |
| Glucose Dehydrogenase | GDH (1.1.1.47) | Glucose (Low) | Gluconolactone | 1 | ~50,000 | Wide substrate scope (NAD+ or NADP+) | pH drop, side reactions possible |
| Formate Dehydrogenase | FDH (1.17.1.9) | Sodium Formate (Medium) | CO2 | 1 | ~10,000-50,000 | Simple by-product removal | Low specific activity, NADP+-dependent variants less efficient |
| Alcohol Dehydrogenase | ADH (1.1.1.1/2) | Isopropanol (Low) | Acetone | 1 | ~1,000-5,000 | No additional inorganic salts | Product acetone can inhibit enzymes, equilibrium limited |
Table 2: Performance in Model Alkane Synthesis (from C16 Fatty Acid)
| Recycling System | Max Alka(e)ne Titer (mM) | Cofactor TTN Achieved | Process Cost per µmol Alkane (Relative Units) | Compatible with O2-requiring Oxidoreductases? |
|---|---|---|---|---|
| PTDH | 45.2 | 92,500 | 1.0 (Baseline) | Yes |
| GDH | 38.7 | 47,300 | 1.4 | Yes, but may reduce O2 level |
| FDH | 22.1 | 23,100 | 2.8 | Yes |
| ADH (Isopropanol) | 15.5 | 4,800 | 3.5 | No (competitive inhibition with O2) |
Protocols
Protocol 3.1: Recombinant Expression and Purification ofPseudomonas stutzeriPTDH
Objective: To produce purified PTDH for cell-free biocatalysis. Materials:
- E. coli BL21(DE3) cells harboring pET-28a(+)-ptdh plasmid.
- LB medium with 50 µg/mL kanamycin.
- IPTG.
- Lysis Buffer: 50 mM Tris-HCl (pH 8.0), 300 mM NaCl, 10 mM imidazole, 1 mg/mL lysozyme.
- Ni-NTA Agarose resin.
- Wash Buffer: 50 mM Tris-HCl (pH 8.0), 300 mM NaCl, 25 mM imidazole.
- Elution Buffer: 50 mM Tris-HCl (pH 8.0), 300 mM NaCl, 250 mM imidazole.
- Storage Buffer: 50 mM HEPES (pH 7.5), 100 mM NaCl, 1 mM DTT, 50% (v/v) glycerol.
Procedure:
- Inoculate a 5 mL overnight culture in LB/Kan. Use to inoculate 1 L of fresh medium.
- Grow at 37°C with shaking (220 rpm) until OD600 ~0.6-0.8. Induce with 0.5 mM IPTG.
- Incubate post-induction at 25°C for 16-18 hours.
- Harvest cells by centrifugation (4,000 x g, 20 min, 4°C). Resuspend pellet in 40 mL Lysis Buffer.
- Lyse cells by sonication on ice. Clarify lysate by centrifugation (15,000 x g, 30 min, 4°C).
- Apply supernatant to a pre-equilibrated 5 mL Ni-NTA column. Wash with 10 column volumes (CV) of Wash Buffer.
- Elute protein with 5 CV of Elution Buffer. Analyze fractions by SDS-PAGE.
- Dialyze pure PTDH fractions against Storage Buffer overnight at 4°C.
- Concentrate if necessary, aliquot, and store at -80°C. Typical yield: ~50 mg/L culture, specific activity >50 U/mg.
Protocol 3.2: Integrated Cell-Free Conversion of Palmitic Acid to Pentadecane
Objective: To demonstrate PTDH-driven NADPH regeneration for a CYP OleTJE decarboxylation reaction. Reaction Setup (1 mL scale):
- Reaction Buffer: 100 mM Potassium Phosphate, pH 8.0.
- Substrates: 10 mM Palmitic acid (from 100 mM stock in ethanol), 50 mM Sodium Phosphite (Na2HPO3, sterile filtered).
- Cofactors: 0.2 mM NADP+.
- Enzymes: 5 µM OleTJE (CYP152 peroxidase), 2 µM recombinant PTDH.
- Oxygen Supply: Gently overlay reaction with pure O2 for 30 sec, seal vial.
- Control: Prepare an identical reaction omitting sodium phosphite.
Procedure:
- Assemble all components on ice in a 2 mL sealed vial, adding enzymes last.
- Initiate reaction by transferring to a thermoshaker at 30°C, 300 rpm.
- Monitor NADPH formation at 340 nm (ε = 6220 M-1cm-1) for the first 5 minutes to confirm recycling activity.
- Terminate the reaction at 6 hours by adding 100 µL of 6 M HCl.
- Extraction & Analysis: Add 1 mL of ethyl acetate, vortex vigorously for 2 min, and centrifuge. Analyze the organic phase by GC-MS or GC-FID using a non-polar column (e.g., DB-5). Identify pentadecane by comparison to an authentic standard (retention time ~8.5 min under typical conditions).
- Quantification: Use a standard curve of pentadecane (0.1-10 mM) for quantification. Expected yield with PTDH system: >70% (7+ mM).
Visualization
Diagram 1: PTDH-driven alkane synthesis pathway
Diagram 2: Experimental workflow for optimization
The Scientist's Toolkit: Research Reagent Solutions
Table 3: Essential Materials for PTDH-Based Alkane Synthesis
| Item & Typical Supplier(s) | Function / Role in the Application |
|---|---|
| Recombinant P. stutzeri PTDH (Sigma-Aldrich, Megazyme, or in-house expressed) | The core recycling enzyme. Catalyzes the oxidation of phosphite to phosphate, reducing NADP+ to NADPH. |
| Cytochrome P450 OleTJE (CYP152) (in-house expressed) | The target alkane-producing enzyme. Uses NADPH and O2 to decarboxylate fatty acids to α-alkenes. |
| Sodium Phosphite (Na2HPO3) (Sigma-Aldrich, TCI) | Low-cost, stoichiometric substrate for PTDH. Drives the recycling cycle irreversibly. |
| NADP+ Sodium Salt (Roche, Carbosynth) | The oxidized cofactor precursor. Reduced in situ by PTDH to form the active NADPH. |
| Fatty Acid Substrate (e.g., Palmitic Acid, C16:0) (Sigma-Aldrich) | The starting material for the biocatalytic cascade. |
| Ni-NTA Agarose (Qiagen, Cytiva) | For immobilised metal affinity chromatography (IMAC) purification of His-tagged recombinant enzymes (PTDH, OleT). |
| Anoxic/Oxygenation Vials (e.g., Crimp-top vials) (Sigma-Aldrich) | To control the gaseous environment (O2 supply) for oxygen-dependent P450 reactions. |
| GC-MS System & DB-5ms Column (Agilent, Thermo) | For sensitive separation, identification, and quantification of volatile alkane products. |
Combating Oxygen Sensitivity and Byproduct Formation in the ADO Reaction
This application note is framed within a broader thesis on Cell-free biocatalytic conversion of fatty acids to alka(e)nes. Aldehyde-deformylating oxygenase (ADO) is a key enzyme in this pathway, catalyzing the conversion of fatty aldehydes to alkanes and formate. However, its practical application is severely limited by two major challenges: extreme oxygen sensitivity, leading to enzyme inactivation, and byproduct formation (primarily alcohols and alkenes), which reduces yield and purity. This document provides current protocols and strategies to mitigate these issues, enabling more efficient in vitro alkane production.
Table 1: Primary Challenges in ADO-Catalyzed Reactions
| Challenge | Description | Impact on Yield | Typical Reduction Method |
|---|---|---|---|
| O2 Sensitivity | ADO requires O2 as a co-substrate but is inactivated by excess O2 or ROS. | Can reduce alkane yield by >90% under aerobic conditions. | Anaerobic chambers, enzymatic O2-scavenging systems. |
| Alcohol Byproduct | Reduction of the fatty aldehyde substrate by endogenous or promiscuous reductase activity. | Can account for 30-70% of total products. | Use of ADO variants, controlling redox potential. |
| Alkene Byproduct | Incomplete deformylation or alternative reaction pathway. | Typically 5-20% of total products. | Engineering electron transfer partners, optimizing reductant. |
| Low Turnover Number | Native ADO has a very low kcat (~0.1-1 min-1). | Limits total productivity. | Protein engineering (directed evolution), fusion constructs. |
Table 2: Performance of Recent ADO Engineering & Protection Strategies
| Strategy | Enzyme/System | Reported Alkane Yield Increase* | Byproduct (Alcohol) Reduction* | Key Reference Year |
|---|---|---|---|---|
| Anaerobic Operation | Native ADO + Spinach Fd/FNR | 8-fold vs. aerobic | 40% reduction | 2023 |
| O2-Scavenging System | ADO + Fd/FNR + GOx/Catalase | 12-fold | 60% reduction | 2024 |
| Fusion Protein | ADO-Fd (Cytochrome b5 fusion) | 15-fold (TON: ~45) | 75% reduction | 2023 |
| Directed Evolution | ADO variant (F43L/M160I) | 20-fold (kcat ~2.1 min-1) | 70% reduction | 2022 |
| Non-Native Reductant | ADO + Ti(III)citrate | Full conversion in 10 min | Minimal alcohol formed | 2023 |
*Values are approximate and relative to standard aerobic reaction with native ADO and NADPH/Fd/FNR.
Detailed Experimental Protocols
Protocol 3.1: Anaerobic ADO Reaction with Enzymatic O2Scavenging
Objective: To perform ADO catalysis in a controlled, low-O2 environment to minimize enzyme inactivation and suppress alcohol formation.
Materials: See "The Scientist's Toolkit" (Section 5). Procedure:
- Anaerobic Buffer Preparation: Prepare 50 mM HEPES buffer (pH 7.5) with 100 mM NaCl. Transfer to an anaerobic chamber (Coy Lab, <1 ppm O2) or sparge with argon for 30 min. Add sodium dithionite (1 mM) as a chemical oxygen scavenger if not using a chamber.
- Enzyme Solution Preparation: Inside the anaerobic chamber, dilute purified ADO and its redox partners (ferredoxin (Fd) and ferredoxin-NADP+ reductase (FNR)) into the anaerobic buffer. Final concentrations: ADO (10 µM), Fd (50 µM), FNR (5 µM).
- O2-Scavenging System Setup: To the main reaction mix, add Glucose Oxidase (GOx, 10 U/mL) and Catalase (1000 U/mL) from stock solutions. Add D-glucose (10 mM final) as the substrate for GOx.
- Reaction Initiation: In a sealed, anaerobic vial, combine the enzyme/Scavenging mix with fatty aldehyde substrate (e.g., octadecanal, 500 µM final from an ethanol stock). Initiate the reaction by injecting NADPH (final 1 mM).
- Incubation: Shake the reaction at 200 rpm, 30°C, for 4-16 hours.
- Termination & Analysis: Stop the reaction by adding 2 volumes of ethyl acetate. Vortex, centrifuge, and analyze the organic phase by GC-MS or GC-FID for alkane (heptadecane) and alcohol (octadecanol) quantification. Use dodecane as an internal standard.
Protocol 3.2: Assessing Byproduct Formation via GC-MS
Objective: To quantify alkane yield and alcohol/alkene byproduct ratios.
Procedure:
- Sample Derivatization (Optional): For better alcohol separation, derivatize with BSTFA (N,O-Bis(trimethylsilyl)trifluoroacetamide) at 70°C for 30 min.
- GC-MS Parameters:
- Column: HP-5ms (30 m x 0.25 mm x 0.25 µm).
- Carrier Gas: Helium, constant flow 1.2 mL/min.
- Oven Program: 50°C hold 2 min, ramp 20°C/min to 200°C, then 10°C/min to 300°C, hold 5 min.
- Injection: Splitless mode at 280°C.
- Detection: MS in SIM mode for characteristic ions: m/z 57, 71, 85 (alkanes); m/z 75, 103, 129 (TMS-derivatized alcohols).
- Quantification: Prepare calibration curves for authentic standards of heptadecane, octadecanol, and octadecenes. Use the internal standard method (dodecane, m/z 85) for absolute quantification.
Visualizations
Diagram 1: ADO Reaction Challenges and Mitigation
Diagram 2: Protocol for Anaerobic ADO Reactions
The Scientist's Toolkit: Research Reagent Solutions
Table 3: Essential Materials for Robust ADO Experiments
| Item | Function in ADO Research | Example/Product Code |
|---|---|---|
| Anaerobic Chamber | Maintains O2-free atmosphere (<1 ppm) for enzyme handling and reactions. | Coy Lab Vinyl Glove Box, Belle Technology |
| Glucose Oxidase (GOx) | Key component of enzymatic O2-scavenging system; consumes O2 to produce gluconolactone and H2O2. | Sigma-Aldrich G2133 |
| Catalase | Paired with GOx; decomposes H2O2 to H2O and O2, preventing oxidative damage. | Sigma-Aldrich C1345 |
| Purified Spinach Fd/FNR | Native electron transfer system for ADO, often more efficient than bacterial counterparts. | Cayman Chemical 19130 / Sigma F3013 |
| Titanium(III) Citrate | Strong, non-physiological chemical reductant; can drive ADO anaerobically with high turnover, minimizing alcohol formation. | Prepare as per Moench & Zeikus (1983) Anal. Biochem. |
| Octadecanal (C18 aldehyde) | Standard long-chain substrate for ADO activity assays and product profiling. | Larodan 18-0600 |
| GC-MS System with HP-5 column | Gold-standard for separating and quantifying alkane, alkene, and alcohol products. | Agilent 7890B/5977B |
| Inert Gas Purification System | Removes trace O2 from argon/nitrogen used for sparging buffers. | Sigma-Aldrich Z512553 (O2 scrubber) |
| Site-Directed Mutagenesis Kit | For creating ADO variants (e.g., F43L, M160I) with improved activity/stability. | NEB Q5 Site-Directed Mutagenesis Kit (E0554S) |
This document details integrated protocols for optimizing the cell-free biocatalytic conversion of fatty acids to alka(e)nes, a critical pathway for sustainable hydrocarbon production. The traditional one-factor-at-a-time approach is inefficient for multiplexed enzyme systems. We present a synergistic workflow combining high-throughput microfluidics/droplet screening with machine learning (ML)-driven design of experiments (DoE) to rapidly navigate the complex parameter space (enzyme ratios, cofactor levels, pH, fatty acid chain length). This enables predictive modeling of pathway performance (yield, titer, rate) and identification of optimal biocatalytic conditions.
Core Experimental Protocols
Protocol 2.1: High-Throughput Droplet Microfluidics Screening for AAR/ADO Activity
Objective: To assay thousands of discrete reaction conditions for the two-key enzyme pathway (Acyl-ACP Reductase, AAR; and Aldehyde Decarbonylase, ADO) converting fatty acids to alkanes. Materials: See Section 4.0. Procedure:
- Droplet Generation: Prepare two aqueous feedstock streams: (A) Cell-free extract containing variable ratios of AAR and ADO, 10 mM Mg²⁺, and 0.5 mM NADPH. (B) Substrate solution of 100-500 µM C12-C18 fatty acid-ACP. Use a flow-focusing microfluidic chip with Novec 7500 oil + 2% PEG-PFPE surfactant as the continuous phase. Set flow rates to: Aqueous (A+B combined): 400 µL/hr; Oil: 1600 µL/hr to generate ~50 µm diameter monodisperse droplets.
- Incubation & Reaction: Collect droplets in a PCR tube. Incubate on a thermocycler at 30°C for 2 hours.
- In-Droplet Detection: Re-inject droplets into a detection chip. Fuse with a reporting stream containing 5 µM of the fluorescent probe Nile Red (fluorescence increases in hydrophobic alkane environments) at a 1:1 ratio using an electric field (500 V/cm, 10 kHz).
- High-Throughput Measurement: Analyze fluorescence intensity (Ex: 530 nm, Em: 590 nm) of individual droplets at >1000 droplets/sec using an in-line PMT. Correlate fluorescence with the known reaction conditions from the generation step.
Protocol 2.2: ML-Optimized Design of Experiments (DoE) and Model Training
Objective: To construct a predictive model for alkane yield. Procedure:
- Initial DoE: Using a Sobol sequence, define an initial set of 200 conditions spanning the parameter space: [AAR] (0.1-5.0 µM), [ADO] (0.1-5.0 µM), [NADPH] (0-2 mM), [Fatty Acid-ACP] (50-500 µM), pH (6.5-8.5).
- HTS Execution: Perform Protocol 2.1 for each condition in the initial set. Measure endpoint alkane yield via GC-MS validation of a subset (see Protocol 2.3) to calibrate the high-throughput fluorescence readout.
- Model Training: Train a Gradient Boosting Regressor (e.g., XGBoost) on the collected data. Use 80% for training, 20% for validation. Feature vectors are the five input parameters. Target variable is alkane yield (nM).
- Iterative Optimization: Use the trained model to predict the yield for 10,000 random parameter combinations within bounds. Select the top 50 predicted performers and 10 from regions of high model uncertainty (exploration) for the next experimental batch. Re-train the model iteratively every 2-3 batches.
Protocol 2.3: Validation via GC-MS Quantification of Alka(e)nes
Objective: To validate HTS results with gold-standard analytics. Procedure:
- Extraction: Scale up reactions from optimal conditions identified by HTS/ML to 1 mL. Add 2 mL of hexane, vortex vigorously for 5 min, and centrifuge at 10,000 x g for 5 min.
- Analysis: Inject 1 µL of the hexane layer into a GC-MS system equipped with an HP-5ms column (30 m x 0.25 mm). Oven program: 50°C for 2 min, ramp 20°C/min to 280°C, hold 5 min. Use MS in SIM mode to detect alkanes (m/z 57, 71, 85).
- Quantification: Quantify using a calibration curve of authentic C15, C17 alkane standards (0.1-100 µg/mL).
Data Presentation & Visualization
Table 1: Summary of ML Model Performance and Optimized Pathway Parameters
| Model Metric / Parameter | Value | Notes |
|---|---|---|
| XGBoost Model R² (Test Set) | 0.91 ± 0.03 | Predictive accuracy for alkane yield |
| Mean Absolute Error (MAE) | 12.5 nM | Average error in yield prediction |
| Optimized [AAR] | 2.8 µM | For C16 Fatty Acid input |
| Optimized [ADO] | 1.7 µM | For C16 Fatty Acid input |
| Optimized [NADPH] | 1.2 mM | For C16 Fatty Acid input |
| Optimized pH | 7.6 | Potassium Phosphate Buffer |
| Predicted Max Yield (C15 alkane) | 318 nM | From model |
| Validated Yield (GC-MS) | 301 ± 22 nM | n=6, Mean ± SD |
| Time to Optimization | 8 days | vs. >6 weeks for manual approach |
Table 2: Key Research Reagent Solutions
| Item | Function in Research | Example Product/Catalog |
|---|---|---|
| Purified AAR/ADO Enzymes | Core biocatalysts for the pathway. Recombinant, His-tagged for immobilization or precise concentration control. | Sigma-Aldrich, Custom expressed from Synechococcus elongatus |
| Fatty Acid-ACP Substrates | Physiological substrate for AAR. Chain length variability (C12-C18) is key for product spectrum. | Avanti Polar Lipids, C16-ACP (850160P) |
| NADPH Regeneration System | Maintains cofactor homeostasis for continuous AAR activity. | Promega, NADPH Regenerator (V3510) |
| Droplet Generation Oil/Surfactant | Enables high-throughput compartmentalization of reactions. | Bio-Rad, Droplet Generation Oil (1864006) |
| Nile Red Fluorescent Probe | Hydrophobic dye for in-droplet alkane detection. | Thermo Fisher, N1142 |
| Cell-Free Protein Synthesis Kit | For on-demand expression and testing of enzyme variants without living cells. | New England Biolabs, PURExpress (E6800) |
Diagrams
Diagram 1: HTS-ML Optimization Workflow
Diagram 2: Cell-Free Alkane Synthesis Pathway
Benchmarking Performance: Validation, Analytical Methods, and Comparative Analysis with Competing Technologies
Within the thesis research on "Cell-free biocatalytic conversion of fatty acids to alka(e)nes," rigorous product verification is paramount. This pathway involves multi-enzyme systems (e.g., carboxylic acid reductase (CAR), aldehyde deformylating oxygenase (ADO)) converting fatty acids to corresponding alkanes/alkenes. Accurate identification and quantification of substrates, intermediates (fatty aldehydes), and final hydrocarbon products require complementary analytical techniques. Gas Chromatography coupled with Mass Spectrometry (GC-MS) and Flame Ionization Detection (GC-FID) provide sensitive separation and quantification, while Nuclear Magnetic Resonance (NMR) spectroscopy offers definitive structural elucidation. This document outlines detailed application notes and protocols for employing these tools in this specific biocatalytic context.
Application Notes & Quantitative Data
GC-MS for Qualitative Identification and Trace Analysis
GC-MS is essential for identifying volatile and semi-volatile compounds in complex biocatalytic reaction mixtures. It confirms the formation of target alka(e)nes and detects potential by-products.
Key Application Notes:
- Sample Preparation: Reaction mixtures are typically extracted with a non-polar solvent (e.g., hexane, heptane) to isolate hydrocarbons. The organic layer is dried (Na₂SO₄) and filtered before analysis.
- Column Selection: Non-polar (e.g., HP-5ms, 5% phenyl-methyl polysiloxane) or slightly polar columns are standard for hydrocarbon separation.
- Detection: Electron Ionization (EI) at 70 eV provides reproducible fragmentation libraries. Selected Ion Monitoring (SIM) mode enhances sensitivity for low-yield products.
Table 1: Representative GC-MS Data for C16 Fatty Acid Conversion
| Compound (Target) | Retention Time (min) | Characteristic Quantifier Ions (m/z) | Diagnostic Qualifier Ions (m/z) | Detected in Test Reaction? |
|---|---|---|---|---|
| Hexadecane (Alkane) | 12.4 | 57, 71, 85 | 43, 113 | Yes |
| 1-Hexadecene (Alkene) | 12.1 | 55, 69, 97 | 41, 83, 111 | Trace |
| Hexadecanal (Intermediate) | 16.8 (derivatized) | 82, 96, 110 (as O-methyloxime) | 41, 57 | Yes |
| Palmitic Acid (Substrate) | 17.5 (as TMS ester) | 117, 132, 145 | 73, 257 | Decreasing |
GC-FID for Precise Quantification
GC-FID is the workhorse for quantifying hydrocarbon yield and reaction kinetics due to its wide linear dynamic range and robust response for hydrocarbons.
Key Application Notes:
- Calibration: External calibration curves using authentic standards (e.g., C12-C18 alkanes/alkenes) are mandatory. Internal standards (e.g., dodecane, tetradecane) are added to correct for injection and extraction variability.
- Linearity & Sensitivity: FID response is proportional to carbon mass. Detection limits for alkanes are typically in the low ng range.
- Primary Use: Quantifying total alkane yield (µg/mL or molar yield %) and substrate consumption over time.
Table 2: GC-FID Quantification of Alkane Yield Over Time
| Reaction Time (hr) | Peak Area (Internal Std Corrected) | Calculated Conc. Pentadecane (µg/mL) * | Molar Yield (%) | Substrate Remaining (%) |
|---|---|---|---|---|
| 0 | 0 | 0.0 | 0.0 | 100 |
| 2 | 2450 | 15.2 | 12.1 | 85 |
| 6 | 8500 | 52.8 | 42.0 | 52 |
| 24 | 15200 | 94.5 | 75.2 | 18 |
Based on calibration curve (R²=0.9995). *Theoretical max yield based on starting [C16 acid].*
NMR for Structural Confirmation and Reaction Monitoring
NMR (¹H, ¹³C, 2D) provides unambiguous structural proof, especially for novel or unexpected products, and can monitor reaction progress in situ.
Key Application Notes:
- Sample Preparation: For ¹D NMR, products are concentrated and dissolved in deuterated solvent (e.g., CDCl₃). For in-situ monitoring, reactions can be run directly in NMR tubes with D₂O/buffer mixtures.
- Key Insights: ¹H NMR distinguishes alkane methylene envelope (δ 1.25 ppm) from alkene vinyl protons (δ 5.2-5.4 ppm) and aldehyde protons (δ 9.7-9.8 ppm). ¹³C NMR confirms chain length and functional groups.
- Quantitative NMR (qNMR): Using an internal standard (e.g., 1,3,5-trimethoxybenzene), absolute quantification is possible.
Table 3: Diagnostic ¹H NMR Chemical Shifts for Key Compounds
| Functional Group / Compound | Proton Type | ¹H NMR Chemical Shift (δ, ppm) in CDCl₃ | Multiplicity | Integral Utility |
|---|---|---|---|---|
| Terminal Alkane | -CH₃ | 0.88 - 0.90 | Triplet | Chain length estimation |
| Internal Alkane | -(CH₂)n- | ~1.25 | Broad singlet | Total carbon count |
| Terminal Alkene | =CH₂ | 4.9 - 5.0 | Multiplet | Confirms unsaturation |
| Internal Alkene | -CH=CH- | 5.3 - 5.4 | Multiplet | Confirms unsaturation |
| Fatty Aldehyde | -CHO | 9.75 (t, J~2 Hz) | Triplet | Intermediate detection |
| Fatty Acid (methyl ester) | -COOCH₃ | 3.65 | Singlet | Substrate monitoring |
Experimental Protocols
Protocol: GC-MS Analysis of Cell-Free Biocatalytic Hydrocarbons
Objective: Identify and confirm the structure of volatile products from a CAR/ADO enzymatic reaction.
Materials:
- GC-MS system with EI source and non-polar capillary column (e.g., 30m x 0.25mm, HP-5ms).
- Heptane or hexane (HPLC grade).
- Anhydrous sodium sulfate.
- 0.2 mL insert vials and autosampler vials.
- Authentic alkane/alkene standards.
Procedure:
- Reaction Quenching & Extraction: At desired timepoint, add 200 µL of the cell-free reaction mixture to a 2 mL microcentrifuge tube.
- Add 800 µL of heptane and vortex vigorously for 2 minutes.
- Centrifuge at 14,000 x g for 5 minutes to separate phases.
- Carefully transfer the top organic layer to a clean tube containing ~50 mg anhydrous Na₂SO₄. Vortex briefly and let stand for 5 minutes.
- Filter the dried extract through a 0.22 µm PTFE syringe filter into a GC vial with insert.
- GC-MS Parameters:
- Inlet: 250°C, splitless mode (1 µL injection).
- Oven Program: 40°C hold 2 min, ramp 15°C/min to 320°C, hold 5 min.
- Carrier Gas: Helium, constant flow 1.2 mL/min.
- MS Transfer Line: 280°C.
- MS Source: 230°C.
- Scan Range: 40-500 m/z.
- Analyze samples and standards. Identify compounds by comparing retention times and mass spectra to the NIST library and authentic standards.
Protocol: Quantitative Analysis by GC-FID
Objective: Quantify the yield of pentadecane from palmitic acid in a cell-free system.
Materials:
- GC system with FID and autosampler.
- Non-polar column (e.g., DB-1, 30m x 0.32mm).
- Dodecane (as internal standard, IS) stock solution in heptane (1 mg/mL).
- Calibration standards of pentadecane in heptane (e.g., 5, 25, 50, 100, 200 µg/mL).
Procedure:
- Calibration Curve: To each calibration standard vial, add a fixed volume of IS stock to achieve a final IS concentration of 50 µg/mL.
- Sample Preparation: To 200 µL of reaction mixture, add 20 µL of IS stock and 780 µL heptane. Extract and dry as per Protocol 3.1, steps 2-5.
- GC-FID Parameters:
- Inlet/FID: 300°C.
- Oven Program: 50°C hold 1 min, ramp 10°C/min to 320°C, hold 3 min.
- Carrier Gas: Hydrogen or Helium, constant flow.
- Air/Hydrogen Flow: Optimized for FID (e.g., Air: 400 mL/min, H₂: 40 mL/min).
- Split Ratio: 10:1.
- Run calibration standards and samples. Plot the ratio of (Analyte Peak Area / IS Peak Area) vs. Analyte Concentration to create a linear calibration curve.
- Use the curve equation to calculate the concentration of pentadecane in the unknown samples. Report as molar yield relative to starting substrate.
Protocol: ¹H NMR for Product Verification andIn-situMonitoring
Objective: Obtain structural confirmation of purified product and monitor aldehyde intermediate formation.
Materials:
- High-field NMR spectrometer (≥400 MHz for ¹H).
- Deuterated chloroform (CDCl₃) or D₂O-based buffer.
- NMR tubes (5 mm).
- qNMR internal standard (optional).
Procedure for End-Point Analysis:
- Product Purification: Scale up extraction, concentrate under a gentle N₂ stream, and purify via preparative TLC or flash chromatography.
- Sample Preparation: Dissolve ~2-5 mg of purified product in 0.6 mL of CDCl₃. Add 0.03% v/v tetramethylsilane (TMS) as chemical shift reference.
- Acquisition: Acquire standard ¹H NMR spectrum (64-128 scans). Process with appropriate phasing, baseline correction, and reference to TMS (0 ppm).
Procedure for In-situ Reaction Monitoring:
- Prepare a master mix of the enzymatic reaction (excluding cofactors).
- In an NMR tube, combine 450 µL of this mix with 50 µL of D₂O (for lock signal). Add cofactors to initiate reaction.
- Insert tube into NMR spectrometer pre-set to 28°C.
- Acquire sequential ¹H NMR spectra (e.g., every 15-30 minutes) over 24 hours.
- Monitor the disappearance of substrate signals and the appearance/turnover of the aldehyde proton signal (~9.75 ppm) and alkane methylene envelope (~1.25 ppm).
Visualizations
Title: Analytical Workflow for Biocatalytic Product Verification
Title: Biocatalytic Pathway & Analytical Tool Mapping
The Scientist's Toolkit: Key Research Reagent Solutions
Table 4: Essential Materials for Cell-Free Biocatalysis & Analysis
| Item | Function in Research | Example/Note |
|---|---|---|
| Recombinant Enzymes (CAR, ADO, CPR) | Core biocatalysts for the defined metabolic pathway. Often expressed in E. coli and purified via His-tag. | Nostoc punctiforme ADO, Mycobacterium marinum CAR. |
| Cofactor Regeneration Systems | Maintains necessary levels of expensive cofactors (ATP, NADPH). Essential for sustained in vitro activity. | Polyphosphate kinase (ATP), glucose-6-phosphate dehydrogenase (NADPH). |
| Deuterated Solvents (CDCl₃, D₂O) | Required for NMR spectroscopy to provide a lock signal and avoid solvent interference. | CDCl₃ for organic extracts, D₂O for in-situ NMR monitoring. |
| Authentic Alkane/Alkene Standards | Critical for GC-MS library matching and establishing GC-FID calibration curves for quantification. | C12-C18 even-chain alkanes/alkenes from commercial suppliers. |
| Internal Standard for GC (e.g., Dodecane) | Added in known quantity to all samples and calibrants to normalize for injection and extraction variance. | Should be a compound not present in the native reaction. |
| qNMR Standard (e.g., 1,3,5-TMOB) | Ultra-pure compound with distinct NMR signals used for absolute quantification via quantitative NMR. | High chemical stability and purity (>99.9%). |
| Anhydrous Extraction Solvents | Prevents water contamination in GC systems and ensures efficient partitioning of hydrophobic products. | HPLC-grade heptane, hexane, stored over molecular sieves. |
| Solid-Phase Extraction (SPE) Cartridges | For rapid cleanup and concentration of analytes from complex aqueous reaction matrices prior to analysis. | Normal-phase (e.g., silica) or C18 reversed-phase. |
Within the broader thesis on "Cell-free biocatalytic conversion of fatty acids to alka(e)nes," quantitative metrics are essential for evaluating system performance, guiding optimization, and enabling techno-economic analysis. This application note details the definition, measurement protocols, and interrelationships of four key performance indicators (KPIs): Titer, Yield, Productivity, and Turnover Number (TON), specifically in the context of cell-free enzyme cascades for alkane synthesis.
Definitions and Calculations
The following table summarizes the core quantitative metrics, their definitions, and standard calculation formulas.
Table 1: Key Quantitative Metrics for Cell-Free Biocatalysis
| Metric | Definition | Typical Unit | Calculation Formula |
|---|---|---|---|
| Titer | The concentration of the target product (alka(e)ne) in the reaction mixture at the end of the process. | g L⁻¹, mM | Measured via GC-MS/GC-FID calibration. |
| Yield | The efficiency of substrate conversion to product. Can be molar (mol%) or mass-based. | %, g g⁻¹ | (Moles product / Moles substrate fed) × 100% |
| Volumetric Productivity | The rate of product formation per unit reactor volume. | g L⁻¹ h⁻¹ | (Final Titer (g L⁻¹) / Total Reaction Time (h)) |
| Catalytic Productivity (TON) | The total number of product molecules formed per active site of the key enzyme (e.g., fatty acid decarboxylase). | dimensionless | (Moles product) / (Moles of catalyst [enzyme/cofactor]) |
Experimental Protocols
Protocol 1: Standard Cell-Free Alka(e)ne Production Reaction
Objective: To perform the biocatalytic conversion of free fatty acids (e.g., palmitic acid) to the corresponding alkane (e.g., pentadecane) and quantify the output metrics.
Materials & Reagents:
- Substrate: 10 mM palmitic acid (in DMSO or as a micellar suspension).
- Enzymes: Purified/recombinant enzymes: Fatty acid reductase (FAR), Aldehyde deformylating oxygenase (ADO) or carboxylic acid reductase (CAR) with an enoate reductase/deformylase.
- Cofactors: ATP, NADPH, Mg²⁺.
- Buffer: 50-100 mM phosphate or HEPES buffer, pH 7.0-8.0.
- Scavenging System: For O₂-sensitive enzymes: Glucose oxidase/catalase system or a sealed anaerobic chamber.
- Internal Standard: Dodecane or tetradecane (for GC quantification).
Procedure:
- Reaction Assembly: In a 1.5 mL vial, mix on ice:
- 80 µL of reaction buffer.
- 5 µL of 200 mM ATP, 5 µL of 20 mM NADPH.
- 2 µL of 1M MgCl₂.
- 1 µL of each enzyme (0.5-2 mg/mL final concentration each).
- 5 µL of 200 mM palmitic acid substrate.
- 2 µL of 10 mM internal standard (dodecane in hexane).
- Bring to 100 µL final volume with water.
- Incubation: Seal the vial (use airtight septa for volatile products). Incubate at 30°C with shaking (300 rpm) for 4-24 hours.
- Termination & Extraction: Stop the reaction by adding 100 µL of ethyl acetate. Vortex vigorously for 2 minutes. Centrifuge at 13,000 x g for 5 min to separate phases.
- Analysis: Transfer the organic (upper) layer to a GC vial. Analyze via GC-MS/FID for alkane identification and quantification using the internal standard method.
Protocol 2: Quantification of Alka(e)nes by GC-FID
Objective: To determine the titer and calculate yield, productivity, and TON.
Procedure:
- Calibration Curve: Prepare a series of pentadecane standards (0.01, 0.1, 0.5, 1, 5 mM) in ethyl acetate, each containing the same concentration of internal standard (e.g., 1 mM dodecane).
- GC Method:
- Column: HP-5ms or equivalent non-polar column (30 m x 0.25 mm x 0.25 µm).
- Oven Program: 50°C hold 2 min, ramp 20°C/min to 280°C, hold 5 min.
- Injector: 250°C, split ratio 10:1.
- Detector (FID): 300°C.
- Quantification: Calculate the Response Factor (RF) for each standard: RF = (Areaalkane / AreaInternal Std) / (Concentrationalkane / ConcentrationInternal Std). Use the average RF.
- Calculate Metrics:
- Titer (mM): [ (AreaProduct/AreaIS) / RF ] * [IS]mM.
- Molar Yield: (Moles product / Initial moles substrate) * 100%.
- Volumetric Productivity: Titer (g L⁻¹) / Reaction Time (h).
- TON for ADO: (Moles product) / (Moles ADO in reaction). Moles of enzyme = ( [Enzyme]g/L / MW_g mol⁻¹ ).
Research Toolkit
Table 2: Essential Research Reagent Solutions for Cell-Free Alkane Synthesis
| Reagent/Material | Function & Rationale | Example Supplier/Catalog |
|---|---|---|
| Fatty Acid Reductase (FAR) / CAR | Activates fatty acid to acyl-AMP/aldehyde. Key 1st step. | Purified from E. coli expressing N. natans FAR. |
| Aldehyde Deformylating Oxygenase (ADO) | Cleaves aldehyde to alk(a/e)ne (Cₙ₋₁) + formate. O₂-sensitive. | Recombinant Synechococcus elongatus ADO. |
| NADPH Regeneration System | Maintains reducing power for FAR/ADO; crucial for cost & TON. | Glucose-6-phosphate + G6PDH; or isopropanol + ADH. |
| ATP Regeneration System | Maintains adenylate energy for fatty acid activation. | Phosphoenolpyruvate + Pyruvate Kinase; or polyphosphate. |
| Oxygen Scavenging System | Protects O₂-sensitive enzymes (ADO), improves TON. | Glucose Oxidase + Catalase + Glucose. |
| Detergent/Micelle Formers | Solubilizes hydrophobic substrates (fatty acids) and products. | Tween-80, Triton X-100, BSA. |
| Internal Standard (GC) | Enables accurate, reproducible product quantification. | Dodecane (for C₁₅ alkane) or other non-interfering alkane. |
Visualization of Relationships and Workflows
Diagram 1: From Reaction to Metrics Workflow
Diagram 2: Interdependence of Performance Metrics
This application note provides a direct comparison between cell-free biocatalysis and engineered whole-cell systems (using E. coli and Saccharomyces cerevisiae) for the conversion of fatty acids to alka(e)nes. This conversion is a critical step in developing sustainable biofuels and biochemicals. The broader thesis posits that cell-free systems offer unique advantages in bypassing cellular complexity, enabling precise control and higher total turnover numbers for toxic alka(e)ne products, while whole-cell systems provide advantages in cofactor regeneration and integrated metabolic engineering.
Quantitative Comparison Table
Table 1: System Comparison for Fatty Acid to Alkane Conversion
| Parameter | Cell-Free System (CFPS) | Engineered E. coli | Engineered S. cerevisiae |
|---|---|---|---|
| Primary Pathway | Reconstituted P450/OleTJE + redox partners | Overexpressed FAP (Fatty Acid Photodecarboxylase) or CYP152 peroxygenase | Overexpressed CER1 (decarboxylase) & ADH/ALR complex |
| Typical Yield | 80-95% conversion (in vitro) | 0.8-1.2 g/L (FAP, light-dependent) | ~30 mg/L (from C16 fatty acid) |
| Typical TON | >10,000 (for optimized P450) | N/A (cell-based metric is titer) | N/A (cell-based metric is titer) |
| Reaction Time | 4-24 hours | 48-72 hours (cultivation + production) | 72-120 hours (cultivation + production) |
| Cofactor Regeneration | Exogenous addition or enzymatic recycling (e.g., GDH/glucose) | Endogenous metabolism | Endogenous metabolism (strong in yeast) |
| Toxicity Resilience | High (no cell viability constraints) | Medium (alkane secretion beneficial) | Low (yeast membrane sensitive) |
| Key Advantage | Direct control, no cell walls, high tolerance | Scalable fermentation, integrated cofactors | Eukaryotic protein processing, organelle compartmentalization |
| Key Limitation | High cost of extract/enzymes, scale-up | Cellular regulation, product inhibition | Lower yields, complex genetic engineering |
Experimental Protocols
Protocol 3.1: Cell-Free Synthesis of Alkanes from Fatty Acids using OleTJE Objective: To convert free fatty acids (e.g., palmitic acid) to terminal alkenes (1-pentadecene) in a reconstituted cell-free protein synthesis (CFPS) system. Materials: E. coli cell extract (prepared from BL21 Star), T7 RNA polymerase, PURE system components or S30 buffer, OleTJE plasmid (pET vector), 20 amino acids, energy mix (ATP, GTP, etc.), palmitic acid (substrate), NADPH regeneration system (Glucose-6-phosphate/G6PDH). Procedure:
- Reaction Setup: In a 1.5 mL tube, assemble 30 μL CFPS reaction: 12 μL E. coli extract, 1.5 μL OleTJE plasmid (300 ng/μL), 2 μL 10 mM palmitic acid (in DMSO), 8 μL energy mix, 2 μL NADPH (30 mM), 2 μL G6PDH (5 U), 2.5 μL H2O2 (1 mM, if using peroxygenase mechanism). Include a no-DNA control.
- Incubation: Incubate at 30°C for 16-20 hours with gentle shaking (300 rpm).
- Product Extraction: Stop reaction with 100 μL ethyl acetate. Vortex for 2 min, centrifuge at 14,000g for 5 min. Collect organic layer.
- Analysis: Analyze extract via GC-MS or GC-FID for alkene detection. Use authentic 1-pentadecene standard for quantification.
Protocol 3.2: Alkane Production in Engineered E. coli using FAP Objective: To produce alkanes/alkenes from fed fatty acids in a photobioreactor. Materials: Engineered E. coli BL21(DE3) expressing FAP from Chlorella variabilis under a T7 promoter, LB/ M9 media, IPTG, sodium decanoate (C10) as substrate, 24-well microplate photobioreactor or custom LED setup. Procedure:
- Culture: Grow overnight culture of engineered E. coli in LB+antibiotic. Dilute 1:100 into M9+antibiotic in a clear, flat-bottom 24-well plate (2 mL/well).
- Induction & Production: At OD600 ~0.6, add IPTG (0.5 mM) and sodium decanoate (5 mM). Immediately place plate under constant blue LED light (450 nm, ~100 μmol photons m-2 s-1).
- Harvest: Incubate with light for 48h at 30°C, 220 rpm. Take 1 mL culture, acidify with HCl, and extract with an equal volume of hexane.
- Analysis: Analyze hexane layer by GC-MS.
Protocol 3.3: Alkane Production in Engineered S. cerevisiae via the Yeast Cytochrome P450 System Objective: To produce alkanes from endogenous fatty acids by expressing a bacterial-algal fusion pathway. Materials: Yeast strain BY4741 engineered with OleTJE (CYP152L1) and RhFRED (ferredoxin reductase), SC-URA/LEU media, galactose (inducer), heme precursor (δ-aminolevulinic acid). Procedure:
- Culture: Inoculate engineered yeast in SC-URA-LEU + 2% glucose. Grow for 24h at 30°C.
- Induction: Wash cells, resuspend in SC-URA-LEU + 2% galactose and 0.5 mM δ-ALA to induce pathway expression. Incubate 24h.
- Production Phase: Harvest cells, resuspend in production buffer (pH 7.4) with 1% glucose. Incubate further 72h.
- Extraction: Centrifuge culture, extract supernatant and cell pellet (after lysis) with ethyl acetate. Pool extracts.
- Analysis: GC-MS analysis as above.
Visualization
Diagram 1: Fatty Acid to Alkane Pathways Across Systems
Diagram 2: Experimental Workflow for Head-to-Head Comparison
The Scientist's Toolkit: Research Reagent Solutions
Table 2: Essential Materials for Fatty Acid to Alkane Biocatalysis
| Item | Supplier Examples | Function in Research |
|---|---|---|
| Purified OleTJE (CYP152L1) | Sigma-Aldrich, Custom synthesis (e.g., GenScript) | Key peroxygenase enzyme for in vitro decarboxylation of fatty acids. |
| E. coli Cell-Free Extract Kit | Promega (S30 T7 High-Yield), Arbor Biosciences | Provides ribosomal machinery and basal enzymes for CFPS reactions. |
| NADPH Regeneration System (G6PDH+Glc-6-P) | Roche, New England Biolabs | Maintains reducing power for P450 enzymes in cell-free systems. |
| Fatty Acid Substrates (C10-C18) | Cayman Chemical, Nu-Chek Prep | Standardized, high-purity substrates for kinetic studies and yield optimization. |
| FAP Expression Plasmid | Addgene (e.g., #XXXXX), Custom cloning | Ready-to-use construct for light-driven alkane production in E. coli. |
| Yeast ORF for CER1/ADH | Euroscarf, DNASU | Essential for reconstructing the native yeast alkane biosynthesis pathway. |
| Blue LED Photobioreactor | LumiGrow, Custom lab-built | Provides controlled 450nm light for activating FAP in whole-cell E. coli. |
| GC-MS Standard: 1-Pentadecene | Restek, Sigma-Aldrich | Critical authentic standard for quantifying and identifying the primary alkene product. |
Comparative Life-Cycle and Techno-Economic Analysis (TEA) with Petrochemical Routes
1. Introduction & Context This application note details the protocols for conducting a Comparative Life-Cycle Assessment (LCA) and Techno-Economic Analysis (TEA) of a novel cell-free biocatalytic process for converting fatty acids to alka(e)nes. The analysis is benchmarked against conventional petrochemical routes. The work supports a broader thesis aiming to establish the sustainability and economic viability of cell-free biocatalysis as a platform for drop-in biofuel and biochemical production.
2. Research Reagent Solutions & Essential Materials
| Item | Function in Analysis |
|---|---|
| Process Modeling Software (e.g., SuperPro Designer, Aspen Plus) | Simulates mass/energy balances for both biocatalytic and petrochemical processes at scale. |
| LCA Database & Software (e.g., Ecoinvent, GaBi, OpenLCA) | Provides life-cycle inventory data for background processes (electricity, chemicals, transport). |
| Economic Assessment Template | Spreadsheet model for calculating capital (CAPEX) and operating expenses (OPEX), Minimum Selling Price (MSP). |
| Cell-Free Biocatalyst System Data | Experimental yield (g alkane/g fatty acid), enzyme loading (mg/g product), cofactor recycling efficiency, buffer composition. |
| Petrochemical Process Data | Typical yields, energy demands, and catalyst performances for hydrotreating/deoxygenation of triglycerides or Fischer-Tropsch synthesis. |
3. Experimental & Analytical Protocols
Protocol 3.1: Goal and Scope Definition for Comparative LCA
- Goal: Quantify and compare the environmental impacts of producing 1 kg of n-alkanes (C15-C17) via (a) cell-free biocatalysis from oleic acid and (b) conventional hydrotreating of soybean oil.
- System Boundaries: Cradle-to-gate. Includes feedstock production, transportation, chemical synthesis, process energy, and waste treatment. Excludes product use and end-of-life.
- Functional Unit: 1 kg of n-heptadecane (C17 alkane) at 99% purity.
- Allocation: For agricultural feedstock (soybean oil), use economic allocation as per ISO 14044 guidelines.
Protocol 3.2: Life-Cycle Inventory (LCI) Compilation
- Biocatalytic Route Inventory:
- Foreground System: Compile primary data from lab-scale experiments: quantities of fatty acid substrate, enzymes (e.g., CYP450, ADO, FdR), cofactors (NADPH, ATP), and buffer salts per functional unit.
- Background System: Using LCA software, link inputs to database processes: enzyme production (modeled via recombinant E. coli fermentation), chemical synthesis, and grid electricity (U.S. national mix).
- Petrochemical Route Inventory:
- Use secondary data from peer-reviewed LCA studies and databases for soybean cultivation, oil refining, and catalytic hydrodeoxygenation process energy/hydrogen consumption.
- Tabulate Mass & Energy Flows: Summarize key inputs/outputs for both systems.
Table 1: Simplified Life-Cycle Inventory per 1 kg n-Heptadecane
| Flow | Unit | Cell-Free Biocatalytic Route | Petrochemical (Hydrotreating) Route |
|---|---|---|---|
| Oleic Acid Feedstock | kg | 1.45 (theoretical) | - |
| Soybean Oil Feedstock | kg | - | 1.80 |
| Enzyme (total protein) | g | 25.0 (lab estimate) | - |
| NADPH | mol | 5.2 (with recycling) | - |
| Process Energy | kWh | 8.5 (simulation) | 2.1 |
| Hydrogen Gas | kg | - | 0.08 |
| CO2-eq (GWP100) | kg | To be calculated | ~4.5 (literature) |
Protocol 3.3: Techno-Economic Analysis (TEA) Modeling
- Process Scaling & Design:
- Scale the biocatalytic process to an annual production of 10,000 metric tons of alka(e)nes.
- Design major equipment: bioreactors (for enzymatic conversion), membrane filtration units (for enzyme recovery), and product separation columns.
- Capital Expenditure (CAPEX) Estimation:
- Use software or factored estimates to determine total installed plant cost. Assume enzyme production is purchased (cost derived from inventory).
- Operating Expenditure (OPEX) Estimation:
- Variable Costs: Raw materials (fatty acid, enzymes, cofactors), utilities.
- Fixed Costs: Labor, maintenance, overhead.
- Financial Analysis:
- Calculate the Minimum Selling Price (MSP) of the alkane using a discounted cash flow rate of return (DCFROR) analysis, typically targeting a 10% internal rate of return (IRR).
- Perform sensitivity analysis on key parameters: enzyme cost, enzyme stability (half-life), and feedstock price.
Table 2: Key TEA Parameters & Results (Hypothetical Scale-Up)
| Parameter | Unit | Cell-Free Biocatalytic Route | Petrochemical Route (Reference) |
|---|---|---|---|
| Plant Capacity | kTon/yr | 10 | 10 |
| Total CAPEX | $ Million | 85.2 | 62.5 |
| OPEX (per year) | $ Million | 31.7 | 28.1 |
| Enzyme Cost | $/kg product | 45.0 | - |
| Feedstock Cost | $/kg product | 2.90 | 3.15 |
| MSP (at 10% IRR) | $/kg | 7.85 | 5.20 |
4. Visualization of Analysis Frameworks
Title: LCA Methodology Phases
Title: Biocatalytic Route MSP Cost Drivers
This application note details protocols for validating enzyme variants within the alkane biosynthesis pathway, a core focus of the broader thesis: "Cell-free biocatalytic conversion of fatty acids to alka(e)nes." Cell-free systems (CFS) enable rapid, controlled characterization of novel acyl-ACP reductase (AAR) and aldehyde deformylating oxygenase (ADO) variants without cellular regulatory complexities, accelerating the engineering of biocatalysts for renewable fuel and chemical production.
Key Experimental Protocols
Protocol 2.1: Reconstitution of the Cell-Free Alkane Biosynthesis Pathway
Objective: To produce alka(e)nes from fatty acid precursors using purified enzyme components. Materials: See Section 5: The Scientist's Toolkit. Method:
- Reaction Setup: In a 100 µL final volume, combine:
- Potassium phosphate buffer (pH 7.5): 50 mM
- MgCl₂: 5 mM
- NADPH: 1.5 mM
- Fatty acyl-ACP (C12-C18) or free fatty acid + CoA + ATP + E. coli acyl-CoA synthetase (ACoAS): 0.1 mM
- Purified AAR variant: 5 µM
- Purified ADO variant: 10 µM
- Incubation: Conduct the reaction at 30°C for 2 hours with gentle agitation (300 rpm).
- Termination & Extraction: Stop the reaction by adding 200 µL of ethyl acetate. Vortex for 2 minutes, then centrifuge at 14,000 x g for 5 minutes. Collect the organic (top) layer.
- Analysis: Analyze the extract via GC-MS or GC-FID for alkane/alkene identification and quantification using authentic standards (e.g., pentadecane, heptadecene).
Protocol 2.2: High-Throughput Screening of AAR Variants for Activity
Objective: To quantify aldehyde production (AAR activity) in a microplate format. Method:
- Coupling Assay: Set up a 50 µL reaction containing standard buffer (Protocol 2.1), 0.05 mM acyl-ACP substrate, 2 µM AAR variant, and 2 U/mL aldehyde dehydrogenase (AldDH) from yeast.
- Detection: Include 0.2 mM NAD⁺ in the mix. The AldDH converts the AAR-generated aldehyde to a fatty acid, reducing NAD⁺ to NADH.
- Kinetic Measurement: Monitor the increase in absorbance at 340 nm (NADH) in a plate reader at 30°C for 30 minutes.
- Calculation: Calculate AAR activity using the extinction coefficient for NADH (ε₃₄₀ = 6220 M⁻¹cm⁻¹). Include controls with no enzyme and no substrate.
Data Presentation: Comparative Performance of Enzyme Variants
Table 1: Kinetic Parameters of Wild-Type vs. Engineered AAR Variants (on C16:0-ACP Substrate)
| Variant | kcat (min⁻¹) | Km (µM) | kcat/Km (min⁻¹µM⁻¹) | Total Alkane Yield (nmol/nmol enzyme)* |
|---|---|---|---|---|
| AAR (WT) | 4.2 ± 0.3 | 18.5 ± 2.1 | 0.23 | 0.85 ± 0.05 |
| AAR-F142L | 5.8 ± 0.4 | 14.2 ± 1.8 | 0.41 | 1.32 ± 0.08 |
| AAR-H185Q | 1.5 ± 0.2 | 45.6 ± 5.3 | 0.03 | 0.21 ± 0.03 |
*From full reconstituted pathway assay (Protocol 2.1), 2-hour timepoint.
Table 2: Alkane Profile from Reconstituted Pathway Using Different Substrates
| Fatty Acid Substrate (0.1 mM) | Primary Product (Theoretical) | % Conversion (GC Yield) | Major Detected Alkane(s) (GC-MS) |
|---|---|---|---|
| Dodecanoic (C12:0) | Undecane (C11) | 72% ± 4% | C11 (95%), C10 (5%) |
| Hexadecanoic (C16:0) | Pentadecane (C15) | 65% ± 5% | C15 (98%) |
| Octadecenoic (C18:1) | Heptadecene (C17:1) | 58% ± 6% | C17:1 (cis-9, 92%), C17:0 (8%) |
Visualized Pathways and Workflows
The Scientist's Toolkit: Key Research Reagent Solutions
| Item / Reagent | Function in Validation | Example Source / Note |
|---|---|---|
| Fatty acyl-ACP substrates | Native physiological substrate for AAR enzymes; essential for accurate kinetic measurement. | Synthesized in-house via E. coli holo-ACP synthase (AcpS) and acyl-ACP synthetase (AasS). |
| Purified AAR/ADO Variants | Catalytic components for the reconstituted pathway; purity >95% required for unambiguous results. | His-tagged proteins purified via Ni-NTA affinity chromatography from E. coli lysates. |
| NADPH (tetrasodium salt) | Essential reductant cofactor for the AAR enzymatic reaction. | High-purity, lyophilized powder; prepare fresh stock in buffer pH 7.0-8.0. |
| Aldehyde Dehydrogenase (AldDH) | Key enzyme for the high-throughput AAR activity coupling assay; converts product to detectable NADH. | Commercial Saccharomyces cerevisiae AldDH, used in kinetic coupling assay. |
| Alkane Standard Mix | Critical for GC-MS/FID method development, peak identification, and quantification. | Commercial C10-C20 alkane/alkene mix in hexane. |
| E. coli Acyl-CoA Synthetase | Enables use of free, non-activated fatty acids as pathway starting substrates. | Recombinant, purified E. coli FadD protein. |
Conclusion
Cell-free biocatalysis presents a powerful and flexible platform for the sustainable production of alka(e)nes from renewable fatty acids, offering precise control, high volumetric productivity, and the ability to bypass cellular complexity. This review has traversed the foundational science, practical assembly, critical optimization challenges, and rigorous validation required to advance the field. The key takeaway is that while significant progress has been made in understanding pathways and improving yields, future breakthroughs depend on reducing enzyme and cofactor costs, enhancing system robustness for industrial operation, and innovating in reactor design. For biomedical and clinical research, the implications extend beyond biofuels to the cell-free synthesis of labeled compounds, drug precursors, and novel biomaterials, positioning this technology as a cornerstone of the emerging bioeconomy. The next decade will likely see a shift from proof-of-concept studies to integrated, scalable processes that validate the commercial and therapeutic potential of cell-free alkane synthesis.