13C Metabolic Flux Analysis: A Comprehensive Guide from Foundational Principles to Advanced Applications in Biomedical Research
This article provides a comprehensive guide to 13C Metabolic Flux Analysis (13C-MFA), a cornerstone technique for quantifying intracellular metabolic fluxes in living cells.
13C Metabolic Flux Analysis: A Comprehensive Guide from Foundational Principles to Advanced Applications in Biomedical Research
Abstract
This article provides a comprehensive guide to 13C Metabolic Flux Analysis (13C-MFA), a cornerstone technique for quantifying intracellular metabolic fluxes in living cells. Tailored for researchers, scientists, and drug development professionals, it covers the foundational principles of isotopic tracing and metabolic steady-state assumptions. The scope extends to detailed, high-resolution protocols for experimental design, sample preparation, and data analysis using modern software platforms. It further addresses critical steps for troubleshooting, model optimization, and statistical validation to ensure robust and reproducible flux estimates. By synthesizing established best practices with recent methodological advances, this guide aims to empower the application of 13C-MFA in diverse areas, including metabolic engineering, biotechnology, and the investigation of disease mechanisms in cancer and neurodegeneration.
Understanding 13C-MFA: Core Principles and Its Role in Quantitative Systems Biology
Metabolic Flux Analysis (MFA), particularly 13C Metabolic Flux Analysis (13C-MFA), has emerged as a cornerstone technique in systems biology for quantifying in vivo metabolic pathway activities. By leveraging stable isotope tracers and sophisticated computational models, 13C-MFA provides an unparalleled capacity to elucidate the functional metabolic phenotype of cells, bridging the gap between genetic potential and observed physiological function. This application note delineates the core principles, detailed protocols, and unique capabilities of 13C-MFA, underscoring its transformative role in phenotyping across diverse fields from metabolic engineering to disease mechanism research [1] [2] [3].
Metabolic flux, defined as the in vivo conversion rate of metabolites through biochemical pathways, represents the ultimate functional output of cellular regulation. Understanding these fluxes is crucial for revealing the sites and mechanisms of metabolic regulation and how cells balance growth with maintenance under varying environmental conditions [1]. While genomics, transcriptomics, and proteomics describe the hierarchical blueprint of cellular potential, it is fluxomics—the quantitative analysis of metabolic fluxes—that characterizes the integrated metabolic phenotype. 13C-MFA stands as the most powerful and widely applied method in fluxomics, enabling the precise quantification of absolute flux values throughout central carbon metabolism [2] [4].
Core Principles and Classifications of Fluxomics
13C-based fluxomics has evolved into a diverse family of methods, each suited to specific experimental scenarios and system constraints [1].
Classification of 13C Metabolic Fluxomics Methods
Table 1: Classification and characteristics of major 13C metabolic fluxomics methods.
| Method Type | Applicable Scenario | Computational Complexity | Key Limitation |
|---|---|---|---|
| Qualitative Fluxomics (Isotope Tracing) | Any system | Easy | Provides only local, qualitative flux information [1] |
| Metabolic Flux Ratios Analysis | Systems where fluxes, metabolites, and labeling are constant | Medium | Provides only local, relative quantitative values [1] |
| Kinetic Flux Profiling (KFP) | Systems where fluxes and metabolites are constant but labeling is variable | Medium | Limited to local fluxes and relative quantification [1] |
| Stationary State 13C-MFA (SS-MFA) | Systems where fluxes, metabolites, and their labeling are constant | Medium | Not applicable to dynamic systems [1] [2] |
| Isotopically Instationary 13C-MFA (INST-MFA) | Systems where fluxes and metabolites are constant but labeling is variable | High | Not applicable to metabolically dynamic systems [1] [2] |
| Metabolically Instationary 13C-MFA | Systems where fluxes, metabolites, and labeling are all variable | Very High | Experimentally and computationally challenging [1] |
The fundamental principle underlying 13C-MFA is that the distribution of 13C labels from a labeled substrate into intracellular metabolites is uniquely determined by the activities of the metabolic pathways. By measuring these labeling patterns, one can infer the underlying metabolic flux distribution [4]. The process can be formalized as an optimization problem where flux values (v) are estimated by minimizing the difference between experimentally measured isotope labeling patterns (xM) and model-simulated patterns (x), subject to stoichiometric constraints (S·v = 0) and other physiological bounds [1].
The 13C-MFA Workflow: A Detailed Protocol
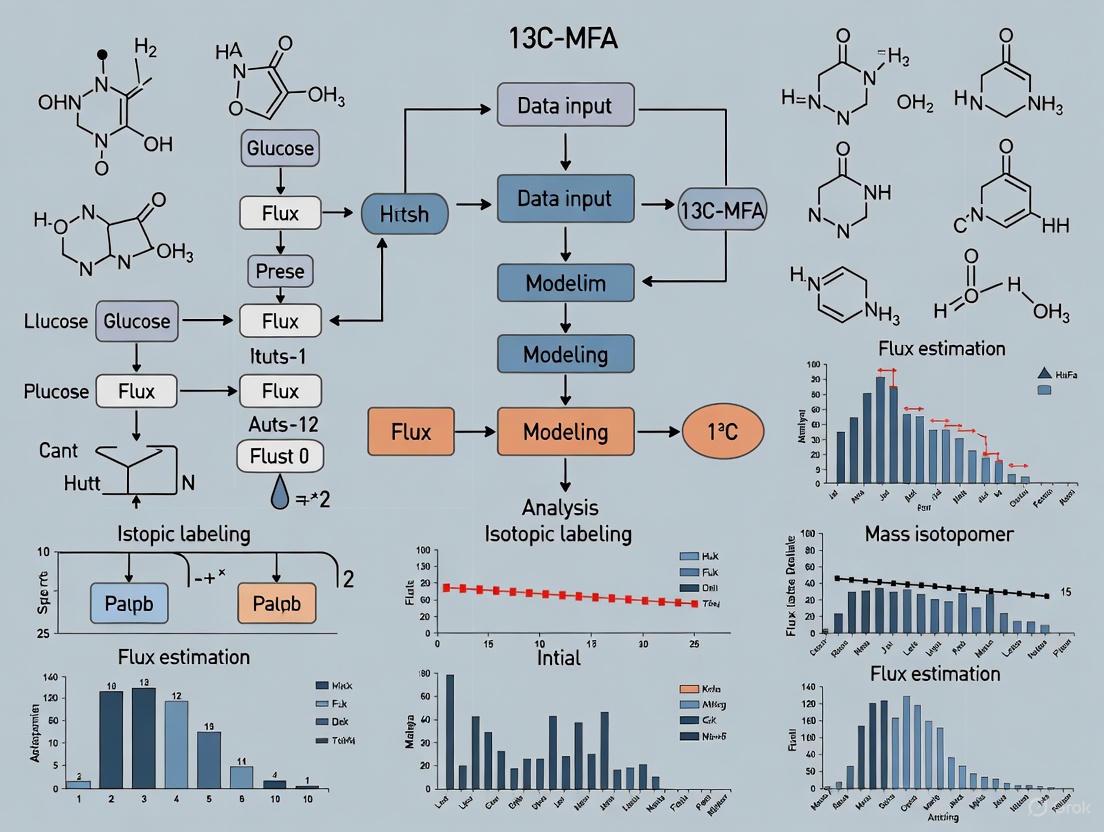
The execution of 13C-MFA involves a series of critical steps, from experimental design to statistical validation [2] [4]. The following diagram illustrates the integrated workflow.
Experimental Design and Tracer Selection
The first and most critical step is the selection of an appropriate 13C-labeled tracer. The choice depends on the biological question, the organism under study, and the specific pathways of interest [4].
- Common Tracers: Glucose is the most common carbon source, used in various labeling patterns such as [1-13C], [1,2-13C], or uniformly labeled [U-13C] glucose. The use of doubly labeled substrates (e.g., [1,2-13C] glucose) is recommended as it significantly improves the accuracy of flux estimation compared to single labels [4].
- Experimental Setup: To ensure metabolic steady state (constant metabolic fluxes) and isotopic steady state (static isotope incorporation), cells are cultured for an extended period—often more than five residence times—in a medium containing the chosen tracer. This can be achieved through prolonged incubation in bioreactors or controlled batch cultures where the cell growth rate is constant [2] [4].
Sample Collection, Quenching, and Metabolite Extraction
Once isotopic steady state is reached, metabolism is rapidly quenched, typically using cold methanol, to instantly halt all enzymatic activity and preserve the in vivo labeling patterns. Intracellular metabolites are then extracted using solvent systems like methanol/water or chloroform/methanol. This process must be optimized for completeness and reproducibility to ensure accurate flux determination [2].
Isotopic Labeling Measurement
The isotopic enrichment of extracted metabolites is measured using analytical techniques, primarily Mass Spectrometry (MS) and Nuclear Magnetic Resonance (NMR) Spectroscopy [1] [2].
- Gas Chromatography-MS (GC-MS): This is the most widely used technique due to its high sensitivity, precision, and ability to separate a broad range of metabolites. It provides mass isotopomer distribution data essential for flux calculation [2] [4].
- Liquid Chromatography-MS (LC-MS/MS): Excellent for analyzing less volatile compounds and can provide superior separation for complex metabolite mixtures [4].
- NMR Spectroscopy: While generally less sensitive than MS, NMR offers the unique advantage of providing positional labeling information for atoms within a molecule, which can greatly enhance flux resolution [2].
Flux Estimation and Computational Modeling
This is the computational core of 13C-MFA. The goal is to find the set of metabolic fluxes that best fits the experimentally measured isotope labeling patterns. This involves [1] [4]:
- Constructing a Stoichiometric Model: A network model encompassing the major metabolic pathways (e.g., glycolysis, PPP, TCA cycle) is built.
- Simulating Labeling Patterns: The model simulates the isotopic labeling of metabolites for a given set of trial fluxes.
- Non-Linear Regression: An optimization algorithm iteratively adjusts the flux values to minimize the difference (residual sum of squares, SSR) between the simulated and measured labeling data.
Software tools like INCA, OpenFLUX, and Metran that utilize the Elementary Metabolite Unit (EMU) framework have dramatically reduced the computational burden of this process [2] [4].
Statistical Analysis and Validation
The reliability of the estimated flux map must be rigorously assessed [4].
- Goodness-of-Fit: The minimized SSR is evaluated using χ² statistics to determine if the model adequately fits the data.
- Confidence Intervals: Sensitivity analysis or Monte Carlo simulations are performed to quantify the uncertainty and establish confidence intervals for each estimated flux. A flux is considered well-resolved if its confidence interval is within ±5-10% of the estimated value [4].
The Scientist's Toolkit: Essential Reagents and Materials
Table 2: Key research reagent solutions for 13C-MFA experiments.
| Item | Function/Description | Examples & Notes |
|---|---|---|
| 13C-Labeled Tracers | Carbon source for flux tracing; enables tracking of metabolic pathways. | [1,2-13C] Glucose, [U-13C] Glucose, 13C-Glutamine. Using mixtures of tracers can enhance flux resolution [2] [4]. |
| Cell Culture System | Provides a controlled environment for maintaining metabolic and isotopic steady state. | Bioreactors, chemostats, or well-controlled batch cultures [4]. |
| Quenching Solution | Instantly halts metabolic activity to preserve in vivo flux states. | Cold methanol or buffered aqueous methanol solutions [2]. |
| Extraction Solvents | Liberates intracellular metabolites for analysis. | Methanol/water, chloroform/methanol/water mixtures [2]. |
| Analytical Instrumentation | Measures the isotopic labeling patterns of metabolites. | GC-MS (most common), LC-MS/MS, NMR Spectroscopy [2] [4]. |
| Computational Software | Performs flux estimation by fitting models to experimental data. | INCA, OpenFLUX, Metran (often based on the EMU framework) [2] [4]. |
Unique Phenotyping Power and Applications
13C-MFA provides a dynamic, functional readout that static 'omics' data cannot, making it uniquely powerful for phenotyping.
- Revealing Pathway Activity: It can identify relative contributions of parallel pathways (e.g., glycolysis vs. pentose phosphate pathway), quantify flux through reversible reactions, and uncover the activity of redundant or cyclic pathways like the TCA cycle [1] [4].
- Metabolic Engineering: 13C-MFA is the "gold standard" for quantifying fluxes in living cells, guiding the rational redesign of metabolic networks in industrial microbes to optimize the production of target compounds like biofuels, chemicals, and pharmaceuticals [1] [2] [4].
- Disease Mechanism Research: The technique is instrumental in characterizing the metabolic reprogramming associated with diseases. It has been used to reveal flux alterations in cancer (e.g., colorectal adenocarcinomas), diabetes, retinal degenerative diseases, and immune cell activation, thereby identifying potential therapeutic targets [1] [3].
- Drug Discovery and Pharmacology: 13C-MFA helps elucidate the mechanisms of drug action and the emergence of drug resistance by characterizing changes in metabolic flux profiles in response to treatment [3].
The following diagram conceptualizes how 13C-MFA integrates data to reveal the functional metabolic phenotype, which is invisible to other analytical layers.
13C Metabolic Flux Analysis (13C-MFA) has emerged as a powerful technique for quantifying in vivo metabolic pathway activity in various biological systems, from microbes to mammalian cells [1]. It is considered the gold standard for quantifying the fluxes (conversion rates) of metabolites within living cells, providing a dynamic picture of metabolic phenotype that goes beyond static metabolomic measurements [4] [5]. The fundamental principle underpinning 13C-MFA is the systematic tracing of 13C-labeled atoms from specific substrates as they propagate through complex metabolic networks. The resulting isotopic patterns in intracellular metabolites are a rich source of information that, when interpreted through mathematical models, reveals the absolute in vivo fluxes of enzymatic reactions [1] [6].
This capability is crucial for understanding cellular physiology in both health and disease. In cancer biology, for instance, 13C-MFA has been instrumental in uncovering how cancer cells rewire their metabolism to support rapid proliferation, a phenomenon that extends beyond the classic Warburg effect to include pathways like reductive glutamine metabolism and serine/glycine biosynthesis [6]. The technique plays an important role in revealing patho-physiological mechanisms, identifying changes in metabolic pathway activity, and discovering novel metabolic pathways [1]. Furthermore, 13C-MFA is widely used in metabolic engineering to guide the optimization of target product synthesis, such as biofuels and pharmaceuticals [1] [4].
Fundamental Principles
Core Concept: From Labeling Patterns to Metabolic Fluxes
At its core, 13C-MFA is based on a straightforward but powerful concept: when a 13C-labeled substrate (e.g., glucose or glutamine) is introduced to a biological system and metabolized, the enzymatic reactions rearrange the carbon atoms, leading to specific isotope labeling patterns in downstream metabolites [6]. These patterns are highly sensitive to the relative fluxes of different pathways. For example, different flux distributions at a metabolic branch point will result in distinctly different isotopic enrichments in the products [4].
The relationship between the substrate's labeling state and the resulting intracellular labeling patterns is governed by the topology of the metabolic network and the specific atom transitions in each enzymatic reaction [1]. This relationship can be described mathematically. The flux estimation process in 13C-MFA is formalized as an optimization problem, where the goal is to find the set of fluxes that minimizes the difference between the experimentally measured isotope labeling patterns and those simulated by the model [1]. The general optimization problem can be represented as:
Where v is the vector of metabolic fluxes, S is the stoichiometric matrix, x is the vector of simulated isotope-labeled molecules, and x_M is the corresponding experimental measurement [1].
The Role of the Elementary Metabolite Unit (EMU) Framework
A key breakthrough in 13C-MFA was the development of the Elementary Metabolite Unit (EMU) framework, which allows for efficient simulation of isotopic labeling in large, complex biochemical networks [6] [7]. The EMU framework decomposes the complex problem of simulating isotope distributions by breaking down metabolites into smaller, manageable fragments ("EMUs") [7]. This framework significantly reduces the computational complexity of flux estimation and has been incorporated into user-friendly software tools like Metran and INCA, making 13C-MFA accessible to a broader scientific audience [6].
The following diagram illustrates the fundamental workflow of 13C-MFA, integrating both experimental and computational phases:
Experimental Protocols
Tracer Selection and Experimental Design
The first critical step in any 13C-MFA study is the careful selection of an appropriate 13C-labeled tracer. The choice of tracer depends on the biological question, the cell type under investigation, and the specific metabolic pathways of interest [6] [4].
- Common Tracers: Early 13C-MFA approaches often used various mixtures of [1-13C]glucose, [U-13C]glucose, and unlabeled glucose as substrates [1]. Currently, double-labeled substrates such as [1,2-13C]glucose are recommended because they can significantly improve the accuracy of flux estimation by providing more informative labeling patterns, despite their higher cost (~$600/g) [4].
- Parallel Labeling Experiments (PLEs): To further enhance flux resolution, the COMPLETE MFA approach employing multiple, complementary tracers in parallel experiments has been developed. For example, using all six singly labeled glucose tracers for E. coli flux analysis has resulted in the most accurate and precise flux parameters obtained to date [8]. This approach leverages the synergy of complementary information to resolve fluxes across different parts of the metabolic network [8].
Cell Culture and Sampling under Metabolic Steady State
A fundamental requirement for traditional 13C-MFA is that the system must be at metabolic and isotopic steady state [4]. This means that both the metabolic flux values and the isotopic labeling of intracellular metabolites are constant over time.
- Culture Conditions: Cells are cultured with the chosen 13C-labeled substrate as the carbon source. For microbial systems, this is often done in controlled bioreactors (chemostat or fed-batch), while mammalian cells are typically grown in T-flasks or bioreactors [6].
- Achieving Isotopic Steady State: The incubation time must be sufficient to ensure the system reaches an isotopic steady state. A common guideline is to extend the incubation for more than five residence times (the time required to replace the entire metabolite pool) [4]. For exponentially growing cells, this often means harvesting during the mid-exponential growth phase when the growth rate is constant.
- Sampling: Samples are collected for the measurement of extracellular rates (see below) and for the analysis of isotopic labeling in intracellular metabolites. Sampling typically involves rapid quenching of metabolism (e.g., using cold methanol), extraction of intracellular metabolites, and preparation for analysis by GC-MS or LC-MS [6].
Measurement of External Rates and Isotopic Labeling
Quantifying the cross-talk between the cells and their environment is essential for constraining the metabolic model.
- External Rates: This involves measuring the uptake rates of nutrients (e.g., glucose, glutamine) and the secretion rates of metabolic by-products (e.g., lactate, ammonium). The growth rate of the cells must also be determined precisely [6]. For exponentially growing cells, the growth rate (µ) is determined from the change in cell number over time. The external rate of a metabolite
i(r_i, in nmol/10^6 cells/h) can be calculated as:r_i = 1000 · (µ · V · ΔC_i) / ΔN_xwhereΔC_iis the change in concentration (mmol/L),ΔN_xis the change in cell number (millions), andVis the culture volume (mL) [6]. - Isotopic Labeling Measurement: The isotopic labeling of intracellular metabolites, such as amino acids or organic acids, is measured using Mass Spectrometry (GC-MS, LC-MS) or Nuclear Magnetic Resonance (NMR) spectroscopy [1] [6]. GC-MS is the most commonly used method due to its high sensitivity and precision [4]. Tandem MS (MS/MS) and LC-MS/MS are also employed to improve the resolution of complex metabolite spectra [4] [8].
Table 1: Key Analytical Techniques for Isotopic Labeling Measurement
| Technique | Key Features | Common Applications |
|---|---|---|
| GC-MS | High sensitivity, high precision, requires derivatization | Analysis of amino acids, organic acids |
| LC-MS/MS | Excellent for liquid samples, high separation ability | Analysis of complex metabolite spectra without derivatization |
| NMR | Provides structural information, non-destructive | Global metabolic information, positional isotopomer analysis |
Computational Flux Estimation and Statistical Validation
The computational phase translates the experimental data into a quantitative flux map.
- Flux Estimation: The measured extracellular fluxes and isotopic labeling data are integrated into a stoichiometric metabolic model. Using computational tools like OpenFLUX2, INCA, or 13CFLUX2, the intracellular fluxes are estimated by solving a non-linear least-squares optimization problem [8]. The algorithm iteratively adjusts the flux values in the model until the simulated labeling patterns best fit the experimental data [1] [6].
- Statistical Validation: After flux estimation, rigorous statistical analysis is required to validate the results.
- Goodness-of-fit: This is typically evaluated using the residual sum of squares (SSR), which should conform to a χ² distribution. A poor fit may indicate an incomplete metabolic model or low-quality data [4].
- Confidence Intervals: The precision of the estimated fluxes is assessed by calculating confidence intervals, often through sensitivity analysis or Monte Carlo simulation [4] [8].
Application Note: Metabolic Shift During Erythroid Differentiation
A recent study demonstrated the power of 13C-MFA to uncover metabolic shifts during cellular differentiation [9] [10]. The research aimed to understand the metabolic changes in K562 cells (a model cell line) before and after differentiation into erythroid cells (red blood cell precursors), a process critical for regenerative medicine.
Experimental Protocol:
- Cell Culture and Differentiation: K562 cells were cultured in RPMI 1640 medium and differentiated into erythroid cells by treatment with 1 mM sodium butyrate for four days. Successful differentiation was confirmed by a color change (red due to hemoglobin synthesis) and flow cytometry for surface markers CD71 and CD235a [10].
- 13C-Tracer Experiment: Both undifferentiated and differentiated cells were cultured with a 13C-labeled substrate (the specific tracer is not mentioned in the abstract, but [U-13C]glucose is a common choice).
- Flux Analysis: 13C-MFA was performed to quantify the fluxes in central carbon metabolism, including glycolysis, the pentose phosphate pathway, and the TCA cycle.
Key Findings: The 13C-MFA results revealed a significant metabolic reprogramming upon differentiation:
- Decreased Glycolytic Flux: Differentiated cells showed a reduction in the flow of carbon through glycolysis.
- Increased TCA Cycle Flux: The flux through the tricarboxylic acid (TCA) cycle was enhanced, indicating a shift towards oxidative metabolism [9] [10].
This flux-level insight provided a mechanistic understanding of the energy metabolism supporting erythroid differentiation. Furthermore, based on this finding, the researchers inhibited ATP synthase with oligomycin and found that it significantly suppressed K562 differentiation, functionally validating that the activation of oxidative metabolism is required for proper differentiation [9].
The metabolic shift observed in this study can be visualized as a change in flux distribution through the central metabolic network:
The Scientist's Toolkit
Successful implementation of 13C-MFA relies on a combination of specialized reagents, analytical instrumentation, and computational tools.
Table 2: Essential Research Reagent Solutions and Tools for 13C-MFA
| Category | Item | Function and Application Notes |
|---|---|---|
| Isotopic Tracers | [1,2-13C]Glucose | Provides complementary labeling information to resolve fluxes in pentose phosphate pathway, glycolysis, and TCA cycle [4]. |
| [U-13C]Glucose | Uniformly labeled tracer; useful for probing overall network activity and for parallel labeling experiments (PLEs) [8]. | |
| Analytical Instruments | GC-MS System | Workhorse for measuring isotopic labeling of amino acids and organic acids with high precision after derivatization [4]. |
| LC-MS/MS System | Used for analysis of a broader range of metabolites without derivatization; provides high sensitivity and resolution [4]. | |
| Software & Modeling | OpenFLUX2 | Open-source software for 13C-MFA, adjusted for comprehensive analysis of both single and parallel labeling experiments [8]. |
| INCA / Metran | User-friendly software tools incorporating the EMU framework, facilitating flux estimation for non-experts [6]. | |
| FluxML | A universal modeling language to unambiguously express and conserve all information for 13C-MFA model re-use and exchange [7]. |
Tracing 13C-labeled substrates through metabolic networks is the foundational principle that enables 13C-MFA to provide quantitative insights into the operational rates of metabolic pathways in living cells. The technique's power lies in the synergy between carefully designed tracer experiments, precise analytical measurements of isotopic labeling, and sophisticated computational modeling. As demonstrated in the erythroid differentiation case study, 13C-MFA can reveal critical, functionally validated metabolic shifts that underlie cellular processes. The continued development of standardized formats like FluxML for model sharing [7], robust open-source software like OpenFLUX2 for handling complex experimental designs [8], and comprehensive guidelines for publishing 13C-MFA studies [5] ensures that this methodology will remain a cornerstone for researchers in systems biology, metabolic engineering, and biomedical science.
In the realm of 13C metabolic flux analysis (13C-MFA), the accurate quantification of intracellular reaction fluxes hinges on clearly defined and experimentally controlled steady-state conditions [1]. Metabolic fluxes represent the in vivo conversion rates of metabolites, providing a dynamic perspective on cellular phenotype that static "omics" data cannot [1] [6]. 13C-MFA has emerged as the primary technique for quantifying these fluxes in various biological systems, from microorganisms to human cells [11] [6]. The power of 13C-MFA lies in integrating data from stable isotope tracer experiments with computational models to infer flux distributions that would otherwise be inaccessible to direct measurement [1]. Central to this methodology are two fundamental assumptions about system stability: metabolic steady state and isotopic steady state. This article delineates the distinctions between these concepts, their specific applications in 13C-MFA variants, and provides detailed protocols for their experimental implementation in research and drug development contexts.
Conceptual Foundations and Definitions
Metabolic Steady State
Metabolic steady state describes a condition where the net rates of formation and consumption for all intracellular metabolites are balanced, resulting in constant metabolite pool sizes over time [1]. This implies that metabolic fluxes—the flows through biochemical pathways—remain stable during the experimental period. In practical terms, the concentrations of intermediates in central carbon metabolism (e.g., glycolytic intermediates, TCA cycle metabolites) do not exhibit net accumulation or depletion. This steady state is typically maintained in exponentially growing cells where growth conditions are optimized and nutrient limitations are avoided [6]. The metabolic steady state is a foundational assumption for most 13C-MFA approaches, as it allows for the simplification of complex dynamic systems to tractable models with constant flux parameters.
Isotopic Steady State
Isotopic steady state (also called isotope stationarity) represents a condition where the fractional labeling of all metabolite pools remains constant over time [12] [1]. This occurs when the incorporation of the heavy isotope (e.g., 13C) from the labeled tracer has reached equilibrium throughout the metabolic network. At isotopic steady state, the pattern of isotope labeling—whether measured as mass isotopomer distributions (MIDs) or positional enrichments—no longer changes, reflecting a balance between the influx of labeled atoms from the tracer and the efflux of labeled atoms through metabolic reactions [4]. The time required to reach isotopic steady state varies significantly depending on the organism, growth rate, and the specific metabolite pool sizes, ranging from hours for microbial systems to days for slower-growing mammalian cells [6].
Table 1: Key Characteristics of Steady-State Conditions in 13C-MFA
| Characteristic | Metabolic Steady State | Isotopic Steady State |
|---|---|---|
| Definition | Constant metabolite concentrations & fluxes over time | Constant isotope labeling patterns over time |
| Governed By | Metabolic reaction rates & pool sizes | Atom transition rates & labeling input |
| Typical Time to Achieve | Several cell doublings | Varies from hours to days |
| Primary Application | Stationary State 13C-MFA (SS-MFA) | Stationary State 13C-MFA (SS-MFA) |
| Measurement Focus | Extracellular rates & growth kinetics | Mass isotopomer distributions (MIDs) |
Methodological Approaches and Experimental Design
Stationary State 13C-MFA (SS-MFA)
Stationary State 13C-MFA requires both metabolic and isotopic steady state assumptions [1]. This approach involves growing cells on a 13C-labeled substrate until full isotopic equilibrium is reached, typically requiring incubation for more than five residence times to ensure complete isotope mixing [4]. The methodology is particularly powerful for quantifying fluxes in complex networks with parallel pathways, reversible reactions, and metabolic cycles [11]. SS-MFA has been successfully applied to study microbial physiology, plant metabolism, and cancer cell lines [12] [6].
Protocol 1: Implementing SS-MFA for Mammalian Cell Cultures
Experimental Setup
- Culture cells in appropriate medium until exponential growth phase is established.
- Replace medium with identical formulation containing 13C-labeled tracer (e.g., [U-13C]glucose or [1,2-13C]glucose).
- Maintain culture for sufficient duration to reach isotopic steady state (typically 24-72 hours for mammalian cells, depending on doubling time).
Sampling and Quenching
- Collect cells at multiple time points to verify steady-state conditions.
- Rapidly quench metabolism using cold methanol or specialized quenching solutions.
- Separate cells from medium by centrifugation (500 × g, 5 min, 4°C).
Metabolite Extraction
- Resuspend cell pellet in 1 mL of 80% methanol (-20°C) and vortex vigorously.
- Incubate for 15 minutes at -20°C.
- Centrifuge at 16,000 × g for 15 minutes at 4°C.
- Transfer supernatant to a new tube and evaporate solvent under nitrogen stream.
- Store dried extracts at -80°C until analysis.
Data Acquisition
- Reconstitute samples in appropriate solvent for LC-MS or GC-MS analysis.
- Measure mass isotopomer distributions of intracellular metabolites.
- Quantify extracellular substrate consumption and product secretion rates.
Flux Analysis
Isotopically Nonstationary MFA (INST-MFA)
Isotopically Nonstationary MFA (INST-MFA) relaxes the requirement for isotopic steady state while maintaining the assumption of metabolic steady state [12] [1]. This approach utilizes time-resolved labeling data collected during the transition toward isotopic steady state. INST-MFA is particularly valuable for systems where achieving isotopic steady state is impractical or where isotopic stationarity provides insufficient information flux estimation, such as in autotrophic organisms or for nitrogen metabolism studies [12].
Protocol 2: INST-MFA for Rapid Kinetic Flux Profiling
Tracer Pulse Design
- Grow cells to exponential phase in standard medium.
- Rapidly introduce 13C-labeled tracer without disrupting metabolic state.
- Collect samples at high temporal resolution (seconds to minutes) immediately after tracer introduction.
Rapid Sampling Protocol
- Use automated sampling systems for high-time-resolution experiments.
- Quench metabolism instantaneously upon sampling.
- Preserve samples at -80°C until extraction.
Analytical Considerations
- Measure both mass isotopomer distributions and absolute concentrations.
- Focus on metabolites with rapid turnover times (e.g., glycolytic intermediates).
- Utilize LC-MS/MS for enhanced sensitivity and specificity.
Computational Modeling
- Implement systems of ordinary differential equations describing isotopomer dynamics.
- Estimate fluxes by fitting simulated labeling time courses to experimental data.
- Apply local approaches (KFP, NSMFRA, ScalaFlux) for subnetwork flux analysis [12].
Table 2: Comparative Analysis of SS-MFA vs. INST-MFA
| Parameter | SS-MFA | INST-MFA |
|---|---|---|
| Required Assumptions | Metabolic & isotopic steady state | Metabolic steady state only |
| Experimental Duration | Longer (days) | Shorter (minutes to hours) |
| Data Requirements | Single time point at isotopical stationarity | Multiple time points during labeling kinetics |
| Computational Complexity | Medium | High |
| Best Suited For | Heterotrophic systems | Autotrophic systems, nitrogen metabolism |
| Information Obtained | Global flux map | Localized fluxes with temporal resolution |
The Scientist's Toolkit: Essential Research Reagents and Materials
Table 3: Key Research Reagent Solutions for 13C-MFA Studies
| Reagent/Material | Function | Example Applications |
|---|---|---|
| [1,2-13C]Glucose | Dual-labeled tracer for improved flux resolution | Precise quantification of PPP flux, glycolytic entry points [4] |
| [U-13C]Glucose | Uniformly labeled tracer for comprehensive labeling | Broad assessment of central carbon metabolism [14] |
| [U-13C]Glutamine | Essential amino acid tracer for nitrogen metabolism | Analysis of TCA cycle, reductive carboxylation in cancer cells [6] |
| GC-MS System | Measurement of mass isotopomer distributions | Quantification of 13C incorporation into proteinogenic amino acids [4] |
| LC-MS/MS System | High-sensitivity analysis of labile metabolites | Measurement of glycolytic & TCA cycle intermediates [15] |
| INCA Software | Integrated flux analysis platform | Comprehensive 13C-MFA modeling & statistical validation [6] |
| Metran Software | Flux estimation tool using EMU framework | Efficient simulation of isotopic labeling patterns [6] |
The distinction between metabolic steady state and isotopic steady state represents a fundamental conceptual and practical consideration in 13C-MFA experimental design. SS-MFA, requiring both conditions, provides a robust framework for comprehensive flux quantification in established model systems. In contrast, INST-MFA, requiring only metabolic steady state, offers flexibility for studying specialized metabolic scenarios and provides temporal resolution of labeling kinetics. The choice between these approaches should be guided by biological context, experimental constraints, and specific research questions. As 13C-MFA continues to evolve, with applications expanding to human patients and complex disease models, rigorous attention to these foundational assumptions remains paramount for generating physiologically relevant and statistically valid flux measurements [16] [14].
Metabolic flux analysis represents a cornerstone of quantitative systems biology, providing crucial insights into the integrated functional phenotype of living systems by determining the rates of biochemical reactions within metabolic networks [17]. Among the various techniques developed for flux quantification, 13C-Metabolic Flux Analysis (13C-MFA) stands as a gold standard approach, particularly in metabolic engineering and biotechnology [18]. However, 13C-MFA exists within a broader ecosystem of fluxomic methods, each with distinct principles, applications, and limitations. This article provides a systematic comparison of 13C-MFA against three other prominent techniques: Flux Balance Analysis (FBA), Isotopically Nonstationary Metabolic Flux Analysis (INST-MFA), and Dynamic Metabolic Flux Analysis (DMFA). Understanding the relative strengths and optimal application domains of each method is essential for researchers selecting the most appropriate tool for investigating specific biological questions in microbial, plant, or mammalian systems.
Methodological Comparison of Fluxomic Techniques
The core distinction between fluxomic methods lies in their foundational assumptions, data requirements, and computational approaches. The following table provides a systematic comparison of the four methods, highlighting their key characteristics.
Table 1: Comparative overview of major fluxomic methods
| Feature | 13C-MFA | FBA | INST-MFA | DMFA |
|---|---|---|---|---|
| Primary Principle | Fitting fluxes to isotopic steady-state data [2] | Linear optimization of an objective function [17] | Fitting fluxes to transient isotopic labeling data [2] [19] | Estimating flux changes across multiple time intervals [2] |
| Metabolic Steady State | Required [18] | Required | Required [2] | Not required |
| Isotopic Steady State | Required [2] [19] | Not applicable | Not required; uses transient data [2] [19] | Can be applied, but not assumed |
| Key Data Inputs | Extracellular rates, Mass Isotopomer Distributions (MIDs) [17] | Stoichiometric model, exchange constraints, objective function [17] | Time-course MIDs, pool sizes [19] [12] | Multiple sets of extracellular rates/MIDs over time [2] |
| Typical Network Scale | Core metabolism (10s-100s of reactions) [2] | Genome-scale (1000s of reactions) [2] [18] | Core metabolism [12] | Core metabolism |
| Key Output | Accurate, absolute fluxes through central carbon pathways [18] | Predicted flux distribution based on optimization principle [20] | Absolute fluxes, without waiting for isotopic steady state [2] | Dynamic flux maps showing flux changes over time [2] |
| Major Strength | High precision and accuracy for central carbon metabolism [18] | Scalability to genome-wide networks; no need for isotopic tracers [17] [2] | Speed (avoids long incubation times); application to autotrophic systems [2] [12] | Captures dynamic, non-steady-state physiological transitions [2] |
| Major Limitation | Limited to networks where isotopic steady state is achievable [2] | Relies on a pre-defined objective function, which may not reflect biological reality [20] | Computational complexity of solving differential equations [2] [19] | High data demand and computational complexity [2] |
Experimental Protocols and Workflows
Protocol for 13C-MFA
Objective: To quantify absolute intracellular metabolic fluxes at metabolic and isotopic steady state.
Workflow Steps:
- Experimental Design: Select an appropriate 13C-labeled tracer (e.g., [1,2-13C]glucose, [U-13C]glucose) based on the metabolic pathways of interest [2] [21].
- Cell Cultivation: Grow cells in a controlled bioreactor. Replace the natural abundance carbon source with the defined 13C-labeled substrate once the culture reaches metabolic steady state (constant metabolite concentrations and growth rate) [2].
- Isotopic Steady-State Achievement: Continue cultivation until the isotopic labeling of intracellular metabolites no longer changes (typically requiring several generations) [2].
- Metabolite Quenching & Extraction: Rapidly quench cellular metabolism (e.g., using cold methanol) and perform intracellular metabolite extraction [2].
- Mass Isotopomer Measurement: Analyze the extracted metabolites using GC-MS or LC-MS to obtain Mass Isotopomer Distribution (MID) data [2] [19].
- Computational Flux Estimation: Use specialized software (e.g., 13CFLUX, Iso2Flux) to find the flux map that minimizes the difference between the simulated and experimentally measured MIDs, subject to stoichiometric constraints [17] [22] [20].
Figure 1: A standard workflow for a 13C-MFA experiment.
Protocol for INST-MFA
Objective: To quantify metabolic fluxes without the need to reach isotopic steady state, enabling faster experiments and studies of autotrophic systems like plants.
Workflow Steps:
- Tracer Pulse: Introduce a 13C-labeled substrate (e.g., 13CO2 for plant studies) to a system already at metabolic steady state [2] [12].
- Rapid Sampling: Collect multiple samples over short time intervals (seconds to minutes) immediately after tracer introduction [2].
- Metabolite Extraction: Rapidly quench and extract metabolites from each sample.
- Time-Course MID Measurement: Analyze the MIDs of intracellular metabolites for each time point using MS [12].
- Flux Estimation with Pool Sizes: Use computational models (e.g., based on Elementary Metabolite Units - EMUs) that incorporate metabolite pool sizes and solve ordinary differential equations to fit the time-course labeling data and estimate fluxes [19] [12].
Protocol for FBA
Objective: To predict genome-scale flux distributions based on stoichiometric constraints and an assumed biological objective.
Workflow Steps:
- Network Reconstruction: Build a genome-scale stoichiometric model (S-matrix) incorporating all known metabolic reactions for the organism [18].
- Define Constraints: Apply constraints based on experimental data (e.g., substrate uptake rates, oxygen consumption) and/or thermodynamic considerations [17].
- Select Objective Function: Define a linear objective function to be optimized (e.g., maximize biomass growth, maximize ATP production, or minimize total flux) [17] [20].
- Linear Programming: Use linear optimization algorithms to find a flux distribution that satisfies the constraints and optimizes the objective function [17] [18].
Protocol for DMFA
Objective: To estimate how metabolic fluxes change over time during a dynamic fermentation process.
Workflow Steps:
- Experiment Segmentation: Divide a non-steady-state culture (e.g., a fed-batch fermentation) into multiple discrete time intervals [2].
- Interval Analysis: For each time interval, measure the extracellular fluxes, such as substrate consumption and product formation rates [2].
- Data Integration: Apply a computational framework that assumes relatively slow flux transients (on the order of hours) and calculates a distinct flux map for each time interval based on the measured data [2]. 13C-DMFA can be performed by integrating isotopic labeling data from multiple time points [2].
The Scientist's Toolkit: Key Research Reagents and Software
Successful execution of flux analysis requires a combination of wet-lab reagents and sophisticated computational tools.
Table 2: Essential research reagents and software solutions for fluxomics
| Category | Item | Function and Application |
|---|---|---|
| Stable Isotope Tracers | 13C-Labeled Substrates (e.g., [1,2-13C]Glucose, [U-13C]Glucose, 13C-Glutamine) | Serve as the carbon source for tracing experiments; the specific labeling pattern informs on different pathway activities [2] [21]. |
| Analytical Instruments | Gas Chromatography-Mass Spectrometry (GC-MS) / Liquid Chromatography-MS (LC-MS) | Workhorse platforms for measuring the Mass Isotopomer Distribution (MID) of metabolites in 13C-MFA and INST-MFA [2] [19]. |
| Software for 13C-MFA/INST-MFA | 13CFLUX(v3) | A high-performance, open-source platform for both isotopically stationary and nonstationary 13C-MFA, supporting multi-tracer studies and Bayesian analysis [22]. |
| INCA | A widely used software for INST-MFA, implementing the EMU framework [12]. | |
| Iso2Flux | An open-source software for 13C-MFA that includes implementations like parsimonious 13C-MFA (p13CMFA) for integrating transcriptomic data [20]. | |
| Software for FBA | COBRA Toolbox / cobrapy | Standard software toolboxes for Constraint-Based Reconstruction and Analysis (COBRA), enabling FBA and related algorithms [17] [23]. |
| Computational Frameworks | ML-Flux | An emerging machine learning framework that uses neural networks to map isotope patterns to metabolic fluxes, offering rapid computation [21]. |
Logical Decision Framework for Method Selection
Choosing the most appropriate fluxomic method depends on the biological question, the system under study, and practical experimental constraints. The following diagram outlines a logical decision pathway.
Figure 2: A decision framework for selecting the most suitable fluxomic method.
13C-MFA, FBA, INST-MFA, and DMFA each offer unique capabilities for quantifying metabolic fluxes. 13C-MFA remains the gold standard for obtaining highly accurate and precise flux maps of core metabolism under steady-state conditions. In contrast, FBA provides a scalable, genome-scale predictive framework that is less dependent on experimental data but relies on the correct specification of an objective function. INST-MFA breaks the key limitation of 13C-MFA by forgoing the need for isotopic steady state, opening doors to studying systems like photosynthetic organisms and enabling faster experiments. Finally, DMFA extends the flux analysis paradigm to dynamic bioprocesses, capturing transient metabolic physiological changes. The choice of method is not a question of which is universally best, but which is the most appropriate tool for the specific biological system, scientific question, and experimental constraints at hand. The ongoing development of more powerful software and integration with machine learning promises to further enhance the accessibility, speed, and scope of all fluxomic methods [21] [22].
13C Metabolic Flux Analysis (13C-MFA) has emerged as a powerful model-based technique for quantifying intracellular metabolic fluxes in living cells [11]. By tracing stable isotope-labeled nutrients (e.g., 13C-glucose) through metabolic pathways, 13C-MFA enables researchers to determine the in vivo rates of enzymatic reactions and transport processes that define cellular phenotype [6] [1]. Unlike other omics technologies that provide static snapshots of cellular components, 13C-MFA delivers dynamic information about the functional activity of metabolic networks, making it indispensable for both basic research and applied biotechnology [11]. Over the past two decades, 13C-MFA has evolved from a specialized methodology used by a handful of expert groups to a standardized tool with diverse applications across metabolic engineering, systems biology, and biomedical research [11] [6].
The core principle of 13C-MFA involves feeding cells with 13C-labeled substrates, measuring the resulting isotope labeling patterns in intracellular metabolites, and using computational modeling to infer the metabolic flux map that best explains the experimental data [1]. This approach provides significant advantages over alternative flux estimation methods like flux balance analysis, as it can accurately resolve fluxes through parallel pathways, metabolic cycles, and reversible reactions [11]. With the development of user-friendly software tools and standardized protocols, 13C-MFA is now accessible to a broader scientific community, enabling unprecedented insights into cellular metabolism under various physiological and pathological conditions [6].
Key Applications of 13C-MFA
13C-MFA has become a fundamental tool across multiple research domains, each leveraging its capability to quantify metabolic phenotype with precision. The table below summarizes the core application areas and their specific focus.
Table 1: Key Application Areas of 13C-MFA
| Application Area | Primary Research Focus | Representative Organisms/Cells |
|---|---|---|
| Metabolic Engineering | Optimizing cell factories for bioproduction; Revealing pathway limitations [11] [1] | E. coli, Yeast, Industrial cell lines |
| Biomedical Research | Understanding metabolic rewiring in disease; Identifying therapeutic targets [6] | Cancer cells, Neural cells, Immune cells |
| Systems Biology | Quantitative modeling of cellular metabolism; Understanding metabolic regulation [11] [1] | Model organisms (e.g., E. coli, B. subtilis) |
| Biotechnology | Improving product yields and cellular productivity in bioprocesses [11] | Chinese Hamster Ovary (CHO) cells, Microbial production strains |
Metabolic Engineering and Biotechnology
In metabolic engineering, 13C-MFA serves as a cornerstone for rational design of microbial cell factories. By quantifying carbon routing through central metabolism, researchers can identify flux bottlenecks, quantify the yield of alternative pathways, and validate the functional impact of genetic modifications [11]. This has proven crucial for optimizing the production of valuable compounds such as acetaldehyde, isopropanol, and vitamin B2 [1]. For instance, in E. coli and yeast, 13C-MFA has been used to elucidate the relative contributions of glycolysis, the pentose phosphate pathway, and the Entner-Doudoroff pathway, guiding engineering strategies to enhance precursor supply for target molecules [13]. In industrial biotechnology, 13C-MFA is applied to cell lines like Chinese Hamster Ovary (CHO) cells to understand their metabolic physiology and engineer more efficient phenotypes for recombinant protein production [11] [6].
Biomedical and Disease Research
The application of 13C-MFA in biomedical research, particularly in cancer biology, has transformed our understanding of metabolic reprogramming in disease states. The technique has been instrumental in quantifying the Warburg effect (aerobic glycolysis) and uncovering other dysregulated pathways in cancer cells, including reductive glutamine metabolism, serine and glycine biosynthesis, and one-carbon metabolism [6]. By providing absolute flux values, 13C-MFA moves beyond qualitative gene expression data to reveal how cancer cells fundamentally reorganize their metabolic networks to support rapid proliferation, survival, and resistance to therapy. Beyond oncology, 13C-MFA is increasingly applied to study metabolic alterations in neural cells, immune cells, and in pathological conditions such as diabetes and retinal degenerative diseases [1]. This detailed flux information helps in identifying critical metabolic dependencies that can be exploited for therapeutic intervention.
Experimental Protocol: 13C-MFA in Cancer Cell Metabolism
This protocol details a standard workflow for employing stationary state 13C-MFA (SS-MFA) to investigate the metabolic fluxes of cancer cells in culture, such as HeLa or MCF-7 cells [6] [1].
Stage 1: Cell Culture and Tracer Experiment
Objective: To cultivate cancer cells and introduce a 13C-labeled substrate for metabolic labeling.
Materials:
- Cancer cell line of interest (e.g., MCF-7, HeLa)
- Appropriate cell culture medium (e.g., DMEM, RPMI-1640)
- 13C-labeled substrate (e.g., [U-13C]glucose, [1,2-13C]glucose)
- Cell culture flasks/dishes
- Standard cell culture incubator (37°C, 5% CO2)
Procedure:
- Culture Expansion: Maintain cells in standard growth medium and passage as needed to ensure logarithmic growth.
- Experimental Seeding: Seed an appropriate number of cells into multiple culture vessels to achieve a desired initial cell density (e.g., 0.5 × 10^6 cells per T-25 flask).
- Tracer Introduction:
- Once cells are attached and stabilized, remove the standard growth medium.
- Wash the cell monolayer gently with pre-warmed phosphate-buffered saline (PBS).
- Add fresh medium containing the 13C-labeled tracer. A common starting point is 100% [U-13C]glucose as the sole glucose source.
- Return cells to the incubator.
- Sampling: Culture cells for a sufficient duration to achieve isotopic steady state in central metabolites (typically 24-48 hours for many mammalian cell lines). Harvest cells and medium at multiple time points (e.g., 0, 24, and 48 hours) for subsequent analysis.
Stage 2: Data Collection and Measurement
Objective: To quantify external metabolic rates and measure isotopic labeling.
Materials:
- Hemocytometer or automated cell counter
- Metabolite concentration analyzer (e.g., HPLC, Bioprofile Analyzer)
- Gas Chromatography-Mass Spectrometry (GC-MS) system
- Quenching solution (e.g., cold methanol)
- Derivatization reagents (e.g., MSTFA for GC-MS)
Procedure:
- Growth and External Rate Quantification:
- At each sampling point, detach and count cells to determine cell density.
- Collect culture medium and analyze concentrations of key metabolites (glucose, lactate, glutamine, glutamate, amino acids).
- Calculate the specific growth rate (µ, 1/h) using the exponential growth equation and external metabolite rates (nmol/10^6 cells/h) using established formulas [6].
- Isotopic Labeling Measurement:
- For intracellular labeling analysis, quickly quench cell metabolism (e.g., with cold methanol) and extract intracellular metabolites.
- Derivatize metabolites (e.g., proteinogenic amino acids from hydrolyzed cell pellets) for analysis by GC-MS.
- Acquire mass isotopomer distributions (MIDs) for the fragments of interest.
Table 2: Key Research Reagents and Materials
| Reagent/Material | Function/Application | Example/Note |
|---|---|---|
| [U-13C]Glucose | Tracer for mapping carbon fate through glycolysis, TCA cycle, and anabolic pathways [6] | Commonly used as 100% tracer or in mixtures |
| GC-MS Instrument | Analytical workhorse for measuring Mass Isotopomer Distributions (MIDs) [13] [1] | Provides high-sensitivity data for 13C-MFA |
| Metabolic Network Model | Computational representation of the biochemical reactions used for flux simulation and estimation [11] | Must include atom transitions for 13C-MFA |
| Software (INCA, Metran) | User-friendly platforms for flux estimation, goodness-of-fit, and confidence interval analysis [6] | Implements the EMU framework for efficient calculation |
Stage 3: Computational Flux Analysis
Objective: To estimate intracellular metabolic fluxes and their confidence intervals from the collected data.
Materials:
- 13C-MFA software (e.g., INCA, Metran, OpenMebius)
- Metabolic network model of central carbon metabolism
- Computer workstation
Procedure:
- Model Definition: Import a stoichiometric model of central carbon metabolism (glycolysis, PPP, TCA cycle, etc.) that includes atom transition information for each reaction [13].
- Data Input: Provide the software with:
- The measured external flux data (growth rate, uptake/secretion rates).
- The uncorrected mass isotopomer distributions (MIDs) from GC-MS [11].
- The labeling pattern of the input tracer(s).
- Flux Estimation:
- The software performs a non-linear least-squares regression to find the set of intracellular fluxes that best fit the measured MIDs.
- The optimization minimizes the residual sum of squares (RSS) between the simulated and measured data [13].
- Statistical Analysis:
Visualizing Workflows and Pathways
The following diagrams, created using the specified color palette and contrast guidelines, illustrate the core workflow of 13C-MFA and the central metabolic pathways it probes.
13C-MFA Core Workflow
Central Carbon Metabolism Pathways
Executing 13C-MFA: A Step-by-Step Protocol from Cell Culture to Flux Estimation
13C Metabolic Flux Analysis (13C-MFA) has emerged as a cornerstone technique for quantifying intracellular metabolic fluxes in living cells, providing critical insights for metabolic engineering, bioprocess optimization, and biomedical research [24] [6]. The precision and accuracy of flux determinations depend significantly on the strategic selection of isotopic tracers and experimental design. A key advancement in the field is the use of parallel labeling experiments (COMPLETE-MFA), where multiple complementary tracer experiments are conducted and analyzed simultaneously to dramatically improve flux resolution [25] [26]. This protocol outlines systematic approaches for selecting optimal tracers and designing parallel labeling strategies to maximize flux information content while considering practical experimental constraints.
Tracer Selection Fundamentals
Essential Concepts in 13C-MFA
The core principle of 13C-MFA involves feeding cells with 13C-labeled substrates and tracing the incorporation of labeled carbon atoms through metabolic pathways. As these substrates undergo enzymatic reactions, carbon atoms are rearranged, creating specific labeling patterns in downstream metabolites that can be measured using techniques such as mass spectrometry (MS) or nuclear magnetic resonance (NMR) [24] [6]. The measured labeling data are then integrated with a metabolic network model to compute intracellular fluxes through a parameter estimation process [6].
The selection of an appropriate isotopic tracer is crucial because different tracers illuminate different metabolic pathways with varying effectiveness. A well-chosen tracer produces distinct labeling patterns for alternative metabolic routes, enabling accurate flux quantification, while a poor tracer choice may fail to resolve fluxes between competing pathways [25].
Evaluation Metrics for Tracer Performance
Two key metrics have been developed to quantitatively evaluate tracer performance:
Precision Score (P): This metric quantifies the improvement in flux precision for a given tracer experiment relative to a reference tracer. It is calculated as the average of individual flux precision scores (p_i) for n fluxes of interest [25]:
where UB95,i and LB95,i represent the upper and lower 95% confidence intervals for flux i. A precision score >1 indicates improved performance over the reference tracer.
Synergy Score (S): This metric quantifies the additional information gained by combining multiple parallel labeling experiments compared to analyzing them separately. It is calculated as [25]:
where pi,1+2 is the precision score for the parallel experiment, and pi,1 and p_i,2 are the precision scores for individual experiments. A synergy score >1 indicates a greater-than-expected gain in flux information through complementary tracer use.
Optimal Tracer Selection
Performance of Single Tracers
Table 1: Performance Characteristics of Select Glucose Tracers
| Tracer Type | Example | Relative Cost | Flux Precision | Key Applications |
|---|---|---|---|---|
| Singly labeled | [1-13C]glucose | Low (~$100/g) [4] | Moderate | Basic flux mapping |
| Doubly labeled | [1,2-13C]glucose | High (~$600/g) [4] | High | Overall central metabolism |
| Position-specific | [1,6-13C]glucose | High | Very high | Glycolysis and PPP |
| Uniformly labeled | [U-13C]glucose | Moderate | Variable | Comprehensive coverage |
| Mixture | 80% [1-13C]glucose + 20% [U-13C]glucose | Moderate | Moderate | Common practice benchmark |
Research evaluating thousands of tracer schemes has identified doubly 13C-labeled glucose tracers as consistently superior for single-tracer experiments [25]. The best-performing single tracers include [1,6-13C]glucose, [5,6-13C]glucose, and [1,2-13C]glucose, which produce the highest flux precision scores across diverse metabolic networks. These tracers outperform the commonly used tracer mixture of 80% [1-13C]glucose + 20% [U-13C]glucose [25].
An important finding is that pure glucose tracers generally perform better than glucose tracer mixtures for single-tracer experiments [25]. This challenges conventional practices of using tracer mixtures and highlights the value of systematic tracer evaluation.
Tracer Selection for Specific Applications
Different metabolic systems and research questions may benefit from specialized tracer selection:
- Mammalian cell systems: For cancer metabolism studies, [1,2-13C]glucose has been identified as excellent for resolving the phosphoglucoisomerase flux and other fluxes in central carbon metabolism [27].
- Microbial systems: In E. coli studies, different tracers excel for different parts of metabolism. The mixture 75% [1-13C]glucose + 25% [U-13C]glucose performs best for upper metabolism (glycolysis, PPP), while [4,5,6-13C]glucose and [5-13C]glucose optimize flux resolution in lower metabolism (TCA cycle, anaplerotic reactions) [26].
- COMPLETE-MFA: For parallel labeling approaches, the optimal pair is [1,6-13C]glucose and [1,2-13C]glucose, which combined improve flux precision nearly 20-fold compared to the standard 80% [1-13C]glucose + 20% [U-13C]glucose mixture [25].
Parallel Labeling Strategies
COMPLETE-MFA Framework
The COMPLETE-MFA (COMPlementary Parallel Labeling Experiments Technique for Metabolic Flux Analysis) approach represents the current gold standard in fluxomics [26]. This methodology involves:
- Designing multiple tracer experiments with complementary labeling patterns
- Growing cells in parallel under identical conditions but with different tracers
- Collecting labeling data for each experiment
- Simultaneously fitting all labeling datasets to a single metabolic model
The power of COMPLETE-MFA stems from its ability to provide more comprehensive labeling information, improving both flux precision and flux observability (the number of independent fluxes that can be resolved) [26]. This approach is particularly valuable for quantifying exchange fluxes (reversible reactions) and resolving parallel pathway activities that are difficult to characterize with single tracers.
Implementation Protocol
Table 2: Protocol for Parallel Labeling Experiments
| Step | Procedure | Key Considerations |
|---|---|---|
| 1. Experimental Design | Select 2-4 complementary tracers based on precision scores | Balance information content with experimental cost [27] |
| 2. Culture Conditions | Establish reproducible, controlled growth conditions | Use identical inoculum, medium composition, and environmental parameters [26] |
| 3. Tracer Administration | Add specific tracers to parallel cultures | Use equal carbon amounts; verify tracer purity and composition |
| 4. Sampling | Collect samples during metabolic and isotopic steady state | For microbial systems: mid-exponential phase; ensure >5 residence times for isotope steady state [4] |
| 5. Labeling Measurement | Analyze mass isotopomer distributions | Use GC-MS or LC-MS platforms; include technical replicates |
| 6. Data Integration | Simultaneously fit all labeling datasets | Use appropriate software (INCA, Metran, 13CFLUX); validate model fit [22] |
The following workflow diagram illustrates the COMPLETE-MFA process:
Scaling and Applications
Large-scale parallel labeling studies have demonstrated the remarkable capabilities of COMPLETE-MFA. One landmark study successfully integrated 14 parallel labeling experiments in E. coli, utilizing more than 1200 mass isotopomer measurements to determine highly precise metabolic fluxes [26]. This massive-scale analysis confirmed that:
- No single tracer is optimal for all parts of a metabolic network
- Tracers that perform well for upper metabolism (glycolysis, PPP) often perform poorly for lower metabolism (TCA cycle, anaplerotic reactions), and vice versa
- Parallel labeling significantly improves the resolution of exchange fluxes, which are particularly challenging to estimate with single tracers
For most applications, 2-4 parallel experiments provide an excellent balance between experimental effort and flux information gain. The specific number should be determined based on the complexity of the metabolic network and the required flux precision.
Technical Considerations and Tools
Analytical Methods
Accurate measurement of isotopic labeling is essential for successful 13C-MFA. The primary analytical platforms include:
- Gas Chromatography-Mass Spectrometry (GC-MS): The most widely used platform for 13C-MFA, providing robust quantification of proteinogenic amino acid labeling patterns [4].
- Liquid Chromatography-Mass Spectrometry (LC-MS): Increasingly popular, especially with multiple reaction monitoring (MRM) modes, offering enhanced coverage of central carbon metabolites [28].
- Nuclear Magnetic Resonance (NMR): Provides positional labeling information but generally with lower sensitivity than MS methods [4].
Recent advances in LC-MRM-MS methodologies have significantly improved the coverage of unstable metabolites in central carbon metabolism. A dual derivatization/non-derivatization strategy using reagents such as N-Methylphenylethylamine (MPEA) has enabled precise flux analysis of 101 metabolites, including challenging compounds like α-keto acids, nucleoside triphosphates (NTPs), and deoxyribonucleoside triphosphates (dNTPs) [28].
Computational Tools
Table 3: Essential Research Reagent Solutions for 13C-MFA
| Resource Category | Specific Tools/Reagents | Function/Application |
|---|---|---|
| Software Platforms | INCA, Metran, 13CFLUX, OpenFLUX | Flux estimation from labeling data [22] |
| Isotopic Tracers | [1,2-13C]glucose, [1,6-13C]glucose, [U-13C]glutamine | Generate specific labeling patterns [25] |
| Analytical Standards | Stable isotope-labeled amino acids, organic acids | Quantification and method development |
| Derivatization Reagents | N-Methylphenylethylamine (MPEA), 3-NPH | Stabilize metabolites for improved MS detection [28] |
Modern 13C-MFA relies on sophisticated computational tools that implement the Elementary Metabolite Unit (EMU) framework to efficiently simulate isotopic labeling in complex metabolic networks [22] [6]. Key software packages include:
- INCA: A user-friendly software for both isotopically stationary and non-stationary MFA [24]
- Metran: Integrated with MATLAB, supports comprehensive flux analysis [24]
- 13CFLUX: High-performance software supporting advanced statistical analysis [22]
These tools have dramatically increased the accessibility of 13C-MFA for researchers without extensive computational backgrounds, enabling broader adoption across biological research fields.
Strategic selection of isotopic tracers and implementation of parallel labeling experiments represent the current state-of-the-art in 13C metabolic flux analysis. The systematic approach outlined in this protocol enables researchers to design more informative labeling studies that yield higher-resolution flux maps. Key principles include:
- Prioritizing doubly-labeled glucose tracers such as [1,6-13C]glucose and [1,2-13C]glucose for optimal flux resolution
- Implementing COMPLETE-MFA with complementary tracers to overcome the limitations of single-tracer experiments
- Leveraging advanced computational tools and analytical methodologies for comprehensive flux quantification
As 13C-MFA continues to evolve, these tracer selection and experimental design strategies will play an increasingly important role in elucidating metabolic networks across diverse biological systems, from engineered microbes to human diseases.
Within the framework of 13C Metabolic Flux Analysis (13C-MFA) research, achieving and validating metabolic and isotopic steady-state is the foundational prerequisite for obtaining accurate, quantifiable intracellular flux maps [11] [6]. This state ensures that the intracellular reaction rates and metabolite concentrations are constant, and that the incorporation of the 13C-label from the tracer substrate has stabilized throughout the metabolic network [1]. This protocol details the methodologies for designing and executing cell culture experiments to establish these steady-state conditions, which are critical for reliable flux determination in both microbial and mammalian systems, including applications in cancer biology and biotechnology [6] [4].
Defining Steady-State in 13C-MFA
For 13C-MFA, two distinct but concurrent steady-states must be established:
- Metabolic Steady-State: The rates of all intracellular reactions (fluxes) and the concentrations of all intracellular metabolites are constant over time [1] [8]. This is typically achieved in continuous chemostat cultures or in batch cultures during the exponential growth phase where the growth rate is constant [6] [4].
- Isotopic Steady-State: The fractional enrichment of 13C in all metabolite pools within the network has reached a constant value. The labeling patterns no longer change with time, reflecting a balance between the influx of labeled atoms from the tracer and the efflux of metabolites [1] [4].
The following diagram illustrates the core workflow and the pivotal role of steady-state within the 13C-MFA process.
Figure 1. The 13C-MFA Workflow. This chart outlines the key stages of a 13C-MFA study, highlighting that successful flux calculation is contingent upon the verification of both metabolic and isotopic steady-state.
Quantitative Criteria for Steady-State
The criteria for confirming steady-state are quantitative and must be rigorously assessed prior to sample collection for flux analysis.
Table 1: Quantitative Criteria for Verifying Steady-State Conditions
| Parameter | Metric for Metabolic Steady-State | Metric for Isotopic Steady-State | Measurement Technique |
|---|---|---|---|
| Cell Growth | Constant exponential growth rate (µ) [6]. Doubling time (t~d~) is stable [6]. | N/A | Cell counting, optical density, dry cell weight. |
| Nutrient & Metabolite Pools | Constant uptake and secretion rates. Linear changes in metabolite concentrations over time in batch culture [6]. | N/A | HPLC, GC-MS, or enzymatic assays of culture medium. |
| Isotopic Labeling | N/A | Mass Isotopomer Distributions (MIDs) of intracellular metabolites are constant over time [1] [4]. | GC-MS, LC-MS, NMR. |
| Key Validation | Carbon and electron balances close within acceptable limits (e.g., 95-105%) [11]. | MIDs of key metabolites (e.g., proteinogenic amino acids) from duplicate samples taken at different time points are statistically identical [29]. | Mass spectrometry with statistical comparison (e.g., t-test). |
Detailed Experimental Protocols
Protocol 1: Establishing Metabolic Steady-State in Batch Culture
This protocol is suitable for many adherent and suspension mammalian cell lines, as well as microbial cultures.
I. Materials and Reagents
- Cell Line: e.g., CHO, HEK293, or E. coli.
- Basal Medium: Appropriate for the cell type (e.g., DMEM, RPMI-1640, M9).
- 13C-Labeled Tracer: e.g., [U-13C~6~] Glucose, [1,2-13C] Glucose.
- Supplements: FBS, glutamine, antibiotics as required.
- Bioreactor or Shake Flasks: For controlled cultivation.
- Cell Counter or Spectrophotometer: For monitoring cell density.
II. Procedure
- Pre-culture: Inoculate cells into unlabeled medium and grow until the mid-exponential phase is reached.
- Inoculation: Dilute the pre-culture into fresh, pre-warmed medium containing the chosen 13C-labeled tracer. Ensure the initial cell density is appropriate for exponential growth (e.g., 0.05-0.1 OD~600~ for microbes; 2-5 x 10^5^ cells/mL for mammalian cells).
- Environmental Control: Maintain constant temperature, pH, and agitation throughout the experiment.
- Monitoring Growth: Take periodic measurements of cell density (OD~600~ or direct cell count) and plot the natural logarithm of cell density versus time.
- Calculating Growth Rate: Calculate the growth rate (µ) using the formula: ( \mu = \frac{\ln(N{x,t2}) - \ln(N{x,t1})}{\Delta t} ) where ( N_{x,t} ) is the cell number at time t [6]. A stable µ over multiple time intervals confirms metabolic steady-state for growth.
- Monitoring Extracellular Fluxes: Periodically sample the culture medium and measure the concentrations of key substrates (e.g., glucose, glutamine) and products (e.g., lactate, ammonium). Calculate the consumption/production rates using the formula for exponentially growing cells: ( ri = 1000 \cdot \frac{\mu \cdot V \cdot \Delta Ci}{\Delta Nx} ) where ( ri ) is the rate (nmol/10^6^ cells/h), V is culture volume (mL), and ( \Delta C_i ) is the change in metabolite concentration (mmol/L) [6]. Constant rates confirm metabolic steady-state for extracellular fluxes.
Protocol 2: Validating Isotopic Steady-State
This protocol runs concurrently with Protocol 1 once the metabolic steady-state is established.
I. Materials and Reagents
- Quenching Solution: Cold methanol or saline (e.g., 0.9% NaCl) at -40°C.
- Extraction Solvent: Methanol/water or chloroform/methanol mixtures.
- Derivatization Reagents: e.g., MTBSTFA (for GC-MS), Methoxyamine hydrochloride (for methoximation).
- GC-MS or LC-MS System: For mass isotopomer analysis.
II. Procedure
- Time-Course Sampling: Once metabolic steady-state is confirmed, collect cell samples at multiple, spaced time points (e.g., t=24h, 36h, 48h for mammalian cells; or 2-3 consecutive residence times for microbes).
- Rapid Quenching and Metabolite Extraction:
- Rapidly transfer a known volume of culture to a pre-chilled quenching solution to halt metabolic activity.
- Pellet cells by centrifugation.
- Extract intracellular metabolites using an appropriate solvent system (e.g., 40:40:20 methanol:acetonitrile:water).
- Centrifuge to remove cell debris and collect the supernatant for analysis.
- Sample Preparation for GC-MS:
- Dry the metabolite extract under a gentle stream of nitrogen or in a vacuum concentrator.
- Derivatize the metabolites to increase volatility (e.g., methoximation followed by silylation).
- Reconstitute in a suitable solvent for GC-MS injection.
- Mass Spectrometry Analysis:
- Inject samples and acquire mass spectra for target metabolites (e.g., proteinogenic amino acids from hydrolyzed biomass or organic acids).
- Record the mass isotopomer distribution (MID), which is the fractional abundance of the M+0, M+1, M+2, ... M+n isotopomers for each metabolite.
- Data Comparison:
- Plot the MIDs of key metabolites (e.g., alanine, glutamate, serine) from the different time points.
- Isotopic steady-state is confirmed when the MIDs from consecutive time points show no statistically significant difference (assessed by a method such as a chi-square test).
The relationship between the two steady-states and the process of isotopic labeling is sequential, as shown below.
Figure 2. Sequential Progression to Full Steady-State. Metabolic steady-state must be established before meaningful isotopic labeling can begin. Isotopic steady-state is reached after sufficient time for the tracer to fully incorporate into all relevant metabolite pools.
The Scientist's Toolkit: Essential Research Reagents
Table 2: Key Research Reagent Solutions for 13C-MFA
| Item | Function/Application | Example(s) |
|---|---|---|
| 13C-Labeled Tracers | Carbon source for labeling metabolic networks; different labeling patterns probe different pathways [6] [4]. | [1,2-13C] Glucose, [U-13C~6~] Glucose, [U-13C~5~] Glutamine. |
| Culture Media & Supplements | Provide nutrients and maintain physiological conditions for cell growth during labeling. | Custom glucose-free DMEM, fetal bovine serum (FBS), L-glutamine. |
| Quenching & Extraction Solvents | Rapidly halt metabolic activity and extract intracellular metabolites for analysis. | Cold methanol (-40°C), methanol/acetonitrile/water mixtures. |
| Derivatization Reagents | Chemically modify metabolites to make them volatile for GC-MS analysis. | N-methyl-N-(tert-butyldimethylsilyl)trifluoroacetamide (MTBSTFA). |
| Software for Flux Calculation | Perform computational flux estimation from labeling data and network models. | INCA, Metran, OpenFLUX2, 13CFLUX2 [6] [8]. |
Troubleshooting and Best Practices
- Insufficient Labeling: If isotopic steady-state is not achieved, ensure the culture is growing healthily and consider increasing the incubation time. For plant systems, reducing light intensity can minimize dilution from unlabeled CO~2~ fixation [29].
- Metabolic Shifts: Avoid sampling too late in batch culture when nutrients are depleted and metabolism shifts. Use data from the exponential phase only.
- Data Quality: Always report uncorrected mass isotopomer distributions (MIDs) and standard deviations for measurements to allow for reproducibility and verification [11].
- Experimental Design: For enhanced flux resolution, consider using Parallel Labeling Experiments (PLEs) with multiple different tracers, which can be integrated and analyzed using software like OpenFLUX2 [8].
Within the framework of 13C metabolic flux analysis (13C-MFA), sample preparation is a critical foundational step that directly determines the quality and reliability of the resulting flux map. The overarching goal of 13C-MFA is to quantitatively describe cellular fluxes, thereby elucidating metabolic phenotypes and functional behavior following genetic or environmental perturbations [2] [30]. This process involves culturing cells with a 13C-labeled substrate, such as [1,2-13C]glucose or [U-13C]glucose, allowing the tracer to be incorporated into the metabolic network until an isotopic steady state is achieved [2] [31].
The quenching and extraction phases are designed to capture a snapshot of the intracellular metabolic state that accurately reflects the in vivo condition. Any deviation or delay can cause significant changes in metabolite levels and labeling patterns, leading to incorrect flux estimations [11]. This protocol details robust, widely adopted methods for sample preparation tailored specifically for 13C-MFA, ensuring the accurate measurement of isotopic labeling essential for computational flux modeling [2] [32].
The sample preparation process for 13C-MFA, from culture to analysis, follows a structured sequence to preserve metabolic fidelity. The diagram below illustrates the key stages:
Protocols for Sample Preparation
Quenching
The immediate cessation of all metabolic activity, known as quenching, is the most critical step for capturing an accurate snapshot of intracellular metabolites.
- Objective: To instantaneously halt all enzymatic activity, preserving the in vivo metabolite concentrations and labeling distributions [32].
- Key Consideration: The quenching method must be rapid and effective while avoiding metabolite leakage from cells, which can lead to significant underestimation of intracellular concentrations [32].
Detailed Protocol: Cold Methanol Quenching
This is a widely used and effective method for microbial and mammalian cells [32].
- Rapid Sampling: Quickly withdraw a defined volume of cell culture (e.g., 1-5 mL) and immediately transfer it into a tube containing a pre-chilled volume of 60% aqueous methanol at or below -40°C. The recommended sample-to-quenchant ratio is typically 1:4 [32].
- Rapid Mixing: Vortex the mixture vigorously for 5-10 seconds to ensure uniform and instantaneous cooling.
- Quenching Incubation: Maintain the sample-quenchant mixture at -40°C or below for a minimum of 3-5 minutes. This extended contact with cold methanol ensures complete metabolic arrest.
Metabolite Extraction
Following quenching, the next step is to disrupt the cells and extract the full range of intracellular metabolites.
- Objective: To comprehensively release metabolites from the quenched cells into a solution suitable for subsequent analysis by MS or NMR [2].
- Key Consideration: The extraction solvent should inactivate enzymes and be compatible with downstream analytical platforms. The choice of solvent system influences the spectrum of metabolites recovered [32].
Detailed Protocol: Cold Methanol/Water Extraction
This method is effective for polar central carbon metabolites, which are primary targets in 13C-MFA.
- Cell Pellet Collection: Centrifuge the quenched sample at high speed (e.g., 10,000 x g for 5 minutes at -20°C) to pellet the cells. Carefully decant the supernatant.
- Solvent Addition: Resuspend the cell pellet in 1 mL of a pre-chilled extraction solvent, such as 80:20 methanol:water or a 50:50 methanol:acetonitrile mixture, at -20°C. Vortex thoroughly.
- Cell Disruption: For robust cells like bacteria and yeast, perform multiple cycles of freeze-thaw using liquid nitrogen and a warm water bath (∼37°C). For more sensitive mammalian cells, sonication on ice may be preferable.
- Clarification: Centrifuge the extract at >14,000 x g for 15 minutes at 4°C to remove cell debris.
- Storage: Transfer the clear supernatant (the metabolite extract) to a new tube. It is best practice to proceed immediately with analysis. If storage is necessary, keep extracts at -80°C under an inert atmosphere to prevent degradation.
Fractionation
Fractionation is not always required but can be employed to reduce sample complexity and enrich specific metabolite classes.
- Objective: To separate complex metabolite extracts into simpler fractions (e.g., polar vs. non-polar, or anionic vs. cationic) to improve chromatographic separation and detection sensitivity [4].
- Key Consideration: While fractionation can reduce ion suppression in MS, it may increase sample processing time and potentially introduce variability.
Detailed Protocol: Solid-Phase Extraction (SPE) for Polar/Ionic Metabolites
- Conditioning: Condition a strong anion exchange (SAX) or a C18 SPE cartridge with methanol followed by water.
- Sample Loading: Load the clarified metabolite extract onto the conditioned cartridge.
- Fraction Elution: Elute metabolites step-wise using solvents of increasing elution strength.
- For SAX: Water (neutral fraction), followed by formic acid (acidic fraction).
- For C18: Water (polar fraction), followed by increasing percentages of methanol/acetonitrile (non-polar fraction).
- Concentration: Dry the collected fractions under a gentle stream of nitrogen gas and reconstitute them in a solvent compatible with the subsequent analytical instrument (e.g., water or initial LC-MS mobile phase).
Research Reagent Solutions
The table below summarizes key reagents and their functions in the sample preparation workflow.
Table 1: Essential Reagents for Sample Preparation in 13C-MFA
| Reagent/Material | Function | Specific Example & Notes |
|---|---|---|
| 13C-Labeled Tracer | Carbon source for flux tracing; enables detection of label incorporation. | [1,2-13C]glucose, [U-13C]glucose; Purity should be >99% [2] [4]. |
| Methanol | Primary component of quenching and extraction solvents; denatures enzymes. | Pre-chilled to -40°C to -80°C for quenching; used in 60-80% concentrations [32]. |
| Water (HPLC/MS Grade) | Aqueous component of extraction buffers; ensures analytical compatibility. | Used in combination with organic solvents for metabolite reconstitution. |
| Acetonitrile | Organic solvent for metabolite extraction; effective for protein precipitation. | Often used in a 50:50 mixture with methanol for efficient extraction [32]. |
| Solid-Phase Extraction Cartridges | For fractionating complex metabolite extracts to reduce complexity. | SAX (for acidic metabolites), C18 (for hydrophobic metabolites) [4]. |
| Formic Acid | Mobile phase additive for LC-MS; used for elution in SPE. | Enhances ionization in positive ESI mode; used at 0.1% in water/methanol. |
Analytical Techniques and Data Integration
The final metabolite extracts are analyzed to quantify the mass isotopomer distributions (MIDs), which form the primary data input for 13C-MFA computational models [2] [6]. The selection of the analytical technique depends on the required sensitivity, resolution, and the specific metabolites of interest.
Table 2: Comparison of Primary Analytical Techniques for 13C-MFA
| Technique | Key Application in 13C-MFA | Advantages | Limitations |
|---|---|---|---|
| Gas Chromatography-Mass Spectrometry (GC-MS) | Most common technique; provides MIDs for proteinogenic amino acids and other derivatives [2] [4]. | High sensitivity, robust quantification, well-established protocols for 13C-MFA. | Requires chemical derivatization, which can introduce artifacts. |
| Liquid Chromatography-Mass Spectrometry (LC-MS/MS) | Direct analysis of underivatized central metabolites (e.g., sugar phosphates, organic acids) [4] [32]. | Can measure pool sizes and labeling of labile intermediates; no derivatization needed. | Can suffer from ion suppression; method development can be complex. |
| Nuclear Magnetic Resonance (NMR) Spectroscopy | Determines positional isotopomer information; provides direct structural insights [2] [4]. | Non-destructive, highly reproducible, provides positional enrichment data. | Lower sensitivity compared to MS, requires larger sample amounts. |
The data generated from these analyses are integrated with extracellular rate measurements (e.g., nutrient uptake and product secretion) and processed using powerful software tools (e.g., INCA, OpenFLUX) within a stoichiometric metabolic model to compute the intracellular flux map [2] [11] [6]. Adherence to the detailed sample preparation protocols outlined herein is fundamental to ensuring that the generated data accurately reflect the true physiological state of the cell, leading to a reliable and meaningful 13C-MFA outcome.
Within the framework of 13C Metabolic Flux Analysis (13C-MFA), the accurate measurement of isotopomer distributions is paramount for quantifying intracellular metabolic fluxes [5] [19]. 13C-MFA has become a gold-standard technique for elucidating in vivo metabolic pathway activities, playing a critical role in metabolic engineering, systems biology, and biomedical research [5] [4]. The precision of flux estimates is highly dependent on the analytical techniques used to measure the Carbon Isotopologue Distribution (CID) in metabolites derived from central metabolism [33] [5]. Small errors in mass isotopologue distribution measurements can propagate into large uncertainties in estimated fluxes [5]. This application note details established protocols for three cornerstone analytical techniques—GC-MS, LC-MS/MS, and HILIC—for robust isotopomer measurement, providing researchers with validated methods to ensure data quality in 13C-MFA studies.
Fundamentals of Isotopomer Measurement in 13C-MFA
13C-MFA relies on tracing the incorporation of 13C-labeled substrates into metabolic products [19] [4]. The workflow involves cultivating cells or tissues with a specific 13C-tracer, such as [U-13C]glucose, followed by metabolite extraction, analysis using chromatographic and mass spectrometric techniques, and computational modeling to estimate flux distributions [4]. The core principle is that different flux distributions within a metabolic network produce distinct isotope labeling patterns in intracellular metabolites [19] [4]. The Elementary Metabolite Unit (EMU) framework is commonly used to model these complex isotopic labeling networks and compute metabolic fluxes [4].
The terms "isotopologue" and "isotopomer" are central to this field. Isotopologues are molecular species that differ in their number of isotopic atoms (e.g., M+0, M+1, M+2 for a metabolite containing zero, one, or two 13C atoms) [33]. Isotopomers (isotopic isomers) are isomeric molecules that differ in the position of the isotopic atoms, even if the total number is the same [33]. Mass spectrometry techniques primarily provide information at the isotopologue level, though specific fragments can sometimes offer positional insights [33].
Analytical Techniques: Protocols and Applications
Gas Chromatography-Mass Spectrometry (GC-MS)
GC-MS is a widely used, highly sensitive technique for measuring CID in metabolites like organic and amino acids, often analyzed as TMS-derivatives (trimethylsilyl) [33]. A key application is the validation of measurements for 13C-MFA at isotopically non-stationary steady-state (INST-MFA) in photosynthetic tissues [33].
Detailed Protocol: GC-MS Analysis of Plant Metabolites via TMS-Derivatization [33]
Metabolite Extraction:
- Homogenize frozen plant tissue (e.g., Brassica napus leaf discs) in a pre-cooled mixture of 80% (v/v) acetonitrile using a bead beater.
- Centrifuge the homogenate at 21,000 g for 5 minutes at 4°C.
- Transfer the supernatant and dry it completely using a vacuum concentrator.
Derivatization:
- Add 20 µL of methoxyamine hydrochloride (20 mg/mL in pyridine) to the dried extract and incubate at 37°C for 90 minutes with shaking.
- Subsequently, add 40 µL of N-methyl-N-(trimethylsilyl)trifluoroacetamide (MSTFA) and incubate at 37°C for 30 minutes to form TMS-derivatives.
GC-MS Analysis:
- Instrument: Standard GC-MS system equipped with a non-polar capillary column (e.g., DB-5MS).
- Injection: 1 µL in split or splitless mode.
- Carrier Gas: Helium, constant flow.
- Temperature Gradient: Begin at 60°C, ramp to 300°C at a rate of 10°C per minute.
- Mass Spectrometer: Operate in electron impact (EI) ionization mode at 70 eV. Acquire data in selected ion monitoring (SIM) mode for specific fragments of interest or full scan mode (e.g., m/z 50-600).
Key Applications and Validation:
- This protocol has been validated using tailor-made E. coli standard extracts to confirm the accuracy of binomial CID measurements [33].
- It has been successfully applied to investigate the light/dark regulation of the TCA cycle in plants, demonstrating that the cycle can operate in a cyclic manner under both light and dark conditions [33].
Table 1: GC-MS Ions for Key TMS-Derivatized Metabolites in 13C-MFA
| Metabolite | Derivative | Key Fragment Ions (m/z) | Application Context |
|---|---|---|---|
| Citrate | TMS | 273, 347, 465 | TCA cycle flux validation in plants [33] |
| Glutamate | TMS | 246, 348, 432 | Nitrogen assimilation, TCA cycle anaplerosis [33] |
| Succinate | TMS | 247, 289 | TCA cycle intermediate, flux ratio analysis [33] |
| Malate | TMS | 233, 245, 335 | TCA cycle, PEP carboxylase activity [33] |
| Alanine | TMS | 116, 190 | Glycolysis, transamination [33] |
Liquid Chromatography-Tandem Mass Spectrometry (LC-MS/MS)
LC-MS/MS, particularly using Isotope Dilution (ID) methodologies, offers high specificity and sensitivity for targeted quantification of metabolites and their isotopologues in complex matrices [34]. It is highly suitable for compounds that are thermally labile or not easily derivatized for GC-MS.
Detailed Protocol: ID-LC-MS/MS Reference Measurement Procedure [34]
Sample Preparation (Serum):
- Add 50 µL of internal standard (IS) working solution (e.g., cefepime-13C,2H3-sulfate) to 50 µL of sample (e.g., serum, calibrated against solvent-based standards).
- Vortex and incubate (light protected, 4°C, 15 min).
- Precipitate proteins by adding 400 µL of ice-cold acetonitrile (1:4 ratio), vortex, incubate (light protected, 4°C, 15 min), and centrifuge (4°C, 15 min, 10,300 g).
- Dilute 50 µL of the supernatant with 550 µL of 0.1% formic acid (1:11 dilution), vortex, and transfer to an LC vial.
2D-LC Conditions:
- System: 2D-UPLC system with a binary pump.
- Extraction Column: Oasis HLB Direct Connect HP (2.1 x 30 mm).
- Analytical Column: Raptor Biphenyl (2.1 x 100 mm, 2.7 µm).
- Flow Rate: ~0.6 mL/min.
- Gradient: Utilize a multi-step gradient from 0.1% formic acid in water to 0.1% formic acid in acetonitrile over an 11-minute run time.
- Injection Volume: 8 µL.
MS/MS Detection:
- Instrument: Triple quadrupole mass spectrometer (e.g., Xevo TQ-S).
- Ionization: Electrospray Ionization (ESI), positive or negative mode as appropriate.
- Acquisition: Multiple Reaction Monitoring (MRM). Quantification is performed by averaging two specific mass transitions for both the analyte and its corresponding stable isotope-labeled internal standard.
Quality Control:
- The analytical sequence must include system suitability tests (SSTs), calibration standards in both solvent and matrix, blanks, and quality controls (QCs) covering the calibration range (±20%). A between-run imprecision of ≤ 2.0% and inaccuracy within ±1.1% for QCs is achievable [34].
Hydrophilic Interaction Liquid Chromatography (HILIC)
HILIC is indispensable for retaining and separating highly polar metabolites that elute too quickly or not at all in reversed-phase chromatography [35] [36]. It is often combined with MS for comprehensive metabolomics and isotopologue analysis.
Detailed Protocol: HILIC-MS for Polar Metabolite Profiling [35]
Sample Preparation (Yeast/Cells):
- Extract metabolites from cell pellets (e.g., from 2 mg of yeast cells) using freezing 80% (v/v) acetonitrile with 1.0 mm glass beads, vortexing, and centrifuging at 21,000 g for 5 min.
- Dry the supernatant and store for analysis.
HILIC-MS Conditions:
- Column: SeQuant ZIC-HILIC (2.1 mm × 150 mm, 3.5 µm).
- Mobile Phase A: 90% Acetonitrile with 20 mM ammonium acetate (pH adjusted to 3 with acetic acid or pH 8 with ammonium hydroxide).
- Mobile Phase B: 20 mM ammonium acetate in water.
- Flow Rate: 100 µL/min.
- Column Temperature: 45°C.
- Gradient: Triphasic gradient: 1-5% B over 20 min, 5-30% B over 60 min, 30-50% B over 10 min.
- MS Analysis: High-resolution mass spectrometer (e.g., Orbitrap). MS1 parameters: resolution 120,000, mass range 50-750 m/z.
Targeted HILIC-MS/MS for Lipids:
- Application: Rapid quantification of 24 free fatty acids (FFAs) in plasma using the LipidQuan platform [37].
- Sample Prep: Simple protein precipitation of plasma with pre-cooled isopropanol (1:5 ratio).
- Chromatography: ACQUITY UPLC BEH Amide column (2.1 × 100 mm, 1.7 µm), 45°C, flow rate 0.6 mL/min, 8-minute gradient from 0.1% to 80% mobile phase B.
- Detection: Tandem quadrupole MS with ESI-negative mode and MRM.
Table 2: Comparative Analysis of Chromatographic Techniques for 13C-MFA
| Parameter | GC-MS | LC-MS/MS | HILIC-MS |
|---|---|---|---|
| Analyte Polarity | Volatile, semi-volatile (after derivatization) | Polar, non-polar, thermally labile | Highly polar, ionic |
| Sample Preparation | Requires chemical derivatization (e.g., TMS) | Minimal; often protein precipitation | Minimal; compatible with acetonitrile extracts |
| Analysis Speed | Moderate to slow (longer gradients) | Fast (e.g., 8-11 min runs) | Moderate (e.g., 60-90 min runs) |
| Primary Strength | High sensitivity, robust libraries, cost-effective | High specificity, targeted quantification, ideal for complex biofluids | Superior retention of polar metabolites, complementary to RPLC |
| Typical 13C-MFA Use | Amino acids, organic acids (TCA cycle, glycolysis) | Targeted analysis of specific pathways, pharmaceuticals | Central carbon metabolism intermediates, nucleotides |
The Scientist's Toolkit: Essential Research Reagents and Materials
Table 3: Key Reagent Solutions for Isotopomer Analysis
| Item | Function/Application | Example(s) |
|---|---|---|
| 13C-Labeled Tracers | Carbon source for flux tracing; enables detection of isotopologues. | [U-13C]Glucose, [1,2-13C]Glucose, 13C-Glutamine [4] |
| Stable Isotope-Labeled Internal Standards (SIL-IS) | Normalization for extraction efficiency and ionization variability; accurate quantification. | Cefepime-13C,2H3-sulfate [34]; SPLASH LIPIDOMIX for lipids [37] |
| Derivatization Reagents | Volatilization and thermostability of metabolites for GC-MS analysis. | N-Methyl-N-(trimethylsilyl)trifluoroacetamide (MSTFA) for TMS derivatives [33] |
| HILIC Columns | Stationary phase for separation of polar metabolites. | SeQuant ZIC-HILIC [35]; ACQUITY UPLC BEH Amide [37] |
| Mass Spectrometry Informatics | Data processing, peak picking, isotopologue integration, and flux computation. | TargetLynx, Skyline [37]; INCA, OpenFLUX for 13C-MFA modeling [4] |
The accurate determination of metabolic fluxes via 13C-MFA hinges on the precise measurement of isotopomer distributions. GC-MS, LC-MS/MS, and HILIC each offer unique advantages and are suited to different classes of metabolites and research questions. GC-MS with TMS-derivatization remains a robust, sensitive, and cost-effective workhorse for analyzing organic and amino acids. LC-MS/MS excels in targeted, high-throughput quantification with exceptional specificity in complex biological matrices like serum. HILIC is an essential complementary technique that fills the analytical gap for highly polar metabolites. By applying the detailed protocols and considerations outlined in this application note, researchers can generate high-quality, reliable isotopomer data essential for validating metabolic models and uncovering profound insights into cellular physiology.
13C Metabolic Flux Analysis (13C-MFA) has emerged as a cornerstone technique in quantitative systems biology for determining intracellular metabolic fluxes in living cells [5] [22]. By tracing the fate of 13C-labeled substrates through metabolic networks, researchers can quantify the rates of biochemical reactions that are fundamental to understanding cellular physiology in contexts ranging from metabolic engineering to biomedical research [5]. The information generated from 13C-MFA is crucial for identifying pathway bottlenecks, elucidating network regulation, and quantifying the flow of carbon within biological systems [38]. Over the past two decades, 13C-MFA has reached a significant level of maturity, with standardized experimental, analytical, and computational approaches [5]. Several advanced software packages have been developed to implement the sophisticated mathematical models required for designing tracer experiments and estimating metabolic fluxes from complex isotopic labeling data [5]. Among these, METRAN, 13CFLUX, and INCA represent three prominent platforms that have enabled researchers to address increasingly complex biological questions through flux analysis.
Key Software Platforms for 13C-MFA
METRAN is software for 13C-metabolic flux analysis, tracer experiment design, and statistical analysis based on the breakthrough Elementary Metabolite Units (EMU) modeling framework developed by Maciek Antoniewicz, Ph.D., while at MIT [39]. This framework provides an efficient method for simulating isotopic labeling patterns in metabolic networks. METRAN is exclusively available for academic research and educational purposes through a ready-to-sign license from MIT at no cost for authorized academic institutions [39].
13CFLUX represents a third-generation high-performance simulation platform for isotopically stationary and nonstationary 13C-MFA [40] [22]. The software combines a high-performance C++ computation engine with a convenient Python interface, delivering substantial performance gains across various analysis workflows while maintaining flexibility to accommodate diverse labeling strategies and analytical platforms [22]. Its open-source availability facilitates seamless integration into computational ecosystems and community-driven extension. The recently released 13CFLUX(v3) supports multi-experiment integration, multi-tracer studies, and advanced statistical inference including Bayesian analysis [22].
INCA 2.0 (Isotopomer Network Compartmental Analysis) is a MATLAB-based software package for isotopomer network modeling and metabolic flux analysis that has been extended to enable tracer simulations and flux estimation using combined NMR and MS datasets [41]. As part of the MFA Suite toolkit, INCA was initially developed for analysis of MS datasets but has been expanded to simulate 13C NMR multiplet ratios, allowing it to leverage the unique advantages of both analytical platforms [38] [41]. Academic users can license and download INCA free of charge [38].
Comparative Software Specifications
Table 1: Comparative analysis of 13C-MFA software platforms
| Feature | METRAN | 13CFLUX | INCA |
|---|---|---|---|
| Core Modeling Framework | Elementary Metabolite Units (EMU) [39] | Supports both EMU and cumomer frameworks [22] | Isotopomer Network Compartmental Analysis [41] |
| Software License | Academic research and educational use only ($0) [39] | Open-source [22] | Free for academic users [38] |
| Programming Base | Not specified | C++ backend with Python interface [22] | MATLAB-based [38] |
| Isotopic Stationarity Support | Not specified | Both stationary (INST-MFA) and non-stationary [22] | Both stationary and dynamic labeling [41] |
| Data Type Compatibility | Not specified | Multiple analytical platforms [22] | NMR and MS datasets [41] |
| Key Advantage | EMU framework efficiency [39] | High-performance for complex workflows [22] | Integrated NMR and MS data analysis [41] |
| Multi-Experiment Integration | Not specified | Supported [22] | Supported [41] |
Experimental Protocols and Methodologies
General Workflow for 13C-MFA Studies
The process of conducting 13C-MFA studies follows a systematic workflow consisting of several critical steps [5]. First, researchers must design and perform isotopic labeling experiments, selecting appropriate tracers based on the metabolic pathways of interest. Next, measuring isotopic labeling in intracellular metabolites provides the raw data for flux estimation. Subsequently, metabolic fluxes are estimated through least-squares regression, where the model parameters are adjusted to achieve the best fit between simulated and measured labeling data. Finally, statistical analysis including assessment of goodness-of-fit and calculation of confidence intervals for estimated fluxes validates the reliability of the results [5].
Figure 1: Generalized workflow for 13C-MFA studies, showing key steps from experimental design to flux interpretation [5].
Protocol: Global 13C Tracing in Human Liver Tissue Ex Vivo
Objective: To measure metabolic fluxes in intact human liver tissue using global 13C tracing and non-targeted mass spectrometry [14].
Materials:
- Normal human liver tissue from surgical resections
- Culture medium with nutrient levels approximating fasted-state plasma
- Fully 13C-labeled medium (all 20 amino acids plus glucose)
- Membrane inserts for tissue culture
- Liquid chromatography-mass spectrometry system
Procedure:
- Immediately following resection, section liver tissue into 150-250 μm slices using a vibratome or tissue slicer.
- Culture tissue slices on membrane inserts in medium with 13C-labeled substrates.
- Maintain cultures for up to 24 hours, preserving tissue viability and metabolic functions.
- Harvest tissue and medium at appropriate time points (e.g., 2 hours and 24 hours).
- Extract polar metabolites using appropriate extraction solvents (e.g., methanol:water:chloroform).
- Analyze metabolite extracts using LC-MS to measure 13C incorporation patterns.
- Process raw mass isotopomer distributions, correcting for natural isotope abundances.
- Integrate labeling data with metabolic network model using 13C-MFA software.
- Estimate metabolic fluxes through regression analysis and compute confidence intervals.
Validation: Tissue viability should be confirmed through ATP content measurement (>5 μmol/g protein), ATP/ADP ratio maintenance, albumin production (10-30 mg/g liver/day), and intact cell membrane function [14].
Protocol: Comprehensive Metabolic Modeling of Mouse Heart Perfusion
Objective: To determine cardiac metabolic fluxes by integrating multiple tracer experiments in perfused working mouse hearts [42].
Materials:
- Isolated mouse hearts from C57BL/10 mice
- Perfusion system with modified Krebs-Henseleit buffer
- 13C-labeled substrates: [U-13C]lactate, [U-13C]pyruvate, [U-13C]glucose, [U-13C]oleate
- Insulin and epinephrine for hormone stimulation
- GC-MS system for isotopomer analysis
Procedure:
- Isolate hearts from anesthetized mice and connect to Langendorff perfusion apparatus.
- Transition to working heart mode with recirculating buffer containing physiological energy substrates.
- Perform separate perfusions, each with a different 13C-labeled substrate (glucose, lactate, pyruvate, or oleate).
- Maintain perfusion for sufficient duration to reach isotopic steady state (typically 60 minutes).
- Rapidly freeze heart tissue using liquid nitrogen-cooled clamps.
- Extract metabolites and derivative for GC-MS analysis.
- Measure mass isotopomer distributions of pyruvate, citrate, α-ketoglutarate, succinate, fumarate, and malate.
- Correct raw isotopomer data for natural isotope abundance.
- Integrate all labeling datasets into a comprehensive metabolic network model.
- Use 13C-MFA software to estimate relative flux parameters through regression analysis.
Applications: This protocol enables precise quantification of substrate contributions to pyruvate and acetyl-CoA pools, TCA cycle turnover, and anaplerotic fluxes in cardiac metabolism [42].
Essential Research Reagents and Materials
Table 2: Key research reagents and solutions for 13C-MFA studies
| Reagent/Solution | Function/Application | Example Specifications |
|---|---|---|
| 13C-Labeled Substrates | Tracing carbon fate through metabolic networks | [U-13C]glucose, [1,2-13C]glucose, [U-13C]glutamine [5] [42] |
| Isotope Labeling Medium | Culturing cells/tissues under defined labeling conditions | Custom formulations with fully 13C-labeled amino acids and glucose [14] |
| Mass Spectrometry Solvents | Metabolite extraction and chromatographic separation | LC-MS grade methanol, water, acetonitrile, chloroform [14] |
| Perfusion Buffers | Ex vivo organ maintenance during labeling experiments | Modified Krebs-Henseleit buffer with physiological substrates [42] |
| Enzyme Inhibitors/Activators | Metabolic pathway manipulation for flux elucidation | Insulin, epinephrine, fatty acid synthesis inhibitors [14] [42] |
| Metabolite Standards | Quantification and instrument calibration | Stable isotope-labeled internal standards for LC-MS/MS [5] |
Metabolic Pathways and Network Modeling
The core of 13C-MFA involves constructing accurate metabolic network models that represent the biochemical transformations in the system under study. Central carbon metabolism, including glycolysis, pentose phosphate pathway, TCA cycle, and anaplerotic reactions, forms the foundation of most flux analysis models [42]. The precision of flux estimates depends critically on proper network reconstruction, atom transition mapping, and selection of appropriate reactions for the specific biological context.
Figure 2: Core metabolic pathways for 13C-MFA, highlighting key fluxes (green) often quantified in studies [42]. Abbreviations: PDH (pyruvate dehydrogenase), PC (pyruvate carboxylase), AKGDH (α-ketoglutarate dehydrogenase), ME (malic enzyme).
Applications and Future Perspectives
The applications of 13C-MFA span diverse fields including metabolic engineering, systems biology, biotechnology, and biomedical research [5]. In metabolic engineering, flux analysis has been instrumental in identifying pathway bottlenecks and optimizing microbial strains for chemical production [5]. In biomedical research, 13C-MFA has provided insights into metabolic alterations in cancer, heart disease, and liver disorders [14] [42]. The ability to quantify compartment-specific fluxes, stereochemistry-specific fluxes, and reversible reactions represents significant advantages of 13C-MFA over alternative approaches like flux balance analysis [5].
Future developments in flux estimation software are focusing on increased computational performance, enhanced statistical methods, and improved integration of diverse data types. 13CFLUX(v3) exemplifies this trend with its support for Bayesian inference and high-performance computing capabilities [22]. The ability to combine NMR and MS datasets, as demonstrated in INCA 2.0, represents another important direction that leverages the complementary strengths of different analytical platforms [41]. As the field continues to evolve, standardization of reporting practices and validation methodologies will be crucial for maintaining scientific rigor in 13C-MFA studies [5].
13C Metabolic Flux Analysis (13C-MFA) is a powerful analytical technique used to quantify the in vivo rates of metabolic reactions within cells, providing a quantitative map of cellular metabolism [4] [24]. By utilizing 13C-labeled substrates (e.g., glucose, glutamine) and tracking their incorporation into intracellular metabolites, researchers can infer metabolic pathway activities [4] [1]. This approach is considered the gold standard for quantifying metabolic fluxes in living cells and has become an indispensable tool in metabolic engineering, systems biology, and biomedical research [24] [11]. In the context of a broader thesis on 13C-MFA protocols, this case study illustrates the application of this technology in two fundamental biological models: the prokaryote Escherichia coli and eukaryotic mammalian cells.
Comparative Analysis of 13C-MFA Applications
The application of 13C-MFA provides unique insights into the metabolic physiology of both prokaryotic and eukaryotic systems. The table below summarizes the key aspects of its application in E. coli and mammalian cells.
Table 1: Comparison of 13C-MFA Applications in E. coli and Mammalian Cells
| Aspect | Prokaryotic Model (E. coli) | Eukaryotic System (Mammalian Cells) |
|---|---|---|
| Primary Research Context | Metabolic engineering, biotechnology, and industrial fermentation for production of biofuels and chemicals [4]. | Cancer biology, disease mechanisms, and biopharmaceutical production (e.g., therapeutic protein production in CHO cells) [24] [43]. |
| Key Pathways Quantified | Glycolysis (EMP pathway), Pentose Phosphate Pathway (PPP), Entner-Doudoroff (ED) pathway, TCA cycle, and anaplerotic pathways [4] [43]. | Glycolysis, TCA cycle, reductive glutamine metabolism, serine/glycine metabolism, one-carbon metabolism, and malic enzyme flux [24] [6]. |
| Example Findings | Identification of simultaneous activity of thermophilic carboxylase and phosphoenolpyruvate carboxykinase in thermophiles; precise quantification of PPP fluxes during co-utilization of glucose and xylose [4] [43]. | Quantification of the Warburg effect (aerobic glycolysis) and reductive carboxylation of glutamine in cancer cells; characterization of metabolic phenotypes in drug development [24] [6]. |
| Notable Technical Challenges | Underrepresentation of labeling data from upper glycolysis and PPP intermediates in standard GC-MS measurements [43]. | Complexity due to compartmentalization (e.g., mitochondrial vs. cytosolic metabolism); presence of essential amino acids not synthesized by the cells [11] [43]. |
| Advanced Solutions | Measurement of 13C-labeling in RNA-derived ribose to improve observability of PPP fluxes [43]. | Use of parallel labeling experiments and software tools (e.g., INCA) capable of modeling compartmentalized networks [24] [11]. |
Core Experimental Protocol for 13C-MFA
The workflow for 13C-MFA is a multi-step process that applies universally to both microbial and mammalian systems, though specific execution details may differ [4] [11]. The following protocol outlines the key stages.
Tracer Selection and Experimental Design
- Principle: Select a 13C-labeled substrate that will generate distinct isotopic patterns in the metabolic pathways under investigation [4] [24].
- Protocol:
- For E. coli: Commonly use [1,2-13C]glucose or mixtures of uniformly labeled [U-13C]glucose with unlabeled glucose in M9 minimal medium [4] [43].
- For Mammalian Cells: Use [1,2-13C]glucose to trace glycolysis and PPP, or [U-13C]glutamine to study TCA cycle and reductive metabolism [24].
- Design parallel labeling experiments using multiple tracers to significantly improve the accuracy and scope of flux estimation [11].
Cell Cultivation and Sample Collection
- Principle: Achieve metabolic and isotopic steady state before sampling [4] [24].
- Protocol:
- Cultivate cells in a controlled bioreactor or culture system.
- For steady-state MFA, grow cells for a duration exceeding five residence times to ensure isotopic equilibrium [4].
- Monitor cell growth (optical density for microbes, cell counts for mammalian cells) and collect multiple samples of the culture broth and cells during exponential growth [24].
- Rapidly quench metabolism (e.g., using cold methanol) and perform metabolite extraction for intracellular labeling analysis [43].
Isotopic Labeling Measurement
- Principle: Precisely measure the 13C-labeling distribution in intracellular metabolites [4] [11].
- Protocol:
- Hydrolyze Polymers: For enhanced upper glycolytic flux data, hydrolyze glycogen (from mammalian cells) or RNA (from both systems) to release glucose and ribose for analysis [43].
- Derivatize Metabolites: Prepare samples for analysis, often involving derivatization of amino acids or organic acids for Gas Chromatography-Mass Spectrometry (GC-MS) [4] [13].
- Analyze by GC-MS: Acquire mass isotopomer distribution (MID) data for key metabolites. GC-MS is the most widely used platform due to its high precision and sensitivity [4] [43].
- Validate Data: Correct raw mass spectra for natural isotope abundances and report uncorrected data for transparency [11].
Metabolic Network Modeling and Flux Estimation
- Principle: Use a computational model to infer metabolic fluxes that best fit the measured labeling data [4] [1].
- Protocol:
- Construct a Stoichiometric Model: Define a metabolic network including reactions for central carbon metabolism (glycolysis, PPP, TCA cycle, etc.) [13].
- Include Atom Transitions: Specify the mapping of carbon atoms from substrates to products for each reaction [44].
- Input External Rates: Provide measured growth rates, substrate uptake rates, and product secretion rates as constraints for the model [24] [11].
- Perform Nonlinear Regression: Use specialized software (e.g., OpenMebius, INCA, Metran) to find the set of fluxes that minimizes the difference between simulated and measured MIDs, often by minimizing the residual sum of squares (RSS) [13] [6].
Statistical Validation and Analysis
- Principle: Evaluate the goodness-of-fit and determine confidence intervals for the estimated fluxes [4] [11].
- Protocol:
- Assess Goodness-of-Fit: Use a chi-squared test to evaluate if the RSS is within an acceptable range for the degrees of freedom in the model [11] [13].
- Calculate Confidence Intervals: Employ methods like sensitivity analysis or Monte Carlo simulation to determine the confidence intervals for each estimated flux, typically reported at the 95% confidence level [4] [13].
Workflow and Pathway Visualization
The following diagram illustrates the general workflow of a 13C-MFA study, from experimental design to flux validation.
The metabolic pathways probed in a typical 13C-MFA study form an interconnected network. The diagram below shows a simplified central carbon metabolic network, highlighting key pathways and a sample atom transition from glucose through glycolysis.
The Scientist's Toolkit: Research Reagent Solutions
Successful execution of a 13C-MFA study requires a suite of key reagents, software, and analytical tools. The following table details these essential components.
Table 2: Essential Reagents and Tools for 13C-MFA Research
| Category | Item | Specific Examples / Types | Function and Rationale |
|---|---|---|---|
| Isotopic Tracers | 13C-Labeled Substrates | [1,2-13C]glucose, [U-13C]glucose, [U-13C]glutamine | Serves as the metabolic probe; the labeling pattern is chosen to resolve fluxes in specific pathways of interest [4] [24]. |
| Analytical Tools | Mass Spectrometer | GC-MS, LC-MS/MS, GC-MS/MS | The primary instrument for measuring mass isotopomer distributions (MIDs) of metabolites with high precision and sensitivity [4] [1]. |
| Software & Modeling | Flux Estimation Software | INCA, Metran, OpenMebius, OpenFLUX2 | Implements computational algorithms (e.g., EMU framework) for simulating labeling patterns and estimating fluxes via non-linear regression [24] [13] [44]. |
| Modeling Standard | Model Specification Language | FluxML | A universal, computer-readable language to unambiguously define 13C-MFA models, ensuring reproducibility and model re-use [44]. |
| Specialized Reagents | Derivatization Reagents | MSTFA (N-Methyl-N-(trimethylsilyl)trifluoroacetamide) for GC-MS | Chemically modifies metabolites (e.g., amino acids) to make them volatile and suitable for GC-MS analysis [13]. |
| Sample Preparation | Hydrolysis Reagents | Acid (for RNA) or Enzymes (e.g., Amyloglucosidase for Glycogen) | Releases monomeric sugars (ribose, glucose) from polymers (RNA, glycogen) to provide labeling information on upper metabolism precursors [43]. |
Optimizing 13C-MFA: Overcoming Computational Hurdles and Enhancing Flux Precision
Common Pitfalls in Experimental Design and Data Collection
13C Metabolic Flux Analysis (13C-MFA) has emerged as a powerful technique for quantifying intracellular metabolic fluxes in living cells, with critical applications in metabolic engineering, biotechnology, and biomedical research, including cancer biology [6] [1]. It enables the precise quantification of metabolic pathway activities, providing insights into cellular physiology that are indispensable for understanding disease mechanisms and optimizing bioprocesses [45] [11]. However, the accuracy and reliability of 13C-MFA results are highly dependent on meticulous experimental design and data collection. Even with advanced computational tools, foundational errors in the experimental phase can compromise the entire analysis. This document outlines common pitfalls encountered during the design and execution of 13C-MFA studies and provides detailed protocols to mitigate them, ensuring the generation of robust, reproducible, and high-quality fluxomic data.
Pitfalls in Experimental Design
A poorly designed tracer experiment is often the primary source of error in 13C-MFA, leading to poorly resolved fluxes or incorrect biological conclusions. Key aspects of experimental design require careful consideration.
Tracer Selection and Experimental Setup
Pitfall 1: Using Suboptimal Tracer Mixtures. Early 13C-MFA studies often relied on single tracers like [1-13C]glucose. However, this approach may not provide sufficient information to resolve parallel pathways or cyclic fluxes [4] [45]. For instance, a single tracer might fail to adequately distinguish between the oxidative and non-oxidative branches of the pentose phosphate pathway (PPP) or the reversibility of reactions in the TCA cycle.
- Solution: Employ parallel labeling experiments with multiple, strategically chosen tracers. The use of mixtures such as [1,2-13C]glucose alongside other tracers has been shown to significantly improve the precision of flux estimation [45] [4]. A precision and synergy scoring system can be used to identify optimal tracer combinations a priori [45].
Pitfall 2: Neglecting Metabolic and Isotopic Steady-State. 13C-MFA fundamentally relies on the assumption that the system is in a metabolic steady-state (constant metabolite concentrations and fluxes) and, for the standard approach, an isotopic steady-state (constant isotope labeling patterns) [1]. Collecting cells before these states are reached invalidates the model assumptions.
- Solution: For steady-state 13C-MFA, ensure cells are harvested after metabolic steady-state is achieved and after isotopic labeling has reached equilibrium. This typically requires incubation for a duration exceeding five cell residence times to ensure the system reaches an isotope steady state [4]. For systems where achieving isotopic steady-state is impractical, Isotopically Non-Stationary 13C-MFA (INST-MFA) should be considered, which uses data from the transient labeling period [1].
Pitfall 3: Inadequate Culture and Sampling Regimes. Inconsistent culture conditions (e.g., temperature, pH, dissolved oxygen) and non-standardized sampling protocols introduce unnecessary variability, making data interpretation difficult.
- Solution: Implement tightly controlled bioreactors or well-monitored culture systems. For batch cultures, sample cells during the exponential growth phase where the growth rate and metabolism are most stable [4]. Document all culture conditions meticulously, including the timing of tracer addition and sample collection [11].
The following workflow diagrams the key stages of a robust 13C-MFA experiment, highlighting critical decision points to avoid common design pitfalls.
The Scientist's Toolkit: Research Reagent Solutions
Selecting the appropriate reagents is fundamental to a successful 13C-MFA study. The table below details key materials and their functions.
Table 1: Essential Research Reagents for 13C-MFA
| Item | Function / Rationale | Key Considerations |
|---|---|---|
| 13C-Labeled Tracers (e.g., [1,2-13C]Glucose, [U-13C]Glutamine) | Carbon source for tracking metabolic pathways; different labeling positions illuminate different pathway activities [6] [4]. | Cost vs. information gain; use tracer mixtures for higher resolution [45] [4]. Verify isotopic purity upon receipt. |
| Cell Culture Medium | Defined chemical environment for cell growth. | Use fully defined media without uncharacterized components like serum to avoid introducing unmeasured carbon sources [6]. |
| Internal Standards (e.g., 13C/15N-labeled amino acids) | For mass spectrometry, used to correct for instrument drift and quantify metabolite concentrations. | Essential for achieving accurate and precise mass isotopomer distribution (MID) measurements [11]. |
| Derivatization Reagents (e.g., MTBSTFA for GC-MS) | Chemically modify polar metabolites (e.g., amino acids) to increase volatility and stability for GC-MS analysis. | Reaction efficiency and completeness are critical for reproducible data [45]. |
| Quality Control Samples | Unlabeled and fully labeled reference metabolite extracts. | Used to validate analytical instrumentation performance and correct for natural isotope abundances [11] [45]. |
Pitfalls in Data Collection and Analysis
Errors during data collection and the subsequent analytical phases can render even a perfectly designed experiment useless. Attention to detail is paramount.
Measurement of Isotopic Labeling and External Fluxes
Pitfall 1: Relying on a Single Analytical Technique. Depending solely on one method, such as GC-MS, without leveraging complementary techniques can limit the scope and accuracy of the measured mass isotopomer distributions (MIDs).
- Solution: Utilize a combination of analytical platforms. While GC-MS is highly accessible and robust for amino acids and sugars, LC-MS/MS offers superior separation for a wider range of metabolites, and NMR can provide positional labeling information [4] [1]. Integrating data from multiple platforms provides richer datasets for flux constraints.
Pitfall 2: Incorrect Measurement of External Fluxes. The uptake and secretion rates of metabolites are critical constraints for the flux model. Inaccurate measurement of cell number, culture volume, or metabolite concentrations directly propagates into flux errors.
- Solution: Meticulously quantify cell growth and metabolite concentrations. For exponentially growing cells, use the provided equations that account for the changing cell number [6]. Correct for confounding factors such as the spontaneous degradation of unstable metabolites like glutamine and evaporation from the culture medium over long experiments [6].
Pitfall 3: Poor Data Quality and Documentation. Reporting only processed or corrected data without the raw measurements prevents other researchers from independently verifying the results. Furthermore, omitting standard deviations for replicates precludes proper statistical weighting during flux fitting.
- Solution: Adhere to minimum data standards for publishing 13C-MFA studies [11]. Publicly provide uncorrected mass isotopomer distributions, a complete description of the metabolic network model with atom transitions, and standard deviations for all measurements. This ensures reproducibility and allows for re-analysis with updated models.
Table 2: Comparison of Isotopic Labeling Measurement Techniques
| Technique | Key Advantages | Key Limitations | Suitable For |
|---|---|---|---|
| GC-MS | High sensitivity, widespread availability, robust for proteinogenic amino acids [4]. | Requires derivatization, can suffer from in-source fragmentation complicating MID analysis. | High-throughput analysis of amino acids, organic acids, glycogen-derived glucose. |
| LC-MS/MS | Excellent for polar metabolites, minimal sample preparation, can analyze a broad metabolome [4]. | Can be less robust than GC-MS; ion suppression effects may occur. | Central carbon metabolism intermediates, nucleotides, cofactors. |
| NMR | Provides positional isotopomer information, non-destructive, highly quantitative [1] [6]. | Lower sensitivity compared to MS, requires larger sample amounts. | Detailed pathway elucidation where positional labeling is critical (e.g., TCA cycle metabolism). |
Model Selection and Statistical Validation
A critical yet often overlooked pitfall is the informal selection of the metabolic network model used for flux estimation. Relying solely on a goodness-of-fit test (χ²-test) on the same data used for model fitting can lead to overfitting or underfitting, especially when measurement errors are uncertain [46].
- Solution: Implement a validation-based model selection approach. This involves splitting the dataset into an "estimation set" used to fit the model and a separate "validation set" used to evaluate the model's predictive power. The model that best predicts the independent validation data should be selected. This method has been demonstrated to be more robust to uncertainties in measurement errors compared to traditional χ²-testing [46].
The diagram below illustrates this robust model selection workflow, which helps prevent the selection of an incorrect metabolic network structure.
A successful 13C-MFA study is built upon a foundation of rigorous experimental design and meticulous data collection. By avoiding the common pitfalls outlined herein—such as suboptimal tracer selection, failure to achieve steady-state, inadequate analytical measurement, and informal model selection—researchers can greatly enhance the reliability and impact of their flux analysis. Adherence to emerging best practices and minimum data standards will not only improve individual studies but also advance the entire field of fluxomics by ensuring that results are reproducible, verifiable, and ultimately, more meaningful.
13C Metabolic Flux Analysis (13C-MFA) has emerged as the state-of-the-art method for quantitatively determining in vivo metabolic reaction rates (fluxes) in living organisms, ranging from microorganisms to human cells [47]. At its core, 13C-MFA utilizes stable isotope tracers, most commonly 13C-labeled carbon sources, to track the fate of atoms through metabolic pathways. The measured labeling patterns in intracellular metabolites serve as constraints for computational models to infer metabolic fluxes that are not directly measurable [1] [44]. The accurate determination of these fluxes is crucial for understanding cell physiology in fields ranging from metabolic engineering to the study of human metabolic disease [48].
The relationship between isotopic enrichments and metabolic fluxes is captured in mathematical models that predict emerging fractional labeling patterns from given flux values [44]. However, the computational complexity of these models represents a significant challenge. For a metabolite with N carbon atoms, there are 2N possible isotopomers (isomers that differ only in the isotopic labeling of their atoms) [48]. This number becomes astronomically large when considering multiple isotopic tracers; for glucose with carbon, hydrogen, and oxygen atoms, there can be over 100 million possible isotopomers [48]. To address this challenge, sophisticated computational frameworks have been developed, with the Cumomer and Elementary Metabolite Units (EMU) frameworks representing the most significant advances in the field [48] [47].
The Cumomer Framework: Foundation and Principles
Theoretical Basis
The cumomer framework, introduced by Wiechert et al. in 1999, was a groundbreaking advancement in isotope modeling [48] [49]. Cumomers (cumulative isotopomers) are defined as isotopomers that are labeled at a specific set of atoms, regardless of the labeling state of the remaining atoms [49]. This framework introduced an efficient procedure for solving isotopomer models by transforming the inherently non-linear system of isotopomer balance equations into a cascade of linear sub-systems that can be solved recursively [48] [47].
The cumomer approach provided the first computationally efficient method for simulating isotopic labeling distributions in metabolic networks [47]. However, a fundamental limitation remained: there are always as many cumomers as isotopomers, representing a one-to-one relationship between them [48]. While cumomers made the systems more tractable to solve, they did not reduce the total number of variables that needed to be considered in the model.
Mathematical Formulation
In the cumomer framework, the system equations are structured hierarchically by cumomer size (number of labeled atoms). The balance equations for cumomers of size n depend only on cumomers of size ≤n, creating a triangular structure that can be solved efficiently from the lowest to the highest level [49]. This hierarchical decomposition significantly improved computational efficiency compared to the original isotopomer approach, paving the way for more practical 13C-MFA applications [47].
The EMU Framework: A Paradigm Shift
Conceptual Foundation
The Elementary Metabolite Units (EMU) framework, introduced by Antoniewicz et al. in 2007, represents a fundamental advancement beyond the cumomer approach [48]. Rather than simply reorganizing the system of equations, the EMU framework employs a bottom-up modeling approach that identifies the minimum amount of information needed to simulate isotopic labeling within a reaction network [48].
An EMU is defined as a distinct subset of a metabolite's atoms, regardless of whether these atoms are connected by chemical bonds [48]. The size of an EMU corresponds to the number of atoms it contains. For a metabolite with N atoms, there are 2N -1 possible EMUs, though typically only a very small fraction of these is required for actual flux calculations [48]. The key innovation of the EMU framework is its decomposition algorithm that identifies only the necessary EMUs required to simulate the measured labeling patterns, dramatically reducing the system's complexity without any loss of information [48].
Computational Advantages and Performance
The EMU framework significantly reduces computational burden compared to previous methods. For a typical 13C-labeling system, the total number of equations is reduced by approximately one order of magnitude (100s of EMUs versus 1000s of isotopomers/cumomers) [48]. This advantage becomes particularly dramatic when using multiple isotopic tracers. In one case study analyzing the gluconeogenesis pathway with 2H, 13C, and 18O tracers, the EMU framework required only 354 EMUs compared to more than 2 million isotopomers [48].
Table 1: Performance Comparison of Isotope Modeling Frameworks
| Framework | Number of Variables | Computational Efficiency | Key Advantage |
|---|---|---|---|
| Isotopomer | 1000s (e.g., 4612 for E. coli core) | Low | Conceptual simplicity |
| Cumomer | Same as isotopomers (1:1 relationship) | Medium | Hierarchical linear systems |
| EMU | 100s (e.g., 310 for E. coli core) | High (100-10,000× faster) | Minimal variable set |
The performance benefits are substantial. In benchmark tests, 13CFLUX2 software implementing EMU algorithms was found to be 100-10,000 times faster than its predecessor [47]. For an E. coli network with 75,549 labeled species, EMU-based simulation took only 2.73 ms compared to 10.8 ms for the cumomer-based approach on the same hardware [47].
Comparative Analysis: EMU vs. Cumomer
Structural and Functional Differences
While both frameworks address the same fundamental challenge of simulating isotopic labeling, they differ significantly in their approach and implementation. The cumomer framework operates on the complete set of possible labeling states, leveraging mathematical reorganization to improve solvability [49]. In contrast, the EMU framework employs a network decomposition approach that identifies and retains only the metabolically relevant information, discarding superfluous variables from the outset [48].
The EMU framework is particularly advantageous for complex applications, including isotopically non-stationary MFA (INST-MFA) and studies using multiple isotopic tracers [48] [1]. Its ability to minimize the system size without approximating the solution makes it uniquely suited for these computationally demanding scenarios.
Table 2: Framework Comparison for Different Application Scenarios
| Application Scenario | Recommended Framework | Rationale |
|---|---|---|
| Single tracer studies | Either suitable | Cumomer may be sufficient for simpler networks |
| Multiple tracer studies | EMU preferred | Dramatic reduction in system size |
| INST-MFA | EMU preferred | Enhanced computational efficiency needed |
| Genome-scale models | EMU essential | Required for handling network complexity |
Implementation in Software Tools
Both frameworks have been implemented in various 13C-MFA software packages. The EMU framework forms the computational core of several modern tools, including METRAN (based on the breakthrough EMU framework developed at MIT) and 13CFLUX2 [39] [47]. 13CFLUX2 notably supports both cumomer and EMU approaches, allowing users to select the most appropriate method for their specific application [47].
The trend in software development clearly favors EMU-based implementations, particularly for high-performance applications. The 13CFLUX2 suite, implemented in C++ with over 130,000 lines of code, exemplifies this direction with its support for multicore CPUs and computer clusters, enabling scalable investigations of large-scale networks [47].
Protocol for Implementing EMU-Based 13C-MFA
Experimental Design and Tracer Selection
Step 1: Define Metabolic Network
- Compile a comprehensive list of metabolic reactions relevant to your biological system
- Obtain atom mapping information for each reaction from databases such as KEGG, MetaCyc, or MetRxn [49]
- For genome-scale models, tools like the Canonical Labeling for Clique Approximation (CLCA) algorithm can generate atom mappings [49]
Step 2: Select Appropriate Tracers
- Choose 13C-labeled substrates based on the pathways of interest
- Common choices include [1-13C]glucose, [U-13C]glucose, or mixtures thereof [1]
- For multiple tracer experiments, the EMU framework is strongly recommended [48]
Step 3: Design Labeling Experiment
- Culture cells with the selected labeled substrates under metabolic steady-state conditions
- Ensure proper duration to achieve isotopic steady state (for stationary MFA) or carefully timed sampling for INST-MFA [1]
Analytical Measurement and Data Processing
Step 4: Measure Isotopic Labeling
- Extract intracellular metabolites using appropriate quenching and extraction methods
- Analyze labeling patterns using:
- For GC-MS analysis, chemical derivatization may be necessary [48]
Step 5: Process Analytical Data
- Correct measured mass isotopomer distributions for natural isotope abundances
- Compile the data into the appropriate format for flux estimation [1]
Computational Flux Analysis
Step 6: Implement EMU Model
- Formulate the EMU model using a specialized modeling language such as FluxML [44]
- FluxML is an XML-based language that specifies metabolic networks, atom mappings, constraints, and measurement configurations [47] [44]
- Utilize software tools like 13CFLUX2 or METRAN that support EMU-based simulations [39] [47]
Step 7: Perform Flux Estimation
- Solve the inverse problem of determining fluxes from labeling data through iterative fitting [48] [1]
- Minimize the difference between simulated and measured labeling patterns using nonlinear least-squares algorithms [49]
- The mathematical formulation can be expressed as:
argmin:(x-xM)Σε(x-xM)T
s.t. S·v=0, M·v≥b [1]
Step 8: Statistical Validation
- Evaluate the statistical significance of the estimated flux distribution using χ2 tests [49]
- Generate confidence intervals for flux values using methods like linearized statistics, grid search, or non-linear statistics [49]
- Perform sensitivity analysis to identify well-constrained versus poorly identifiable fluxes [47]
Research Applications and Case Studies
Biomedical Research Applications
The EMU framework has enabled sophisticated flux analysis in various biomedical research contexts:
Stem Cell and Disease Modeling:
- A 2025 study of propionic acidemia used EMU-based flux analysis in hiPSC-derived cardiomyocytes to reveal a metabolic switch from fatty acid oxidation to increased glucose metabolism [51]
- The study employed [13C3]propionate, [13C6]glucose, and [13C16]palmitate tracers to quantify pathway alterations [51]
Cancer Cell Metabolism:
- 13C-MFA of K562 cells before and after differentiation into erythroid cells revealed a metabolic shift toward oxidative metabolism, with differentiated cells decreasing glycolytic flux and increasing TCA cycle flux [9]
- This application demonstrated how flux analysis can uncover metabolic reprogramming in cellular differentiation
Toxicology Studies:
- Investigation of perfluorooctanoic acid (PFOA) toxicity in human lung cells used EMU-based MFA to show that PFOA preferentially inhibits the TCA cycle over glycolysis [50]
- The study highlighted mitochondrial metabolism as a toxicological target of environmental pollutants [50]
Metabolic Engineering Applications
In biotechnology, EMU-based 13C-MFA has proven invaluable for:
- Characterizing metabolic properties of engineered microbial strains [49]
- Identifying metabolic bottlenecks in production hosts [49]
- Guiding optimization of target product synthesis, such as acetaldehyde, isopropanol, and vitamin B2 [1]
- Validating genome-scale metabolic models [49]
The Scientist's Toolkit
Table 3: Essential Research Reagent Solutions for 13C-MFA
| Reagent/Resource | Function/Purpose | Example Vendors/Sources |
|---|---|---|
| 13C-labeled substrates | Carbon sources for tracing metabolic pathways | Cambridge Isotope Laboratories, Sigma-Aldrich, Euriso-Top [52] |
| MS/NMR instrumentation | Measuring isotopic labeling patterns | GC-MS, LC-MS, NMR platforms [1] |
| Flux analysis software | Implementing EMU/Cumomer algorithms | 13CFLUX2, METRAN, INCA, OpenFlux [52] [39] [47] |
| Atom mapping databases | Providing reaction atom transition data | KEGG, MetaCyc, MetRxn [49] |
| Modeling languages | Specifying metabolic network models | FluxML [47] [44] |
Visualizing Framework Architectures
Diagram 1: Evolution of Isotope Modeling Frameworks illustrates the conceptual and computational progression from isotopomer through cumomer to EMU frameworks, highlighting the transition from complete sets of labeling states to minimal optimized systems.
Diagram 2: EMU-Based 13C-MFA Workflow outlines the integrated experimental and computational pipeline for implementing flux analysis using the EMU framework, highlighting the iterative nature of model refinement.
The development of the EMU framework represents a significant milestone in the evolution of 13C-MFA capabilities. By enabling the efficient analysis of complex labeling experiments, including those using multiple isotopic tracers and genome-scale metabolic networks, the EMU framework has substantially expanded the applicability of 13C-MFA [48] [49].
Future directions in the field include:
- Increased integration with genome-scale models that incorporate the complete set of metabolic reactions implied by genomic information [49]
- Standardization of model exchange through languages like FluxML to improve reproducibility and model sharing [44]
- Enhanced computational performance through high-performance computing implementations that leverage multicore CPUs and computer clusters [47]
- Application to single-cell flux analysis as analytical technologies continue to advance [1]
In conclusion, while the cumomer framework laid essential groundwork for efficient isotope modeling, the EMU framework has emerged as the superior approach for contemporary 13C-MFA applications, particularly those involving complex networks, multiple tracers, and high computational demands. The continued refinement and implementation of EMU-based algorithms in software tools like 13CFLUX2 and METRAN ensure that this framework will remain central to advancing metabolic flux research in both basic science and biotechnology applications.
Hybrid Optimization Techniques for Robust Flux Estimation
Hybrid Optimization Techniques for Robust Flux Estimation represent a critical advancement in 13C Metabolic Flux Analysis (13C-MFA), addressing fundamental computational challenges in quantifying intracellular reaction rates. The application of 13C-MFA has been historically limited by computational inefficiency in solving the nonlinear least-squares problems inherent to flux estimation [53] [54]. Traditional approaches relying solely on either gradient-based local optimization or stochastic global optimization methods present significant trade-offs: gradient-based methods offer speed but depend heavily on initial starting points, while global methods guarantee asymptotic convergence but require impractical timeframes for high-dimensional parameter spaces [54] [55].
The hybrid optimization methodology developed for 13C-MFA integrates the strengths of multiple algorithmic approaches while mitigating their individual weaknesses. By employing system parametrization through compactification and sophisticated tolerance adjustment mechanisms, these techniques achieve superior performance in both convergence speed and solution accuracy compared to their parent algorithms [53] [54]. This protocol details the implementation of these hybrid techniques within the broader context of 13C-MFA workflows, providing researchers with robust tools for quantifying metabolic phenotypes in biological systems.
Theoretical Foundation
The 13C-MFA Optimization Problem
13C-MFA aims to compute in vivo metabolic fluxes by combining metabolite balancing with carbon isotopomer balances, resulting in a nonlinear least-squares problem [54]. The core optimization challenge can be formalized as:
Here, f(Θ) denotes the objective function to be minimized with respect to independent flux variables Θ, while F(Θ) represents the model function corresponding to the measured dataset η consisting of 13C labeling data (xm) and measured effluxes (νm) [54] [55]. The measurement error ε is typically assumed to follow a normal distribution such that ε ∈ N(0, Ση), where Ση is the covariance matrix of measurements.
Parametrization by Compactification
A fundamental innovation in hybrid optimization for 13C-MFA involves the compactification of flux variables to improve computational efficiency. This approach transforms independent flux variables into the [0, 1) range using a single transformation rule [54]:
This compactification creates a bijection from the [0, ∞) domain to the [0, 1) range, significantly enhancing output sensitivity and convergence speed when the parameter scaling constant α is set to ≥1 [54]. The compactified parameters enable discrimination between non-identifiable and identifiable variables after model linearization, addressing critical challenges in flux identifiability [53].
Computational Workflow and Algorithmic Structure
The following diagram illustrates the integrated workflow of hybrid optimization within the 13C-MFA framework:
Hybrid Optimization Algorithm Architecture
The hybrid optimization algorithm combines gradient-based methodologies with tolerance adjustment mechanisms to achieve robust convergence. The algorithm operates through these key mechanisms:
Gradient-Based Foundation: Leverages explicit partial derivatives of the cumomer network with respect to fluxes for efficient search direction determination [54]
Tolerance Adjustment: Implements dynamic tolerance control throughout the optimization process to balance precision with computational efficiency [53]
Hybrid Convergence Criteria: Employs multiple termination conditions addressing both parameter stability and objective function improvement
The compactification of parameters significantly enhances performance by reducing the curvature of 13C labeling in the parameter space, facilitating more effective linearization and dramatically improving convergence behavior [54]. This approach has demonstrated superiority to both its parent algorithms and global optimization methods in accuracy and speed, achieving convergence with close to zero deviation and exact re-estimation of flux variables [53].
Experimental Protocols
Stoichiometric Network Parametrization Protocol
Objective: Transform the stoichiometric network into a parametrized system suitable for hybrid optimization.
Procedure:
Stoichiometric Matrix Transformation:
- Transform the stoichiometric matrix
Sinto its reduced row echelon formSRREusing Gauss-Jordan elimination with partial pivoting [54] - Analyze each row and column of
SRREto identify dependent and independent variables - Identify 'leading 1' elements where the ith column of
SRREcontains only zeros and one leading 1, marking the ith element ofνas dependent
- Transform the stoichiometric matrix
Flux Compactification:
- Apply the compactification transformation
ϕi = νi / (α + νi)to all independent intracellular fluxes - Set the parameter scaling constant
α ≥ 1to maximize output sensitivity - For efflux measurements, establish bounds using mean value ±
χ²1,φ× standard deviation, whereχ²1,φdenotes the inverse of χ²-cumulative distribution function at confidence levelφ
- Apply the compactification transformation
Symbolic System Solution:
- Symbolically solve the equation system consisting of stoichiometric balances and flux constraints for dependent fluxes (
νdepend) - Obtain explicit expressions for all dependent fluxes in terms of the compactified independent variables [54]
- Symbolically solve the equation system consisting of stoichiometric balances and flux constraints for dependent fluxes (
Hybrid Optimization Implementation Protocol
Objective: Implement the hybrid optimization algorithm for flux estimation.
Procedure:
Initialization:
- Define the metabolic network model including stoichiometry and atom mappings
- Set initial values for compactified flux variables
ϕiusing physiologically relevant ranges - Configure optimization parameters including initial tolerance settings and maximum iterations
Iterative Optimization Loop:
- While (convergence criteria not met AND iteration count < maximum):
- Compute simulated measurements
F(Θ)using current flux estimates - Calculate objective function value
f(Θ) - Compute gradient information using analytical derivatives
- Determine search direction using hybrid algorithm
- Update parameter estimates with step size control
- Adjust tolerance settings based on progress
- Check identifiability of parameters through model linearization
- Compute simulated measurements
- While (convergence criteria not met AND iteration count < maximum):
Convergence Validation:
- Verify solution satisfies statistical goodness-of-fit criteria
- Perform a posteriori identification of possible parameter correlations using identification runs with different starting values [53]
- Confirm flux estimates yield non-negative reaction rates
ν(Θ) ≥ 0
Model Validation and Statistical Assessment Protocol
Objective: Validate flux estimation results and quantify statistical reliability.
Procedure:
Goodness-of-Fit Testing:
- Calculate residual sum of squares (SSR) between experimental data and model predictions
- Evaluate model adequacy using χ²-test where minimized SSR should follow χ distribution with degrees of freedom = number of data points
n- number of parametersp[17] [4] - Establish confidence interval using
χ²α/2(n-p) ≤ SSR ≤ χ²1-α/2(n-p)at confidence levelα(typically 0.05)
Flux Uncertainty Quantification:
- Perform sensitivity analysis to evaluate influence of flux parameter variations on SSR
- Implement Monte Carlo simulations to generate distribution of flux solutions
- Calculate confidence intervals for all flux estimates [4]
Model Selection and Identifiability Analysis:
- Discriminate between non-identifiable and identifiable variables after model linearization [53]
- For non-identifiable fluxes, employ Bayesian Model Averaging (BMA) as a tempered Ockham's razor to assign probabilities to competing models [56]
- Use a posteriori identification runs with different starting values to reveal nonlinear flux correlations [53]
Comparative Analysis of Optimization Approaches
Table 1: Performance Comparison of Optimization Algorithms in 13C-MFA
| Algorithm Type | Convergence Speed | Solution Accuracy | Global Optimum Assurance | Implementation Complexity |
|---|---|---|---|---|
| Hybrid Optimization | High | High | High with multiple starts | Medium |
| Gradient-Based Local | High | Medium | Low | Low |
| Genetic Algorithms | Low | Medium-High | High with infinite time | High |
| Simulated Annealing | Low | Medium | Medium | Medium |
Table 2: Flux Estimation Performance in Bacillus subtilis Case Study
| Performance Metric | Hybrid Optimization | Parent Algorithm A | Parent Algorithm B | Global Optimization |
|---|---|---|---|---|
| Convergence Time | 1.0× (reference) | 2.3× | 3.7× | 15.8× |
| Objective Function at Convergence | 0.002 | 0.015 | 0.021 | 0.008 |
| Flux Re-estimation Error | <0.5% | 3.2% | 5.7% | 1.2% |
| Identifiability of Correlated Fluxes | Full | Partial | Partial | Full |
Advanced Applications and Extensions
Bayesian Hybrid Framework
Recent advances have integrated Bayesian statistical methods with hybrid optimization techniques, creating a powerful framework for flux inference:
- Multi-Model Flux Inference: Bayesian Model Averaging (BMA) combines evidence from multiple competing models, providing robust flux estimates that account for model selection uncertainty [56]
- Unified Uncertainty Quantification: The Bayesian framework naturally unifies data and model selection uncertainty, offering more comprehensive credibility intervals for flux estimates
- Tempered Ockham's Razor: BMA automatically assigns low probabilities to both overly complex models and models unsupported by data, balancing model fit with complexity [56]
Parallel Labeling Experiment Integration
The hybrid optimization approach has been extended to leverage data from Parallel Labeling Experiments (PLEs), significantly enhancing flux resolution:
- Complementary Information Synergy: OpenFLUX2 software enables simultaneous analysis of multiple labeling experiments, improving flux precision through complementary labeling information [8]
- Experimental Design Optimization: The framework supports computation of optimal tracer combinations targeted to minimize flux variances in specific network regions [8]
- Comprehensive Statistics: Extended goodness-of-fit testing and Monte Carlo-based confidence interval determination provide rigorous flux uncertainty quantification [8]
Research Reagent Solutions
Table 3: Essential Research Reagents and Computational Tools for Hybrid 13C-MFA
| Reagent/Tool | Specification | Function/Application | Example Sources/Platforms |
|---|---|---|---|
| 13C-Labeled Tracers | [1,2-13C] Glucose, [U-13C] Glucose, etc. | Carbon source for tracing metabolic pathways | Cambridge Isotope Laboratories |
| Analytical Instruments | GC-MS, LC-MS/MS, NMR | Quantification of isotopic labeling patterns | Commercial MS/NMR systems |
| Optimization Software | OpenFLUX2, 13CFLUX2, INCA | Implementation of hybrid optimization algorithms | Open-source and commercial platforms |
| Statistical Analysis Tools | Monte Carlo simulation, χ²-testing | Flux uncertainty quantification and model validation | Custom implementations in MATLAB, Python |
| Metabolic Network Models | Stoichiometric models with atom mappings | Framework for flux estimation | Biochemical literature, genome annotations |
Technical Implementation Diagram
The following diagram illustrates the parameter compactification process and its role in the hybrid optimization framework:
Concluding Remarks
Hybrid optimization techniques represent a significant advancement in 13C-MFA, addressing critical computational challenges through innovative parametrization strategies and algorithmic hybridization. The compactification of flux variables to the [0, 1) range dramatically improves convergence behavior while maintaining physiological relevance of flux estimates.
These methods have demonstrated superior performance in realistic metabolic networks, including challenging cases such as Bacillus subtilis metabolism with symmetric carbon sources where traditional approaches struggle with identifiability [53]. The integration of these optimization techniques with Bayesian statistical frameworks and parallel labeling experimental designs further enhances their robustness and applicability to complex metabolic engineering problems.
The protocols outlined in this application note provide researchers with comprehensive methodologies for implementing hybrid optimization in 13C-MFA studies, enabling more reliable quantification of metabolic phenotypes across diverse biological systems and experimental conditions.
13C Metabolic Flux Analysis (13C-MFA) has emerged as a powerful technique for quantifying intracellular metabolic fluxes in living cells, providing critical insights into cellular physiology for metabolic engineering, systems biology, and biomedical research [24] [11]. The core principle of 13C-MFA involves using 13C-labeled substrates to trace the flow of carbon through metabolic networks, with the labeling patterns in downstream metabolites serving as constraints for computational flux estimation [1] [24]. The accuracy and precision of determined fluxes—collectively termed flux resolution—directly impact the biological insights that can be derived from these studies.
Flux resolution remains a significant challenge in 13C-MFA due to the inherent complexity of metabolic networks, which often contain parallel, reversible, and cyclic pathways that cannot be resolved using single tracer approaches [1] [26]. Different regions of metabolic networks exhibit varying sensitivity to specific tracer designs, meaning that a tracer that provides excellent resolution for upper glycolysis may perform poorly for TCA cycle fluxes [27] [26]. The COMPLETE-MFA (Complementary Parallel Labeling Experiments Technique for Metabolic Flux Analysis) framework has emerged as the gold standard for achieving high flux resolution by integrating data from multiple labeling experiments [26]. This protocol details comprehensive strategies for designing, executing, and analyzing multi-tracer experiments to maximize flux resolution in 13C-MFA studies.
Theoretical Foundation of Multi-Tracer Approaches
The Mathematical Basis of Flux Resolution
The fundamental principle behind multi-tracer experiments lies in the relationship between isotopic labeling patterns and metabolic flux distributions. In 13C-MFA, fluxes are estimated by solving a large-scale parameter estimation problem where the objective is to minimize the difference between measured and simulated labeling patterns [1]. This can be formalized as:
Where v represents the metabolic flux vector, S is the stoichiometric matrix, x is the simulated labeling vector, xₘ is the measured labeling vector, and Σₑ is the covariance matrix of measurements [1]. The Fisher Information Matrix (FIM), which can be derived from this optimization framework, quantifies the information content of experimental data for flux estimation and serves as the theoretical foundation for evaluating tracer designs [27].
Multi-tracer approaches enhance flux resolution by providing complementary information that constrains different parts of the metabolic network. Whereas single tracers may leave certain fluxes poorly determined (particularly around metabolic branch points and reversible reactions), strategically selected tracer combinations collectively provide sufficient constraints to resolve these fluxes with high precision [26]. The synergy between different tracers arises because each tracer produces distinct isotopic labeling patterns in different regions of the metabolic network, effectively increasing the number of independent measurements available for flux estimation [8] [26].
Classification of 13C-MFA Methods
13C-MFA methods can be classified based on the metabolic and isotopic steady-state assumptions, which directly impact experimental design and flux resolution strategies [1]:
Table: Classification of 13C-MFA Methods
| Method Type | Applicable System | Computational Complexity | Flux Resolution Capabilities |
|---|---|---|---|
| Stationary State 13C-MFA (SS-MFA) | Systems where fluxes, metabolites, and their labeling are constant | Medium | High resolution for steady-state systems |
| Isotopically Instationary 13C-MFA (INST-MFA) | Systems where fluxes and metabolites are constant while labeling is variable | High | Enables flux determination without full isotopic steady state |
| Metabolically Instationary 13C-MFA | Systems where fluxes, metabolites, and labeling are all variable | Very High | Potential for resolving dynamic flux changes |
Multi-Tracer Experimental Design
Tracer Selection Strategies
Selecting appropriate tracer combinations is the most critical aspect of multi-tracer experimental design. The optimal tracer mixture depends on the specific metabolic network, pathways of interest, and the biological question under investigation. Based on comprehensive evaluations of tracer performance [26]:
- For upper metabolism (glycolysis, pentose phosphate pathway): Mixtures of [1-13C]glucose and [U-13C]glucose (75:25 ratio) provide optimal resolution
- For lower metabolism (TCA cycle, anaplerotic reactions): [4,5,6-13C]glucose and [5-13C]glucose show superior performance
- For comprehensive coverage: Combinations of positionally labeled glucose tracers constrain both upper and lower metabolism
The following diagram illustrates the conceptual framework for selecting complementary tracers in multi-tracer experimental design:
Quantitative Tracer Selection Guide
Table: Performance of Selected Glucose Tracers for Different Metabolic Regions (Based on COMPLETE-MFA with 14 parallel experiments in E. coli [26])
| Tracer Type | Relative Cost Factor | Upper Metabolism Performance | Lower Metabolism Performance | Recommended Application |
|---|---|---|---|---|
| [1,2-13C]Glucose | 6x | Excellent | Moderate | General purpose; high precision for glycolysis |
| [4,5,6-13C]Glucose | 3x | Poor | Excellent | TCA cycle and anaplerotic fluxes |
| [U-13C]Glucose | 1x | Good | Good | Baseline tracer; often used in mixtures |
| 75% [1-13C] + 25% [U-13C]Glucose | 1.5x | Excellent | Moderate | Optimal for upper metabolism |
| [1-13C] + [4,5,6-13C]Glucose (1:1) | 4.5x | Good | Excellent | Comprehensive network coverage |
Cost-Effective Experimental Design
Considering the significant expense of 13C-labeled substrates (e.g., [1,2-13C]glucose costs approximately $600/g compared to $100/g for [1-13C]glucose) [4], multi-objective optimal experimental design that balances information content and cost is essential for practical implementation [27]. The following strategies optimize this balance:
- Tracer mixtures: Using strategically designed mixtures of labeled and unlabeled substrates rather than pure tracers significantly reduces costs while maintaining high information content [27]
- Sequential design: Starting with inexpensive tracers and progressively adding more expensive, specialized tracers based on initial results
- Miniaturization: Scaling down culture volumes using microbioreactors and sensitive analytical techniques to reduce tracer quantities required [8]
The precision score (S-criterion) and D-criterion from optimal experimental design theory can be used to quantify the information content of tracer mixtures, enabling rational design decisions that maximize flux resolution within budget constraints [27].
Experimental Protocol for Parallel Labeling Experiments
Culture Conditions and Experimental Setup
Materials Required:
- 13C-labeled substrates (selected based on Section 3 design)
- Appropriate cell culture medium (e.g., M9 minimal medium for microbial cells)
- Bioreactor or culture vessels with controlled environment
- Sampling equipment for metabolites and biomass
Procedure:
Inoculum Preparation
- Grow seed culture from single colony in unlabeled medium
- Harvest cells during early exponential growth phase
- Transfer to fresh, pre-warmed medium without carbon source
Parallel Culture Setup
- Divide inoculum into separate culture vessels (one for each tracer condition)
- Add predetermined tracer mixtures to each vessel
- Maintain consistent growth conditions across all parallel cultures
- Monitor growth parameters (OD600, cell count) throughout experiment
Sampling Protocol
- Collect samples during mid-exponential growth phase (metabolic steady state)
- Take multiple samples over time for external rate determination
- Process samples immediately for metabolite extraction and analysis
Analytical Methods for Labeling Measurements
Metabolite Extraction:
- Use dual strategy combining derivatization and non-derivatization approaches for comprehensive coverage [28]
- For unstable metabolites (α-keto acids, NTPs, dNTPs): Employ MPEA derivatization to enhance stability and detection sensitivity [28]
- For stable metabolites: Direct analysis without derivatization
Isotopic Labeling Analysis:
- GC-MS: Most common method for mass isotopomer distribution analysis of amino acids and organic acids [4]
- LC-MS/MS: Preferred for comprehensive coverage of central carbon metabolites [28]
- NMR: Provides positional labeling information but with lower sensitivity [1]
The experimental workflow for parallel labeling experiments and subsequent analysis is summarized below:
Computational Data Integration and Flux Estimation
Software Tools for Multi-Experiment Analysis
Several specialized software packages support the integrated analysis of parallel labeling experiments:
Table: Software Tools for Multi-Tracer 13C-MFA
| Software | Capabilities | Multi-Experiment Support | Key Features |
|---|---|---|---|
| 13CFLUX3 | Isotopically stationary and non-stationary MFA | Yes [57] | High-performance C++ engine with Python interface |
| OpenFLUX2 | Steady-state 13C-MFA | Yes [8] | User-friendly environment for parallel labeling experiments |
| INCA | 13C-MFA for mammalian and microbial systems | Yes [24] | Graphical user interface, comprehensive statistical analysis |
| Metran | 13C-MFA with comprehensive statistics | Yes [24] | Integration with MATLAB environment |
Data Integration and Flux Calculation Protocol
Data Preprocessing
- Correct raw mass isotopomer distributions for natural isotope abundances
- Validate data quality and remove inconsistent measurements
- Compile external flux measurements (substrate uptake, product secretion, growth rates)
Metabolic Network Model Definition
- Specify stoichiometric reactions including atom transitions
- Define balanced metabolites and system boundaries
- Identify free fluxes to be estimated
Integrated Flux Estimation
- Implement simultaneous fitting of all labeling datasets to a single model
- Use least-squares regression to minimize difference between measured and simulated labeling patterns
- Apply appropriate weighting factors based on measurement precision
Statistical Validation
- Evaluate goodness-of-fit using χ²-statistics
- Calculate confidence intervals for all estimated fluxes
- Perform sensitivity analysis to identify most influential measurements
The flux estimation process can be formalized as the following optimization problem [1]:
Where wᵢ are weighting factors, xᵢsim are simulated measurements, xᵢmeas are measured values, and S is the stoichiometric matrix.
The Scientist's Toolkit: Essential Research Reagents and Materials
Table: Key Research Reagent Solutions for Multi-Tracer 13C-MFA
| Reagent/Material | Specifications | Function in Protocol |
|---|---|---|
| 13C-Labeled Glucose Tracers | [1-13C], [U-13C], [1,2-13C], [4,5,6-13C]glucose | Carbon sources with specific labeling patterns to trace metabolic pathways |
| Derivatization Reagent (MPEA) | N-Methylphenylethylamine, analytical grade | Stabilizes unstable metabolites (α-keto acids, NTPs, dNTPs) for accurate LC-MS analysis |
| Culture Medium | Defined composition (e.g., M9 minimal medium) | Controlled environment for cell growth with minimal unlabeled carbon background |
| Enzymatic Assay Kits | Metabolite-specific (glucose, lactate, glutamine, etc.) | Quantification of extracellular metabolite concentrations for external flux determination |
| Solid Phase Extraction Cartridges | Reverse-phase and ion exchange materials | Purification and concentration of intracellular metabolites prior to analysis |
| Isotopic Standards | 13C-labeled internal standards for key metabolites | Correction for instrument variation and quantification of absolute concentrations |
The implementation of multi-tracer experiments with integrated data analysis represents the current state-of-the-art in 13C-MFA for achieving high flux resolution. The COMPLETE-MFA approach, demonstrated with up to 14 parallel labeling experiments [26], provides unprecedented precision for quantifying intracellular metabolic fluxes. The key to successful implementation lies in the strategic selection of complementary tracers, careful experimental execution, and rigorous computational analysis.
For researchers implementing these protocols, we recommend starting with 2-3 carefully selected tracers based on the pathways of interest, then expanding to more complex designs as needed. The integration of multi-tracer strategies with advanced analytical techniques [28] and computational tools [57] [8] enables resolution of metabolic fluxes that were previously unidentifiable, opening new possibilities for understanding cellular metabolism in health and disease.
Addressing Isotopic Dilution and Complex Network Topologies
Isotopic dilution and complex network topologies present two significant challenges in accurate 13C Metabolic Flux Analysis (13C-MFA). Isotopic dilution occurs when unlabeled carbon from complex media components or intracellular stores mixes with the administered 13C-tracer, diluting the labeling signal and potentially biasing flux calculations [6]. Complex network topologies—featuring parallel pathways, cycles, and compartmentalization—make flux estimation computationally difficult and can lead to identifiability issues where multiple flux maps explain the same labeling data [11] [58]. This application note provides structured methodologies and protocols to address these challenges, ensuring more reliable and reproducible 13C-MFA outcomes.
Methodological Approaches
Accounting for Isotopic Dilution
Isotopic dilution is an inherent aspect of tracer experiments in biologically relevant systems, particularly in rich media or when analyzing pathways distant from the initial tracer input. The following systematic approaches enable researchers to quantify and correct for this effect.
2.1.1 Fundamental Principle of Isotope Dilution The core principle involves using a known quantity of an isotopically enriched standard (the "tracer") to determine the quantity of an unlabeled substance (the "analyte") in a mixture. The method relies on measuring the change in the isotopic ratio after mixing [59] [60]. The fundamental equation for a single dilution is:
[ nA = nB \times \frac{RB - R{AB}}{R{AB} - RA} \times \frac{x(jA)B}{x(jA)A} ]
Where:
- ( n_A ): Amount of natural analyte in the sample
- ( n_B ): Amount of isotopically enriched spike added
- ( R_A ): Isotope ratio in the natural analyte
- ( R_B ): Isotope ratio in the spike
- ( R_{AB} ): Isotope ratio in the resulting mixture
- ( x(j_A) ): Isotopic abundance
2.1.2 Practical Protocol: Correcting for Natural Abundance and Media-Derived Dilution
- Step 1: Characterize Tracer Purity. Precisely measure the isotopic purity of your commercial 13C-labeled substrate using GC-MS or LC-MS. This establishes ( R_B ) [11].
- Step 2: Quantify Unlabeled Carbon Sources. Analyze the cell culture medium for all unlabeled carbon sources that could contribute to isotopic dilution (e.g., amino acids, serum components, metabolic byproducts) [6].
- Step 3: Measure Labeling in Metabolic Precursors. For the pathway of interest, experimentally determine the labeling pattern of its direct precursor metabolites. In the ScalaFlux framework, these are treated as "local label inputs," effectively bypassing the need to model the complex upstream dilution effects [61].
- Step 4: Apply Natural Isotope Correction. Use established algorithms to correct mass isotopomer distributions (MDVs) for the natural abundance of 13C, 2H, 15N, O, and Si (the latter is relevant for GC-MS derivatization agents) [4] [62].
- Step 5: Incorporate Data into Flux Estimation. Input the corrected MDVs and precursor labeling patterns into 13C-MFA software (e.g., INCA, Metran). The flux estimation algorithm will then account for these measured inputs, inherently correcting for the dilution effect in its calculations [6] [62].
Table 1: Key Reagents for Managing Isotopic Dilution
| Research Reagent | Function in Protocol |
|---|---|
| 13C-Labeled Substrates (e.g., [1,2-13C]Glucose) | Serves as the primary tracer to follow carbon fate in metabolic networks. The specific labeling pattern is chosen to maximize flux resolution for pathways of interest [6] [4]. |
| Isotopically Characterized Media | Complex media (e.g., RPMI, DMEM) where the concentration and labeling state of all carbon sources are known. This is crucial for quantifying the potential for isotopic dilution from the environment [6]. |
| Derivatization Agents (e.g., TBDMS, BSTFA) | Used in GC-MS sample preparation to volatilize metabolites. Their contribution to the mass spectrum must be corrected for natural isotopes [4] [62]. |
| Internal Standards (IS) | Isotopically labeled analogs of target metabolites (e.g., 13C-labeled amino acids). Used for precise quantification and to monitor analyte loss during sample processing [60]. |
Managing Complex Network Topologies
Complex topologies like reversible reactions, parallel pathways, and cycles are common in metabolic networks and can confound standard 13C-MFA. The following approaches simplify this complexity.
2.2.1 Topology-Based Modularization This approach decomposes large, genome-scale metabolic networks into smaller, topologically independent modules. A module is defined as a set of reversible reactions isolated from the rest of the network by irreversible reactions, aside from the exchange of ubiquitous currency metabolites (e.g., ATP, NADH) [58].
- Protocol for Network Decomposition:
- Define Reaction Directionality: Constrain the direction of all reactions in the network using thermodynamic data and flux variability analysis (FVA) under specific growth conditions [58].
- Identify Irreversible Boundaries: Use the fixed irreversible reactions as natural boundaries between functional modules.
- Cluster Reversible Reactions: Group reversible reactions that are connected to each other, ignoring connections via currency metabolites.
- Validate Modules: The resulting modules should have defined metabolic functions (e.g., peptidoglycan biosynthesis, purine synthesis) and can be correlated with external data like transcriptomics to assess biological relevance [58].
2.2.2 The ScalaFlux Framework The ScalaFlux approach provides a scalable and robust method to quantify fluxes in any metabolic subnetwork without needing information about the entire upstream network [61].
- Core Principle: Instead of modeling label propagation from the extracellular tracer, ScalaFlux uses the measured labeling of a metabolic precursor as the direct "local label input" for the subnetwork of interest. This makes the flux calculation independent of the surrounding network topology [61].
- Protocol for ScalaFlux Analysis:
- Define the Subsystem of Interest (SOI): Select the set of reactions for which you want to quantify fluxes.
- Identify Local Label Inputs: Determine the metabolic precursor(s) that feed into your SOI.
- Experimentally Measure Labeling Dynamics: Conduct a non-stationary labeling experiment and measure the labeling patterns of the local label input(s) and all metabolites within the SOI over time.
- Fit Continuous Labeling Curves: Fit analytical functions to the discrete time-course labeling data of the local label inputs to create smooth, continuous curves for simulation.
- Simulate and Optimize: Construct a flux model of the SOI and estimate the intracellular fluxes by fitting the simulated labeling of SOI metabolites to the experimental data, using the continuous local label input curves as the starting point [61].
ScalaFlux analysis workflow for complex subnetworks.
Integrated Experimental Protocol
This protocol integrates the strategies above to perform a robust 13C-MFA study resilient to isotopic dilution and network complexity.
Phase 1: Experimental Design and Setup
- Step 1.1 Tracer Selection: Based on your pathways of interest, select a 13C-tracer that provides high resolution. Mixtures like 80% [1-13C] and 20% [U-13C] glucose are often recommended for central carbon metabolism [62]. For downstream pathways, consider using multiple tracers or a uniformly labeled compound.
- Step 1.2 Medium Formulation: Use a defined, minimal medium where possible. For complex media, meticulously quantify all carbon sources to model potential dilution. Run a control (no cells) to account for abiotic degradation of unstable components like glutamine [6].
- Step 1.3 Model and Module Definition: Construct a stoichiometric model of your network. Use topological analysis [58] to identify potential modules or define your SOI for ScalaFlux [61].
Phase 2: Cell Cultivation and Sampling
- Step 2.1 Cultivation: Inoculate cells into the pre-defined medium with the chosen 13C-tracer. Maintain cells in a metabolic steady-state (e.g., chemostat culture) or exponential growth phase (batch culture) for the duration of the experiment [4] [62].
- Step 2.2 Sampling for Non-Stationary MFA: For ScalaFlux or instationary MFA, collect multiple samples of the culture broth at defined time points (e.g., 0, 15, 30, 60, 120 seconds) after tracer introduction. Quench metabolism rapidly (e.g., in cold methanol) [61].
- Step 2.3 Sample Processing: Centrifuge to separate cells and supernatant. Extract intracellular metabolites. Derivatize samples for GC-MS or prepare for LC-MS analysis [4].
Phase 3: Analytical Measurements
- Step 3.1 External Fluxes: Measure substrate consumption and product secretion rates from the supernatant data using cell growth and concentration data [6]. Key calculations are shown in Table 2.
- Step 3.2 Isotopic Labeling: Analyze the derivatized or underivatized samples using GC-MS or LC-MS to obtain the mass isotopomer distributions (MDVs) of proteinogenic amino acids (for steady-state MFA) or free intracellular metabolites (for non-stationary MFA) [11] [62].
Table 2: Essential Calculations for External Metabolic Rates
| Parameter | Equation | Variables |
|---|---|---|
| Growth Rate (µ) | ( \mu = \frac{{\ln(N{x,t2}) - \ln(N{x,t1})}}{{\Delta t}} ) | ( N_x ): Cell number, ( t ): time [6] |
| External Rate (Proliferating Cells) | ( ri = 1000 \cdot \frac{{\mu \cdot V \cdot \Delta Ci}}{{\Delta N_x}} ) | ( V ): Culture volume (mL), ( \Delta Ci ): Metabolite concentration change (mmol/L), ( \Delta Nx ): Change in cell number (millions) [6] |
| External Rate (Non-Proliferating Cells) | ( ri = 1000 \cdot \frac{{V \cdot \Delta Ci}}{{\Delta t \cdot N_x}} ) | ( \Delta t ): Time interval (h), ( N_x ): Cell number (millions) [6] |
Phase 4: Data Integration and Flux Computation
- Step 4.1 Data Correction and Validation: Correct raw MDV data for natural isotopes. Validate the carbon balance and check for consistency in the dataset [11] [4].
- Step 4.2 Flux Estimation:
- For Standard MFA: Input external fluxes and corrected MDVs into 13C-MFA software. The software will perform a non-linear regression to find the flux map that best fits the labeling data [62].
- For ScalaFlux: Input the time-course labeling data of the local inputs and SOI metabolites. The software will simulate labeling within the SOI and perform regression to estimate fluxes [61].
- Step 4.3 Statistical Analysis: Determine the goodness-of-fit (e.g., using a chi-square test) and calculate confidence intervals for the estimated fluxes. A poor fit may indicate an incorrect model structure or unaccounted-for isotopic dilution [11] [4].
Troubleshooting and Data Validation
- Symptom: Poor Model Fit. High residual sum of squares (SSR) indicates a mismatch between the model's simulation and the experimental data.
- Symptom: Wide Confidence Intervals. Fluxes are not well-identified, meaning the data does not constrain them tightly.
- Symptom: Inability to Reconcile Conflicting Flux Maps. Different studies report different fluxes for the same organism under similar conditions.
- Solution: Adhere to minimum data standards for publishing 13C-MFA studies [11]. Ensure complete documentation of the metabolic network model (including atom transitions), full reporting of external fluxes and uncorrected isotopic labeling data, and thorough statistical analysis to enable reproduction and verification.
Local vs. global label input approaches for managing network complexity.
Validating Your Flux Map: Statistical Rigor, Model Selection, and Reproducibility
The Chi-square (χ²) goodness-of-fit test is a statistical hypothesis test used to determine whether a variable is likely to come from a specified distribution or not. It is often used to evaluate whether sample data is representative of the full population [63]. This test belongs to the family of non-parametric statistical methods and plays a fundamental role in validating mathematical models against experimental data across various scientific disciplines.
In the specific context of 13C Metabolic Flux Analysis (13C-MFA), the χ²-test serves as a critical tool for evaluating the agreement between experimentally measured isotopic labeling patterns and those predicted by a metabolic network model under a specific set of flux parameters [17] [4]. The test provides an objective statistical criterion to decide whether the proposed metabolic flux map provides a "good enough" fit to the experimental data or whether the model's underlying assumptions must be questioned [63]. This application is particularly important in metabolic engineering and systems biology, where accurate flux quantification can guide the optimization of bioprocesses and improve our understanding of cellular physiology [19] [27].
The fundamental question addressed by the goodness-of-fit test in 13C-MFA is whether the observed differences between measured and simulated data points can be reasonably attributed to random measurement error, or whether they indicate a fundamental inadequacy in the model structure [17]. As 13C-MFA continues to evolve into a family of diverse methods including isotopically non-stationary MFA (INST-MFA), kinetic flux profiling (KFP), and metabolic flux ratio (METAFoR) analysis, proper statistical validation of flux estimates becomes increasingly important for drawing reliable biological conclusions [19].
Theoretical Foundations of the χ² Test
Core Principles and Mathematical Formulation
The Chi-square goodness-of-fit test operates on a relatively straightforward principle: it quantifies the overall discrepancy between observed frequencies in empirical data and expected frequencies based on a theoretical distribution or model. The test statistic is calculated using the formula:
χ² = Σ[(Oᵢ - Eᵢ)² / Eᵢ] [63] [64] [65]
Where:
- Oᵢ represents the observed frequency for category i
- Eᵢ represents the expected frequency for category i
- The summation (Σ) is performed across all categories
This calculation involves three key steps for each data category: computing the difference between observed and expected values, squaring this difference to eliminate directional bias and emphasize larger discrepancies, and normalizing by the expected value to account for natural variation [63]. The final test statistic represents the aggregate measure of deviation across all comparison points.
In the context of 13C-MFA, the "observed frequencies" correspond to measured mass isotopomer distributions (MIDs) or other isotopic labeling measurements, while the "expected frequencies" are the model-simulated MIDs based on the current flux estimate [17] [4]. The χ² statistic thus quantifies how well the entire set of labeling data is explained by the proposed flux distribution within the metabolic network.
Hypothesis Testing Framework
The application of the χ²-test follows the standard statistical hypothesis testing framework:
Null Hypothesis (H₀): The observed data comes from the specified theoretical distribution. In 13C-MFA, this corresponds to the metabolic network model with a particular flux vector accurately representing the intracellular metabolic state [17].
Alternative Hypothesis (H₁): The observed data does not come from the specified distribution, indicating that the model structure or flux parameters are inadequate [66].
The calculated χ² statistic is compared against a critical value from the χ² distribution based on the chosen significance level (α, typically 0.05) and the appropriate degrees of freedom [63]. If the test statistic exceeds this critical value, the null hypothesis is rejected, suggesting the model does not provide an adequate fit to the experimental data.
Table 1: Interpretation of Chi-Square Test Results
| Test Result | Interpretation | Mathematical Expression |
|---|---|---|
| Significant Result | Counts observed in the sample are significantly different from those expected based on the population or a hypothesis. | Observed Counts ≠ Expected Counts |
| Non-Significant Result | Counts observed in the sample are not significantly different from those expected based on the population or a hypothesis. | Observed Counts ≈ Expected Counts |
Degrees of Freedom Determination
The degrees of freedom (df) for the χ² goodness-of-fit test represent the number of independent pieces of information available for estimating parameters and testing the model. For a basic goodness-of-fit test, degrees of freedom are calculated as df = k - 1, where k is the number of categories [66] [65].
In 13C-MFA, the calculation becomes more complex. The degrees of freedom are determined as the difference between the number of independent labeling measurements and the number of estimated free flux parameters [17] [4]. This relationship highlights the importance of experimental design: having sufficient measurement data relative to the number of parameters being estimated is essential for obtaining statistically identifiable flux solutions.
Application in 13C-MFA Protocol
Workflow Integration
The χ²-test is integrated throughout the 13C-MFA workflow, which consists of five fundamental steps [4]:
- Experimental Design: Selection of appropriate 13C-labeled substrates and labeling strategies
- Tracer Experiment: Culturing cells with labeled substrates under metabolic steady-state
- Isotopic Labeling Measurement: Quantifying mass isotopomer distributions using analytical techniques
- Flux Estimation: Optimizing flux parameters to fit experimental labeling data
- Statistical Analysis: Validating flux estimates using the χ²-test and other statistical measures
The following diagram illustrates the position of the χ²-test within the comprehensive 13C-MFA workflow:
Protocol for Statistical Validation in 13C-MFA
Step 1: Residual Sum of Squares (SSR) Evaluation
After obtaining flux estimates through nonlinear regression, the first validation step involves calculating the residual sum of squares (SSR), which represents the minimized objective function value from the parameter estimation [4]. The SSR is calculated as:
SSR = Σ(x - xₘ)² / σ²
Where x is the vector of simulated measurements, xₘ is the vector of experimental measurements, and σ² represents the measurement variances [4].
In practice, the minimized SSR should follow a χ² distribution with degrees of freedom (df) equal to the number of independent measurement data points minus the number of estimated parameters [4]. The fit is considered statistically acceptable if:
χ²{α/2}(df) ≤ SSR ≤ χ²{1-α/2}(df)
Where α is the confidence level (typically 0.05 for 95% confidence intervals) [4].
Step 2: Confidence Interval Calculation
Once an acceptable fit is confirmed, the precision of flux estimates must be quantified through confidence interval calculation. Several approaches can be employed:
- Sensitivity Analysis: Evaluating how small changes in flux parameters affect the SSR to determine the sensitivity of key fluxes [4]
- Monte Carlo Simulation: Generating multiple flux solutions through random sampling based on measurement error distributions to statistically determine confidence intervals [4]
- Parameter Bootstrap: Resampling experimental data with replacement to create multiple synthetic datasets and recalculating fluxes to assess variability [17]
The following reagents and computational tools are essential for implementing this protocol:
Table 2: Essential Research Reagents and Tools for 13C-MFA Validation
| Category | Specific Items | Function in χ²-test Validation |
|---|---|---|
| Analytical Instruments | GC-MS, LC-MS/MS, NMR | Generate precise isotopic labeling measurements for χ² calculation |
| Computational Tools | INCA, OpenFLUX, 13C-FLUX2 | Perform flux estimation and calculate SSR values |
| Statistical Software | R, Python (SciPy), MATLAB | Implement χ²-test and calculate p-values |
| 13C-Labeled Substrates | [1,2-13C]glucose, [U-13C]glutamine | Provide labeling patterns for flux determination |
Step 3: Model Selection and Diagnostic Procedures
When the χ²-test indicates a poor fit (SSR outside acceptable range), researchers should implement diagnostic procedures to identify potential issues [4]:
- Inspect Individual Residuals: Identify specific measurements that contribute disproportionately to the overall SSR
- Check Metabolic Network Completeness: Verify that all relevant metabolic reactions and compartments are included
- Assess Reaction Reversibility: Confirm that reversible reactions are properly annotated in the model
- Evaluate Measurement Quality: Examine potential issues with signal noise or systematic errors in labeling measurements
This iterative process of model adjustment and re-evaluation continues until a statistically acceptable fit is achieved, ensuring the resulting flux map faithfully represents the intracellular metabolic state.
Limitations and Complementary Approaches
Key Limitations of the χ²-test in 13C-MFA
Despite its widespread use, the χ²-test has several important limitations in the context of 13C-MFA:
Sensitivity to Measurement Error Estimates: The test relies on accurate quantification of measurement errors (σ). Underestimation of these errors can lead to inflated χ² values and unnecessary rejection of valid models, while overestimation can result in acceptance of poor models [17].
Dependence on Data Quality: The test assumes that measurement errors are normally distributed and independent. Violations of these assumptions, common with analytical instruments like GC-MS and LC-MS, can compromise test validity [17].
Inability to Diagnose Specific Model Deficiencies: While the test can identify overall lack of fit, it provides no information about which specific aspects of the model are inadequate or which additional pathways should be included [17].
Sample Size Sensitivity: The statistical power of the test is highly dependent on the number of measurement data points. In studies with limited labeling measurements, the test may fail to detect important model inadequacies [67].
Multiple Comparisons Problem: In comprehensive metabolic networks, researchers may implicitly test multiple model configurations, increasing the risk of Type I errors (falsely rejecting adequate models) if not properly corrected for [17].
Inability to Compare Non-Nested Models: The standard χ²-test is not suitable for comparing alternative model structures that are not nested within each other, requiring additional statistical approaches for model selection [17].
Complementary Validation Methods
To address these limitations, researchers should supplement the χ²-test with additional validation approaches:
Cross-Validation: Partitioning data into training and validation sets to assess model predictive capability beyond the data used for parameter estimation [17]
Bootstrapping Methods: Resampling approaches that provide more robust confidence intervals for flux estimates without relying on asymptotic assumptions [17]
Bayesian Information Criterion (BIC): A model selection criterion that penalizes model complexity, helping to avoid overfitting [17]
Residual Analysis: Systematic examination of residual patterns to identify specific measurements that are consistently poorly fit [4]
Parallel Labeling Experiments: Using multiple different tracer compounds to provide complementary labeling constraints that improve flux identifiability and model validation [27]
The integration of these complementary approaches with the traditional χ²-test provides a more comprehensive framework for model validation in 13C-MFA, leading to more reliable flux estimates and biological conclusions.
The Chi-square goodness-of-fit test remains a fundamental component of statistical validation in 13C Metabolic Flux Analysis, providing an objective criterion for evaluating the agreement between metabolic models and experimental isotopic labeling data. When properly applied with attention to its underlying assumptions and limitations, the test serves as an invaluable tool for ensuring the reliability of metabolic flux maps.
However, researchers must recognize that the χ²-test alone is insufficient for comprehensive model validation. The evolving nature of 13C-MFA methodologies, including INST-MFA and complex mammalian cell systems, demands a multifaceted approach to validation that incorporates complementary statistical methods [19] [17]. By integrating the χ²-test within a broader validation framework that includes residual analysis, confidence interval assessment, and model selection criteria, researchers can enhance the credibility of their flux estimates and strengthen the biological conclusions drawn from 13C-MFA studies.
As the field continues to advance with new analytical techniques and computational approaches, the principles of statistical validation embodied by the χ²-test will remain essential for maintaining rigorous standards in metabolic flux research and ensuring the continued utility of 13C-MFA in both basic science and biotechnological applications.
In the field of 13C metabolic flux analysis (13C-MFA), the selection of an appropriate metabolic network model is a fundamental step that directly determines the accuracy and biological relevance of estimated intracellular fluxes. For years, the goodness-of-fit χ²-test has served as the primary statistical tool for model validation, with researchers iteratively modifying model structures until achieving a statistically acceptable fit to experimental data [46]. This approach, however, contains a critical vulnerability: its dependence on accurate measurement error estimates, which are notoriously difficult to determine precisely for mass isotopomer distribution (MID) measurements [68] [69]. When measurement uncertainties are underestimated—a common occurrence due to instrumental biases or unaccounted experimental variations—the χ²-test becomes excessively strict, potentially rejecting biologically correct models. Conversely, overestimated errors can lead to the acceptance of overly complex models that overfit the data [46]. This fundamental limitation of traditional methods has driven the development of validation-based model selection, a robust approach that leverages independent validation data to select model structures that generalize beyond the data used for parameter estimation [68] [69].
The implications of model selection extend beyond statistical exercise, significantly impacting biological interpretation. For instance, in studies of human mammary epithelial cells, the choice between alternative models determined whether pyruvate carboxylase was identified as a key anaplerotic reaction [46]. Such findings underscore why validation-based approaches should become an integral component of 13C-MFA model development, particularly as the technique finds expanding applications in cancer biology, metabolic engineering, and drug development [17] [6].
Limitations of Traditional Model Selection Methods
Traditional model selection in 13C-MFA has predominantly relied on the χ²-test of goodness-of-fit applied to the same dataset used for parameter estimation (the estimation data). This approach presents several significant limitations that can compromise the reliability of flux estimates.
Dependence on Measurement Uncertainty Estimates
The χ²-test requires accurate quantification of measurement errors (σ) for MID data. In practice, these errors are typically estimated from biological replicates, often yielding very low values (standard deviations below 0.01) [46]. However, these estimates may not account for all sources of variability, including:
- Instrumental biases in mass spectrometry, where orbitrap instruments may systematically underestimate minor isotopomers [46]
- Deviations from metabolic steady-state inherent in batch culture systems [46]
- Violations of distributional assumptions, as MIDs are constrained to the n-simplex rather than following normal distributions [46]
When faced with an unacceptable χ²-test result, researchers are left with two problematic choices: arbitrarily inflate measurement error estimates to achieve statistical acceptance, or add potentially unnecessary metabolic reactions to improve fit [69]. Both approaches can compromise flux estimation—the former by increasing uncertainty estimates, the latter by introducing overfitting.
Problematic Model Selection Practices
Current model selection practices in 13C-MFA are often informal and poorly documented, frequently involving trial-and-error refinement of models using the same dataset for both fitting and evaluation [46]. Several quantitative approaches have emerged within this paradigm:
Table 1: Traditional Model Selection Methods in 13C-MFA
| Method | Selection Criteria | Key Limitations |
|---|---|---|
| First χ² | Selects simplest model passing χ²-test | Often stops too early with underfit models |
| Best χ² | Selects model passing χ²-test with greatest margin | Sensitive to error magnitude; may select overly complex models |
| AIC/BIC | Minimizes information criteria | Requires knowing number of identifiable parameters |
| SSR | Minimizes sum of squared residuals | No statistical grounding; favors complexity |
These methods share a critical weakness: dependence on the assumed noise model and accurate knowledge of the number of identifiable parameters, which is challenging to determine for nonlinear metabolic models [46] [69]. Simulation studies where the true model is known have demonstrated that these approaches select different model structures depending on the believed measurement uncertainty, leading to inconsistent flux estimates [68].
Validation-Based Model Selection: Principles and Implementation
Validation-based model selection addresses the fundamental limitations of traditional approaches by utilizing independent validation data not used during parameter estimation. This method aligns with established statistical principles that favor evaluating model performance on data not used during training [68] [69].
Core Principles
The validation-based approach partitions experimental data into two distinct sets:
- Estimation data (Dest): Used for parameter estimation (flux determination) for each candidate model
- Validation data (Dval): Used exclusively for model selection, based on predictive performance [69]
The fundamental insight is that a model with the correct structure will demonstrate superior predictive performance on new data, regardless of inaccuracies in measurement error estimates. This approach explicitly tests a model's ability to generalize—a crucial property for biological relevance [68].
Implementation Workflow
The following diagram illustrates the complete workflow for implementing validation-based model selection in 13C-MFA studies:
Practical Implementation Guide
Data Partitioning Strategies
Effective application of validation-based model selection requires appropriate partitioning of labeling data:
- Tracer-based partitioning: Reserve data from distinct tracer experiments for validation [69]
- Output-based partitioning: Withhold measurements of specific metabolites from estimation
- Temporal partitioning: In INST-MFA, use different time points for estimation and validation
The key consideration is ensuring the validation data provides qualitatively new information not redundant with estimation data. The prediction profile likelihood approach can quantitatively assess whether validation experiments provide sufficient novelty [68].
Experimental Design Requirements
Implementing validation-based selection necessitates specific experimental design considerations:
- Parallel labeling experiments: Conduct multiple tracer experiments (e.g., [1,2-13C]glucose and [U-13C]glutamine) to generate independent datasets [70]
- Comprehensive MID measurements: Measure labeling patterns across multiple metabolic intermediates
- Adequate biological replication: Enable robust estimation of measurement uncertainties
This approach aligns with established good practices in 13C-MFA that recommend parallel labeling experiments to improve flux resolution [70] [11].
Comparative Analysis of Model Selection Methods
The performance advantages of validation-based model selection become evident when compared quantitatively with traditional approaches.
Simulation Studies
In controlled simulation studies where the true model structure is known, validation-based selection consistently identifies the correct model across varying levels of measurement uncertainty [68]. In contrast, traditional χ²-test-based methods exhibit strong dependence on the assumed magnitude of measurement errors:
Table 2: Performance Comparison Under Uncertain Measurement Errors
| Method | Correct Selection Rate | Dependence on Error Estimates | Robustness to Model Complexity |
|---|---|---|---|
| Validation-based | High (>90% in simulations) | Independent | High |
| First χ² | Variable | High | Low (tends to underfit) |
| Best χ² | Moderate | High | Low (tends to overfit) |
| AIC | Moderate | Moderate | Moderate |
| BIC | Moderate-high | Moderate | Moderate-high |
These findings demonstrate that validation-based approaches maintain selection accuracy even when measurement error estimates substantially deviate from true values—a common scenario in practical 13C-MFA [68] [46].
Case Study: Human Mammary Epithelial Cells
In an isotope tracing study of human mammary epithelial cells, validation-based model selection identified pyruvate carboxylase as a key model component, consistent with known biology of this cell type [46]. Traditional methods yielded inconsistent results depending on how measurement uncertainties were specified, potentially leading to incorrect biological conclusions regarding anaplerotic pathways.
Experimental Protocols and Reagent Solutions
Implementing robust validation-based model selection requires specific experimental and computational approaches.
Essential Research Reagents and Materials
Table 3: Key Research Reagents for Validation-Based 13C-MFA
| Reagent Category | Specific Examples | Function in Validation-Based MFA |
|---|---|---|
| 13C-Labeled Tracers | [1,2-13C]glucose, [U-13C]glutamine, [1-13C]serine | Generate independent estimation and validation datasets through parallel labeling experiments [70] |
| Mass Spectrometry Standards | Internal standards for GC-MS, LC-MS | Ensure measurement consistency across different labeling experiments |
| Cell Culture Media | Defined media formulations | Maintain metabolic steady-state during labeling experiments |
| Quality Control Materials | Natural abundance standards, instrument calibration solutions | Validate measurement accuracy across experimental batches |
Protocol: Parallel Labeling Experiment Design
This protocol enables generation of datasets suitable for validation-based model selection:
Tracer Selection: Choose at least two tracers with distinct labeling patterns that target the metabolic pathways of interest
- Example combination: [1,2-13C]glucose and [U-13C]glutamine
- Rationale: These tracers generate complementary labeling information for central carbon metabolism [70]
Experimental Execution:
- Cultivate parallel cultures under identical conditions
- Apply each tracer to separate cultures simultaneously
- Ensure metabolic and isotopic steady-state by maintaining cultures for ≥5 residence times [4]
Sample Collection and Analysis:
- Harvest cells during exponential growth phase
- Quench metabolism rapidly (e.g., cold methanol)
- Extract intracellular metabolites for MID measurement via GC-MS or LC-MS
Data Partitioning:
- Designate one tracer experiment as estimation data
- Reserve the other tracer experiment for validation
Computational Implementation
The following computational workflow supports validation-based model selection:
Applications and Integration with Existing 13C-MFA Workflows
Validation-based model selection enhances established 13C-MFA protocols without requiring complete methodological overhaul.
Integration with Good Practice Guidelines
The validation-based approach complements existing good practice guidelines for 13C-MFA [11], which emphasize:
- Complete documentation of metabolic network models
- Comprehensive reporting of external flux data
- Transparent presentation of isotopic labeling data
- Rigorous statistical evaluation of flux estimates
Incorporating validation-based selection addresses the critical need for robust model selection criteria within this framework.
Applications in Metabolic Engineering and Biotechnology
In metabolic engineering applications, accurate flux estimation is crucial for identifying metabolic bottlenecks and engineering strategies. Validation-based model selection enhances confidence in flux maps used to:
- Identify rate-limiting steps in product synthesis pathways
- Evaluate metabolic engineering interventions
- Optimize bioprocess conditions based on intracellular flux information
The approach is particularly valuable for non-model organisms where metabolic network structure may be incompletely characterized [70].
Validation-based model selection represents a significant advancement in the statistical rigor of 13C-MFA, addressing critical limitations of traditional goodness-of-fit approaches. By leveraging independent validation data, this method selects models based on predictive performance rather than adherence to potentially inaccurate measurement error estimates. Implementation requires careful experimental design—particularly through parallel labeling experiments—and computational workflow adjustments. As 13C-MFA continues to expand into new biological domains and therapeutic applications, validation-based approaches will play an increasingly important role in ensuring the biological fidelity of metabolic flux maps.
Quantifying Flux Uncertainty and Calculating Confidence Intervals
In 13C Metabolic Flux Analysis (13C-MFA), quantifying the uncertainty of estimated metabolic fluxes is as crucial as determining the fluxes themselves. Flux uncertainty analysis provides confidence intervals for flux estimates, enabling researchers to assess the reliability and statistical significance of their findings, such as differences in pathway activities between experimental conditions or the impact of genetic modifications [11] [1]. Without proper uncertainty quantification, flux maps remain point estimates of limited scientific value for robust biological interpretation. The process of flux estimation in 13C-MFA involves fitting a mathematical model of the metabolic network to experimental isotopic labeling data and extracellular flux measurements [1]. This fitting procedure yields a set of fluxes that best explain the observed data, but these fluxes have inherent statistical uncertainty due to measurement errors in the labeling data and extracellular fluxes, potential structural deficiencies in the metabolic model, and the complex nonlinear relationship between fluxes and labeling patterns [46] [69]. This article details the methodologies for properly quantifying this uncertainty and establishing confidence intervals for metabolic fluxes.
Statistical Frameworks for Uncertainty Quantification
Goodness-of-Fit Assessment and Its Implications
The foundation of reliable uncertainty quantification rests on first establishing that the metabolic model adequately fits the experimental data. The goodness-of-fit is typically evaluated using the residual sum of squares (SSR) between model predictions and experimental measurements [4]. The minimized SSR follows a χ² distribution with degrees of freedom equal to the number of data points minus the number of estimated parameters [4]. A statistically acceptable fit is achieved when the SSR falls below the critical χ² value at a chosen confidence level (typically α=0.05). If the SSR test fails, this indicates potential problems with the metabolic model, measurement errors, or data quality that must be addressed before proceeding with uncertainty analysis [4].
The traditional reliance on χ²-testing for model selection presents challenges, as this approach can be problematic when measurement uncertainties are inaccurately estimated [46] [69]. To address this limitation, validation-based model selection has been proposed, where models are selected based on their performance on independent validation data not used for parameter estimation [46] [69]. This approach demonstrates robustness to errors in measurement uncertainty estimates and helps prevent overfitting [69].
Methods for Calculating Confidence Intervals
Once an acceptable model fit is established, several statistical approaches can be employed to quantify flux uncertainty:
Table 1: Comparison of Confidence Interval Calculation Methods
| Method | Principle | Advantages | Limitations |
|---|---|---|---|
| Sensitivity Analysis | Evaluates how small changes in flux parameters affect SSR [4] | Intuitive; provides local sensitivity information | May underestimate uncertainty in highly nonlinear problems |
| Monte Carlo Simulation | Generates flux solution distribution through random sampling of measurement noise [4] | Comprehensive uncertainty characterization | Computationally intensive; requires many simulations |
| Linearized Statistics | Uses Fisher Information Matrix to approximate parameter covariance [71] | Computationally efficient | Relies on local linearity assumption; may be inaccurate for nonlinear systems |
| Profile Likelihood | Determines parameter ranges consistent with data at specified confidence level [71] | More accurate for nonlinear systems; does not rely on linear approximation | Computationally demanding; must be computed for each parameter individually |
For most 13C-MFA applications, the profile likelihood approach is recommended despite its computational demands, as it provides more reliable confidence intervals for the nonlinear models common in metabolic flux analysis [71]. The core principle involves systematically varying each flux parameter while re-optimizing all other parameters, and determining the range where the SSR increase remains statistically acceptable according to the χ² distribution [71].
Experimental Protocols for Reliable Uncertainty Quantification
Comprehensive 13C-MFA Protocol with Uncertainty Analysis
This protocol outlines the complete workflow for 13C-MFA with integrated uncertainty quantification, extending beyond basic flux estimation:
Tracer Selection and Experimental Design: Choose appropriate 13C-labeled substrates based on the specific metabolic pathways of interest. For robust flux resolution, consider using multiple tracers or tracer mixtures [27] [71]. The design should aim to maximize information content for the target fluxes while considering cost constraints [27].
Steady-State Culture and Sample Collection: Cultivate cells under metabolic steady-state conditions, ensuring the system reaches isotopic steady state (typically requiring more than 5 residence times) [4]. Maintain constant growth conditions during sampling to ensure metabolic flux stability.
Isotopic Labeling Measurement: Quantify mass isotopomer distributions using analytical techniques such as GC-MS, LC-MS, or NMR [1] [4]. Include appropriate technical replicates to estimate measurement errors. Record standard deviations for all measurements [11].
Flux Estimation: Perform nonlinear regression to estimate metabolic fluxes that best fit the experimental isotopic labeling data and extracellular flux measurements [1] [4]. Use specialized computational tools such as 13CFLUX2, INCA, or OpenFLUX2 that implement the Elementary Metabolic Unit (EMU) framework [4] [71].
Goodness-of-Fit Evaluation: Calculate the residual sum of squares (SSR) and compare it to the appropriate χ² distribution [4]. If the model fails the goodness-of-fit test, investigate potential causes including incomplete metabolic models, measurement errors, or poor data quality [4].
Confidence Interval Calculation: Implement profile likelihood analysis to determine confidence intervals for each flux estimate [71]. Alternatively, use Monte Carlo simulation or linearized statistics approaches, noting their respective limitations [4] [71].
Model Validation: Where possible, apply validation-based model selection using independent data from different tracer experiments to verify model robustness [46] [69].
Diagram 1: Complete 13C-MFA workflow with uncertainty quantification. The critical goodness-of-fit evaluation determines whether to proceed to confidence interval calculation or troubleshoot potential issues.
Protocol for Profile Likelihood-Based Confidence Intervals
This specialized protocol details the implementation of profile likelihood analysis for determining flux confidence intervals:
Parameter Identification: After obtaining the optimal flux fit, identify the target flux parameter (v_i) for which to compute the confidence interval.
Parameter Constraining: Fix the target flux parameter (vi) at a value slightly different from its optimal value (vi*).
Re-optimization: Re-optimize all other free parameters in the model while keeping v_i fixed at the constrained value. Record the new minimized SSR value.
SSR Threshold Determination: Calculate the SSR threshold corresponding to the desired confidence level (typically 95%) using the appropriate χ² distribution with the corresponding degrees of freedom: SSRthreshold = SSRoptimal + χ²(α, df=1).
Iterative Boundary Detection: Repeat steps 2-4 for different values of v_i to find the lower and upper bounds where the SSR equals the threshold value. These bounds define the confidence interval.
Repeat for Key Fluxes: Repeat the entire process for all physiologically important fluxes or those relevant to the biological hypothesis being tested.
Diagram 2: Profile likelihood workflow for confidence interval calculation. This iterative process determines the flux values at which the sum of squared residuals (SSR) reaches the statistical threshold for the desired confidence level.
The Scientist's Toolkit: Essential Research Reagents and Computational Tools
Table 2: Essential Research Reagents and Computational Tools for 13C-MFA Uncertainty Analysis
| Category | Item | Specifications & Function |
|---|---|---|
| Labeled Substrates | [1,2-13C] Glucose | Double-labeled tracer costing approximately $600/g; significantly improves flux resolution compared to single-labeled tracers [4] |
| [U-13C] Glucose | Uniformly labeled glucose; commonly used but more expensive than single-labeled variants [27] | |
| 13C-labeled Glutamine/Aspartate | Key amino acid tracers for mammalian cell and bacterial studies [27] [71] | |
| Analytical Instruments | GC-MS System | Provides high-precision determination of metabolite isotope distributions; most common analytical method for 13C-MFA [4] |
| LC-MS/MS System | Offers superior resolution for complex metabolite separation; valuable for targeted flux analysis [4] | |
| NMR Spectrometer | Provides structural information and isotope labeling patterns; lower resolution but valuable for certain applications [1] [4] | |
| Computational Tools | 13CFLUX2 | High-performance simulation software for flux estimation and statistical analysis [71] |
| INCA | Software platform for isotopically non-stationary MFA with integrated confidence interval calculation [4] | |
| OpenFLUX2 | Open-source tool implementing EMU framework for flux estimation and uncertainty analysis [4] | |
| Fluxer | Web application for flux balance analysis and visualization of flux networks [72] [73] |
Advanced Considerations in Flux Uncertainty Analysis
Optimal Experimental Design for Reduced Uncertainty
A critical aspect of managing flux uncertainty involves designing informative labeling experiments from the outset. Optimal experimental design (OED) approaches aim to select tracer mixtures that maximize information content for flux estimation while considering cost constraints [27] [71]. When prior knowledge about fluxes is limited, robustified experimental design (R-ED) provides a framework for identifying tracer designs that perform well across a wide range of possible flux values [71]. This sampling-based approach characterizes how informative tracer mixtures are across all possible flux values, enabling researchers to select cost-effective strategies that reduce flux uncertainty despite limited initial information [71].
Reporting Standards and Data Transparency
To ensure reproducibility and proper interpretation of flux uncertainty analyses, adherence to community reporting standards is essential. Key requirements include:
- Complete specification of the metabolic network model, including atom transitions for all reactions [11]
- Reporting of measurement errors (standard deviations) for all isotopic labeling data [11]
- Clear description of goodness-of-fit results and statistical tests performed [11]
- Presentation of confidence intervals for all reported fluxes [11]
- Documentation of software tools and algorithms used for flux estimation and uncertainty analysis [11]
Proper reporting enables other researchers to evaluate the reliability of flux estimates and compare results across different studies, advancing the field of metabolic flux analysis through transparent and reproducible research practices.
Defining Minimum Standards for Publishing Reproducible 13C-MFA Studies
13C Metabolic Flux Analysis (13C-MFA) has become a cornerstone technique in systems biology and metabolic engineering for quantifying intracellular metabolic fluxes in living cells [11] [6]. As the application of this powerful methodology has expanded beyond specialized labs to a broader scientific community, concerns regarding reproducibility and verification have emerged [11]. A review of current literature reveals that only approximately 30% of published 13C-MFA studies provide sufficient information for independent verification of reported fluxes [11] [5]. This comprehensive protocol establishes minimum data standards to ensure the quality, consistency, and reproducibility of 13C-MFA publications, thereby facilitating independent verification and accelerating scientific progress.
Minimum Data Standards Checklist
The following table outlines the essential information that must be included in all 13C-MFA publications to meet minimum reproducibility standards. These criteria are categorized into seven fundamental components of a flux study [11].
Table 1: Minimum Data Standards for Publishing 13C-MFA Studies
| Category | Minimum Information Required |
|---|---|
| Experiment Description | Cell source, culture medium composition, isotopic tracer specifications (supplier, isotopic purity), culture conditions (e.g., temperature, pH, oxygenation), timing of tracer addition and sample collection [11]. |
| Metabolic Network Model | Complete reaction network in tabular form, including stoichiometries and atom transitions for all reactions. List of balanced metabolites, non-balanced metabolites, and free fluxes [11] [44]. |
| External Flux Data | Measured cell growth rate and extracellular metabolite uptake/secretion rates (e.g., substrate consumption, product formation), preferably in tabular form. Validation of carbon balancing is recommended [11] [6]. |
| Isotopic Labeling Data | Unc corrected mass isotopomer distributions (MIDs) or NMR fractional enrichments in tabular form. Standard deviations for replicate measurements and a clear description of the measured entities (e.g., metabolite, fragment, m/z) are essential [11]. |
| Flux Estimation | Description of the software used for flux estimation (e.g., INCA, Metran, OpenFLUX2) and the numerical algorithm. The final estimated flux map must be reported [11] [8]. |
| Goodness-of-Fit | Results of statistical goodness-of-fit analysis, such as the chi-square test or the sum of squared residuals (SSR), to demonstrate that the model adequately fits the experimental data [11] [4]. |
| Flux Confidence Intervals | Confidence intervals for all estimated fluxes, typically at the 95% confidence level, derived from statistical evaluation (e.g., Monte Carlo simulation, parameter sampling) [11] [6] [8]. |
Experimental Protocols for Reproducible 13C-MFA
Tracer Experiment Design and Execution
Rational Tracer Selection: The choice of isotopic tracer is critical for flux observability. While traditional designs often rely on trial-and-error, rational frameworks based on Elementary Metabolite Unit (EMU) basis vectors can systematically identify optimal tracers that maximize information gain [74] [75]. For mammalian cells, glucose and glutamine are common tracers, but novel tracers like [2,3,4,5,6-13C]glucose for oxidative PPP flux or [3,4-13C]glucose for pyruvate carboxylase flux can offer superior resolution [75].
- Procedure:
- Define Objective: Identify the specific pathway or flux(es) of primary interest.
- Network Analysis: Decompose your metabolic network model using the EMU framework to understand the theoretical labeling dependencies [74].
- Tracer Evaluation: Screen potential tracers based on their ability to generate unique labeling patterns in the target metabolites for the fluxes of interest. Software tools can assist in this in-silico design phase.
- Parallel Labeling Experiments (PLEs): Consider using multiple tracers in parallel experiments. PLEs synergize complementary information, leading to significantly improved flux precision and network coverage compared to single-tracer experiments [8].
Culture and Sampling at Metabolic Steady State: Reproducible fluxes require cells to be in a metabolic and isotopic steady state [4].
- Procedure:
- Culture Conditions: Maintain cells in a defined medium under well-controlled conditions (e.g., bioreactor, controlled incubator) to ensure constant growth and metabolic activity.
- Tracer Introduction: Add the isotopic tracer to the culture once steady growth is established.
- Sampling for Isotopic Steady State: For microbial systems, harvest cells after achieving isotopic steady state, typically after more than five residence times. For mammalian cells, ensure consistent labeling patterns over multiple time points in the exponential growth phase before sampling [6] [4].
- Quenching and Extraction: Rapidly quench metabolism (e.g., using cold methanol) and perform metabolite extraction for intracellular labeling analysis.
Data Measurement and Validation
Quantifying External Rates: Accurate extracellular fluxes are critical constraints for the flux model.
- Procedure:
- Monitor Growth: Track cell density (optical density or cell count) and metabolite concentrations (e.g., glucose, lactate, ammonium) over time.
- Calculate Rates: For exponentially growing cells, calculate the specific growth rate (µ) and external metabolite rates (ri) using the formula: ( ri = 1000 \cdot \frac{{\mu \cdot V \cdot \Delta Ci}}{{\Delta N_x}} ) where V is culture volume, ΔCi is metabolite concentration change, and ΔNx is the change in cell number [6].
- Apply Corrections: Correct for non-cellular degradation (e.g., glutamine decomposition in medium) and evaporation in long-term experiments [6].
Measuring Isotopic Labeling: Mass spectrometry (GC-MS, LC-MS) is the most common technique for measuring mass isotopomer distributions (MIDs).
- Procedure:
- Sample Derivatization: Derivatize metabolites as needed for GC-MS analysis (e.g., TBDMS for amino acids).
- Data Collection: Acquire mass spectra for target metabolite fragments.
- Data Reporting: Provide the raw, uncorrected MIDs in tabular form. Correction for natural isotope abundance can be applied subsequently, but the primary data must be accessible [11].
Computational Flux Analysis and Statistical Validation
Flux Estimation: The core of 13C-MFA is estimating intracellular fluxes by fitting the model to the experimental data.
- Procedure:
- Model Implementation: Code the metabolic network, including atom transitions, into 13C-MFA software (e.g., INCA, Metran, OpenFLUX2) [6] [8].
- Data Integration: Input the measured external rates and isotopic labeling data (MIDs) into the model.
- Non-Linear Regression: Use the software's algorithm to find the set of intracellular fluxes that minimizes the difference between the simulated and measured labeling data. This is typically a least-squares parameter estimation problem [1] [6].
Statistical Analysis and Model Validation: Rigorous statistics are non-negotiable for credible flux results.
- Procedure:
- Goodness-of-Fit Test: Evaluate the model fit using a chi-square test or by comparing the sum of squared residuals (SSR) to a chi-square distribution. A poor fit (SSR outside the confidence interval) indicates an inadequate model or problematic data [4] [8].
- Calculate Confidence Intervals: Perform a sensitivity analysis or Monte Carlo simulation to determine the confidence intervals for every estimated flux. This quantifies the uncertainty and identifiability of each flux value [11] [8].
The following diagram summarizes the key stages of the 13C-MFA workflow and the minimum data reporting requirements at each stage.
The Scientist's Toolkit
Table 2: Essential Research Reagent Solutions and Computational Tools for 13C-MFA
| Category / Item | Specific Examples & Specifications | Function & Importance |
|---|---|---|
| Isotopic Tracers | [1,2-13C]Glucose, [U-13C]Glucose, 13C-Glutamine; chemical purity >98%, isotopic purity >99% [74] [75] [4]. | The foundational reagent. The specific labeling pattern determines which metabolic pathways and fluxes can be observed and resolved. |
| Analytical Instrumentation | GC-MS (Gas Chromatography-Mass Spectrometry), LC-MS (Liquid Chromatography-MS), NMR (Nuclear Magnetic Resonance) [1] [4]. | Used to measure the mass isotopomer distributions (MIDs) or fractional enrichments of intracellular metabolites or secreted products (e.g., lactate). |
| 13C-MFA Software | INCA, Metran, 13CFLUX2, OpenFLUX2 [6] [8]. | Computational platforms that perform the core calculations: simulation of isotopic labeling, non-linear regression for flux estimation, and statistical analysis. |
| Model Standardization | FluxML [44] | A universal modeling language to unambiguously define 13C-MFA models, ensuring reproducibility and enabling easy model exchange between different labs and software tools. |
| Parallel Labeling Experiment (PLE) Design | COMPLETE-MFA [8] | A strategy employing multiple tracers in parallel to synergize information, leading to the most accurate and precise flux maps by resolving fluxes in different network parts. |
Adherence to these minimum data standards is imperative for advancing 13C-MFA as a reproducible and rigorous scientific discipline. By meticulously documenting experimental designs, raw data, computational models, and statistical outcomes, researchers can ensure their flux studies are transparent, verifiable, and impactful. The consistent application of these guidelines will enhance the reliability of flux data in the literature, foster greater collaboration, and accelerate discoveries in metabolic engineering, systems biology, and biomedical research.
13C Metabolic Flux Analysis (13C-MFA) and Flux Balance Analysis (FBA) are two cornerstone techniques in metabolic engineering and systems biology used to quantify intracellular reaction rates, or fluxes [17]. While both methods analyze metabolic networks at steady-state, they differ fundamentally in their approaches and data requirements. FBA is a constraint-based, predictive modeling approach that calculates flux distributions by assuming the cell optimizes a biological objective, such as maximizing growth rate [76]. In contrast, 13C-MFA is an empirical, data-driven method that infers fluxes by integrating measurements from isotopic tracer experiments [1]. The synergy between these methods is powerful; 13C-MFA provides experimental validation for FBA predictions, while FBA can suggest new hypotheses about cellular objectives that can be tested with 13C-MFA [17] [76]. This application note provides a detailed protocol for conducting a robust comparative analysis between these two methodologies, enabling researchers to benchmark FBA predictions against 13C-MFA results and critically evaluate metabolic model structures.
Theoretical Foundations and Comparative Framework
Key Characteristics of 13C-MFA and FBA
The following table summarizes the core methodological attributes of 13C-MFA and FBA, highlighting their complementary strengths and limitations.
Table 1: Fundamental Characteristics of 13C-MFA and FBA
| Attribute | 13C-MFA | Flux Balance Analysis (FBA) |
|---|---|---|
| Core Principle | Data-driven estimation from isotopic labeling patterns [1] | Prediction based on optimization of a presumed cellular objective [17] |
| Primary Data Used | Mass isotopomer distributions (MIDs) from GC-MS or LC-MS; extracellular fluxes [4] [11] | Stoichiometric matrix; exchange constraints; growth/uptake rates [77] |
| Network Scale | Typically core metabolism (40-100 reactions), with emerging genome-scale methods [78] | Genome-scale (1000+ reactions) [17] [78] |
| Flux Resolution | Can quantify parallel pathways, reversible fluxes, and metabolic cycles [11] | Often predicts net fluxes; may not resolve parallel or cyclic pathways |
| Key Assumption | Metabolic and isotopic steady state [1] [12] | Steady-state mass balance; existence of a cellular objective function [17] |
| Primary Output | Quantitative, absolute fluxes for central carbon metabolism [79] | Predicted flux distribution across the entire network |
The Workflow for Integrated Analysis
The process of benchmarking FBA against 13C-MFA involves a sequence of interconnected steps, from experimental design to model refinement. The diagram below illustrates this workflow and the critical points of comparison between the two methods.
Diagram 1: Workflow for benchmarking FBA predictions against 13C-MFA results.
Experimental Protocol for 13C-MFA
Tracer Experiment Design and Execution
A rigorous 13C-MFA study begins with careful experimental design to ensure high-resolution flux estimates.
- Tracer Selection: Use multiple parallel tracers to maximize flux resolution. For central carbon metabolism, common choices include [1,2-13C]glucose and [U-13C]glucose. The use of mixtures of differently labeled substrates is recommended to generate rich, complementary labeling patterns [1] [4].
- Cultivation System: Perform cultivations in controlled bioreactors or mini-bioreactors (e.g., ambr systems) to ensure metabolic steady-state. For mammalian cells, metabolic steady-state is typically achieved in continuous culture or during the exponential growth phase in batch culture [79].
- Tracer Pulse: Introduce the labeled substrate after the culture has reached a steady growth rate. Ensure the system reaches isotopic steady-state by allowing for at least five residence times (5 × 1/μ, where μ is the specific growth rate) before sampling [4].
- Sample Collection: Collect multiple replicates for each condition. Quench metabolism rapidly (e.g., using cold methanol). Snap-freeze samples in liquid nitrogen and store at -80°C until analysis.
Metabolite Labeling and Flux Estimation
This protocol details the extraction and measurement of isotopic labeling for flux calculation.
Metabolite Extraction:
- Materials: Cold methanol (≤ -40°C), phosphate buffered saline (PBS), deionized water, chloroform.
- Procedure: For intracellular metabolites, resuspend cell pellets in 1 mL of cold 100% methanol. Add 1 mL of PBS and 1 mL of chloroform. Vortex vigorously for 1 minute. Centrifuge at 14,000 × g for 15 minutes at 4°C. Collect the aqueous (upper) phase and the organic (lower) phase separately. Dry the samples completely under a gentle stream of nitrogen gas [11].
Isotopic Labeling Measurement:
- Instrumentation: Gas Chromatography-Mass Spectrometry (GC-MS) or Liquid Chromatography-Mass Spectrometry (LC-MS).
- Derivatization (for GC-MS): For amino acids and organic acids, derivatize dried extracts using 20 μL of MSTFA (N-Methyl-N-(trimethylsilyl)trifluoroacetamide) at 60°C for 1 hour.
- Data Acquisition: Inject 1 μL of the derivatized sample in splitless mode. Use electron impact ionization (EI) for GC-MS. Acquire data in scan mode (e.g., m/z 50-600) to capture the full mass isotopomer distribution (MID) [4] [11].
Flux Estimation with Computational Tools:
- Software: Use established platforms such as INCA (Isotopomer Network Compartmental Analysis), OpenFLUX, or Iso2Flux.
- Procedure: a. Construct a stoichiometric model of the core metabolic network including atom transitions. b. Input the measured extracellular fluxes (e.g., substrate uptake, product secretion, growth rate). c. Input the uncorrected MIDs for intracellular metabolites. d. Perform non-linear least-squares regression to find the flux values that minimize the difference between the simulated and measured MIDs. e. Run a statistical analysis to determine the goodness-of-fit (e.g., χ²-test) and calculate 95% confidence intervals for the estimated fluxes [20] [11].
Protocol for FBA Model Simulation and Refinement
Constraint-Based Model Simulation
This protocol guides the setup and execution of an FBA simulation for comparison with 13C-MFA results.
Model and Objective Selection:
- Model: Select a context-appropriate, curated genome-scale model (e.g., iJO1366 for E. coli, RECON for human metabolism).
- Objective Function: A common starting objective is the maximization of biomass reaction. However, alternative objectives (e.g., maximizing ATP yield, minimizing total flux) or data-driven frameworks like TIObjFind should be explored [77] [76].
Applying Constraints:
- Materials: COBRA Toolbox (MATLAB) or cobrapy (Python).
- Procedure: Constrain the model using the experimentally measured extracellular fluxes from the 13C-MFA experiment (e.g., glucose uptake rate, growth rate). Apply these as upper and lower bounds on the respective exchange reactions in the model [76].
Flux Prediction:
- Use linear programming to solve for the flux distribution that optimizes the chosen objective function subject to the applied constraints.
- For models with multiple optimal solutions, perform Flux Variability Analysis (FVA) to determine the range of possible fluxes for each reaction while maintaining the optimal objective value [17].
Model Refinement Using 13C-MFA Data
The comparison with 13C-MFA data provides a pathway to refine and improve FBA models.
- Identify Systematic Discrepancies: Compare the FBA-predicted fluxes against the 13C-MFA estimated fluxes for reactions in central carbon metabolism (e.g., TCA cycle, pentose phosphate pathway). Large, consistent differences indicate a potential mis-specification of the model's objective function or network gaps [76].
- Test Alternative Objectives: If the biomass-maximization objective fails to recapitulate 13C-MFA fluxes, use the MFA data to infer a context-specific objective. Frameworks like TIObjFind can identify a weighted combination of fluxes (Coefficients of Importance) that best aligns FBA predictions with the experimental data [77].
- Incorporate Additional Constraints: Integrate transcriptomic or proteomic data using algorithms like GIMME or GIM3E to create a more context-specific model that reflects the cell's actual enzyme investment [20].
Case Study: Benchmarking inE. coli
A seminal study on E. coli K-12 MG1655 grown aerobically and anaerobically on glucose provides a clear example of this benchmarking approach [76]. The quantitative results and comparative analysis are summarized below.
Table 2: Comparative Flux Analysis of E. coli Central Metabolism (Flux values normalized to glucose uptake rate = 100)
| Metabolic Reaction / Pathway | Aerobic 13C-MFA Flux | Aerobic FBA (Biomass Max) | Anaerobic 13C-MFA Flux | Anaerobic FBA (Biomass Max) |
|---|---|---|---|---|
| Glycolysis | ||||
| Glucose Uptake | 100.0 | 100.0 | 100.0 | 100.0 |
| Net Flux to Pyruvate | 184.5 | 191.2 | 199.8 | 205.5 |
| Pentose Phosphate Pathway | ||||
| G6PDH Flux | 17.8 | 25.1 | 28.5 | 33.7 |
| TCA Cycle | ||||
| Citrate Synthase (CS) | 16.1 | 68.4 | 5.2 | 12.1 |
| Isocitrate Dehydrogenase (ICDH) | 15.3 | 65.9 | 4.8 | 11.5 |
| Anaplerotic Pathways | ||||
| PEP Carboxykinase | 11.2 | 0.0 | 0.0 | 0.0 |
| Fermentation Products | ||||
| Acetate Secretion | 10.5 | 0.0 | 61.3 | 55.8 |
Key Findings and Interpretation:
- Glycolysis and PPP: FBA and 13C-MFA showed good agreement for the upper glycolytic and pentose phosphate pathways under both conditions, validating the core network structure [76].
- TCA Cycle Operation: A major discrepancy was found in the aerobic TCA cycle. 13C-MFA revealed a low, non-cyclic flux, with citrate synthase flux at 16.1, while FBA predicted a high, cyclic flux (68.4). This suggested that under these conditions, E. coli does not operate a cyclic TCA cycle for energy generation but uses it primarily for biosynthetic precursor supply [76]. This finding directly challenges a common assumption in FBA models.
- Model Refinement: The 13C-MFA data provided a quantitative basis for refining the FBA model's constraints and objective function, leading to a more accurate representation of E. coli's metabolic physiology.
The Scientist's Toolkit: Essential Reagents and Software
Table 3: Key Research Reagents and Computational Tools for 13C-MFA and FBA
| Item Name | Function/Application | Example Specifications / Notes |
|---|---|---|
| [1,2-13C] Glucose | Tracer for 13C-MFA; labels glycolysis and PPP-derived metabolites. | ≥ 99% atom purity; crucial for resolving parallel pathways [4]. |
| [U-13C] Glucose | Uniformly labeled tracer; provides comprehensive labeling information. | ≥ 99% atom purity; used in tracer mixtures [1]. |
| MSTFA (N-Methyl-N-(trimethylsilyl)trifluoroacetamide) | Derivatization agent for GC-MS analysis of polar metabolites. | Protects polar groups and enables volatilization for GC separation [11]. |
| INCA Software | Comprehensive software suite for 13C-MFA and INST-MFA. | Supports both stationary and non-stationary flux analysis; user-friendly GUI [12] [11]. |
| COBRA Toolbox | MATLAB toolbox for constraint-based modeling and simulation (FBA, FVA). | Requires a genome-scale metabolic model in SBML format [17]. |
| cobrapy | Python package for constraint-based modeling. | Open-source alternative to COBRA Toolbox; integrates with data science stacks [77]. |
The synergistic benchmarking of 13C-MFA and FBA moves beyond simple validation to create a powerful cycle of metabolic discovery. 13C-MFA provides the essential empirical ground truth against which FBA's predictive hypotheses are tested [17] [76]. Discrepancies between them are not failures but opportunities—to question the biological relevance of an FBA objective function, to uncover previously unknown metabolic functions like a non-cyclic TCA cycle, or to identify gaps in the genomic annotation of a metabolic network [76] [78]. By adhering to the detailed protocols and minimum reporting standards outlined here, researchers can ensure their flux analyses are reproducible, robust, and capable of generating deep, mechanistic insights into cellular physiology, ultimately accelerating progress in metabolic engineering and biomedical research [11].
Conclusion
13C Metabolic Flux Analysis has matured into an indispensable tool for quantitatively understanding cellular metabolism, bridging the gap between genotypic potential and phenotypic function. By adhering to rigorous protocols—from thoughtful experimental design and precise analytical measurements to robust computational modeling and thorough statistical validation—researchers can generate highly reliable flux maps. Future directions point toward the integration of 13C-MFA with other omics data, the application of Bayesian statistics for uncertainty quantification, and the increased use of isotopically non-stationary frameworks for probing complex systems like human tissues and clinical samples. These advancements will further solidify the role of fluxomics in driving innovations in biotechnology and in elucidating the metabolic underpinnings of human disease, ultimately informing novel therapeutic strategies.
References
- 1. 13C metabolic flux analysis - PubMed Central - NIH [https://pmc.ncbi.nlm.nih.gov/articles/PMC9493264/]
- 2. Metabolic flux analysis: a comprehensive review on sample ... [https://pmc.ncbi.nlm.nih.gov/articles/PMC9449821/]
- 3. Metabolomics, metabolic flux analysis and cancer ... [https://pubmed.ncbi.nlm.nih.gov/33662451/]
- 4. Overview of 13c Metabolic Flux Analysis [https://www.creative-proteomics.com/resource/13c-metabolic-flux-analysis.htm]
- 5. Publishing 13C metabolic flux analysis studies: A review ... [https://www.sciencedirect.com/science/article/abs/pii/S1096717613000839]
- 6. A guide to 13C metabolic flux analysis for the cancer biologist [https://www.nature.com/articles/s12276-018-0060-y]
- 7. The Design of FluxML: A Universal Modeling Language for ... [https://pmc.ncbi.nlm.nih.gov/articles/PMC6543931/]
- 8. OpenFLUX2: 13C-MFA modeling software package adjusted ... [https://microbialcellfactories.biomedcentral.com/articles/10.1186/s12934-014-0152-x]
- 9. 13C-metabolic flux analysis of K562 cells before and after ... [https://pubmed.ncbi.nlm.nih.gov/41173783/]
- 10. 13C-metabolic flux analysis of K562 cells before and after ... [https://www.sciencedirect.com/science/article/abs/pii/S138917232500266X]
- 11. Publishing 13C metabolic flux analysis studies: A review and ... [https://pmc.ncbi.nlm.nih.gov/articles/PMC5866723/]
- 12. Systematic comparison of local approaches for isotopically ... [https://www.frontiersin.org/journals/plant-science/articles/10.3389/fpls.2023.1178239/full]
- 13. 13C-Metabolic Flux Analysis [https://bio-protocol.org/exchange/minidetail?id=4873238&type=30]
- 14. Global 13C tracing and metabolic flux analysis of intact ... [https://www.nature.com/articles/s42255-024-01119-3]
- 15. Metabolic flux and enrichment studies using MIMOSA [https://research.yale.edu/cores/mimosa]
- 16. Approaches to stable isotope tracing and in vivo ... [https://pmc.ncbi.nlm.nih.gov/articles/PMC12170854/]
- 17. Model Validation and Selection in Metabolic Flux Analysis and ... [https://pmc.ncbi.nlm.nih.gov/articles/PMC10922127/]
- 18. A guide to metabolic flux analysis in metabolic engineering [https://www.sciencedirect.com/science/article/abs/pii/S1096717620301683]
- 19. 13 C metabolic flux analysis [https://www.frontiersin.org/journals/molecular-neuroscience/articles/10.3389/fnmol.2022.883466/full]
- 20. p13CMFA: Parsimonious 13C metabolic flux analysis [https://journals.plos.org/ploscompbiol/article?id=10.1371/journal.pcbi.1007310]
- 21. Accurate and rapid determination of metabolic flux by deep ... [https://pmc.ncbi.nlm.nih.gov/articles/PMC10659294/]
- 22. 13CFLUX - Third-generation high-performance engine for ... [https://arxiv.org/html/2509.23847]
- 23. Model Validation and Selection in Metabolic Flux Analysis and ... [https://pmc.ncbi.nlm.nih.gov/articles/PMC10055486/]
- 24. A guide to 13C metabolic flux analysis for the cancer biologist [https://pmc.ncbi.nlm.nih.gov/articles/PMC5938039/]
- 25. Optimal tracers for parallel labeling experiments and 13C ... [https://pmc.ncbi.nlm.nih.gov/articles/PMC5891732/]
- 26. Integrated 13C-metabolic flux analysis of 14 parallel labeling ... [https://pmc.ncbi.nlm.nih.gov/articles/PMC5845449/]
- 27. Multi-objective experimental design for 13 C-based ... [https://www.sciencedirect.com/science/article/abs/pii/S0025556415001480]
- 28. Dual strategy for 13C-Metabolic flux analysis of central ... [https://www.sciencedirect.com/science/article/abs/pii/S0039914023008251]
- 29. Shoot tip culture: a step towards 13C metabolite flux analysis ... [https://plantmethods.biomedcentral.com/articles/10.1186/s13007-019-0434-8]
- 30. Metabolic flux analysis: a comprehensive review on ... [https://www.sciencedirect.com/org/science/article/pii/S2046206922017545]
- 31. Metabolic flux analysis: a comprehensive review on sample ... [https://pubs.rsc.org/en/content/articlehtml/2022/ra/d2ra03326g]
- 32. Metabolic flux analysis at ultra short time scale: Isotopically ... [https://www.sciencedirect.com/science/article/abs/pii/S0168165606009722]
- 33. Validation of carbon isotopologue distribution measurements ... [https://pmc.ncbi.nlm.nih.gov/articles/PMC9871494/]
- 34. Isotope-dilution-LC-MS/MS candidate reference ... [https://pmc.ncbi.nlm.nih.gov/articles/PMC11396040/]
- 35. Isotope Labeling-assisted Evaluation of Hydrophilic and ... [https://pmc.ncbi.nlm.nih.gov/articles/PMC6324930/]
- 36. Combining Hydrophilic Interaction Chromatography (HILIC ... [https://www.mdpi.com/2218-1989/3/3/575]
- 37. LipidQuan: HILIC-based LC-MS/MS High-Throughput ... [https://www.waters.com/nextgen/us/en/library/application-notes/2019/lipidquan-hilic-based-lc-ms-high-throughput-targeted-free-fatty-acid-screen.html?srsltid=AfmBOooyG5M3_7br3RVEYhedLBi8RL3bxQqakvYhchPOXpSsZTV41t_F]
- 38. MFA Suite™ | MFA Suite [https://mfa.vueinnovations.com/mfa]
- 39. METRAN - Software for 13C-metabolic Flux Analysis [https://tlo.mit.edu/industry-entrepreneurs/available-technologies/metran-software-13c-metabolic-flux-analysis]
- 40. 13CFLUX - Third-generation high-performance engine for ... [https://pubmed.ncbi.nlm.nih.gov/41252427/]
- 41. INCA 2.0: A tool for integrated, dynamic modeling of NMR [https://www.sciencedirect.com/science/article/abs/pii/S1096717621001956]
- 42. Comprehensive metabolic modeling of multiple 13C ... - PMC [https://pmc.ncbi.nlm.nih.gov/articles/PMC5114467/]
- 43. 13C metabolic flux analysis of microbial and mammalian ... [https://www.sciencedirect.com/science/article/abs/pii/S1096717616300519]
- 44. The Design of FluxML: A Universal Modeling Language for ... [https://www.frontiersin.org/journals/microbiology/articles/10.3389/fmicb.2019.01022/full]
- 45. High-resolution 13 metabolic flux analysis | Nature C Protocols [https://www.nature.com/articles/s41596-019-0204-0?error=cookies_not_supported&code=da3f06f1-18c1-446e-be2e-05a9d6d6580e]
- 46. Validation-based model selection for 13C metabolic flux ... [https://journals.plos.org/ploscompbiol/article?id=10.1371/journal.pcbi.1009999]
- 47. 13CFLUX2—high-performance software suite for 13C ... [https://pmc.ncbi.nlm.nih.gov/articles/PMC3530911/]
- 48. Elementary Metabolite Units (EMU): a novel framework for ... [https://pmc.ncbi.nlm.nih.gov/articles/PMC1994654/]
- 49. 13C metabolic flux analysis at a genome-scale [https://www.sciencedirect.com/science/article/abs/pii/S1096717615001032]
- 50. Metabolic flux analysis elucidates perfluorooctanoic acid ... [https://www.sciencedirect.com/science/article/abs/pii/S0269749125010954]
- 51. Metabolic flux analysis in hiPSC-CMs reveals insights into ... [https://pmc.ncbi.nlm.nih.gov/articles/PMC11965053/]
- 52. Flux-analysis [https://fiehnlab.ucdavis.edu/staff/kind/metabolomics/flux-analysis]
- 53. Hybrid optimization for 13C metabolic flux analysis using ... [https://pubmed.ncbi.nlm.nih.gov/18366780/]
- 54. Hybrid optimization for 13C metabolic flux analysis using ... [https://pmc.ncbi.nlm.nih.gov/articles/PMC2333969/]
- 55. Hybrid optimization for 13C metabolic flux analysis using ... [https://bmcsystbiol.biomedcentral.com/articles/10.1186/1752-0509-2-29]
- 56. Rethinking 13C-metabolic flux analysis – The Bayesian ... [https://www.sciencedirect.com/science/article/pii/S1096717624000508]
- 57. 13CFLUX - Third-generation high-performance engine for ... [https://arxiv.org/abs/2509.23847]
- 58. The topology of genome-scale metabolic reconstructions ... [https://journals.plos.org/ploscompbiol/article?id=10.1371/journal.pcbi.1010203]
- 59. 32.4: Isotope Dilution Methods [https://chem.libretexts.org/Bookshelves/Analytical_Chemistry/Instrumental_Analysis_(LibreTexts)/32%3A_Radiochemical_Methods/32.04%3A_Isotope_Dilution_Methods]
- 60. Isotope dilution [https://en.wikipedia.org/wiki/Isotope_dilution]
- 61. ScalaFlux: A scalable approach to quantify fluxes in metabolic ... [https://pmc.ncbi.nlm.nih.gov/articles/PMC7182278/]
- 62. 13C-Metabolic Flux Analysis: An Accurate Approach to ... [https://www.mdpi.com/2306-5354/3/1/3]
- 63. Chi-Square Goodness of Fit Test Introduction to Statistics [https://www.jmp.com/en/statistics-knowledge-portal/chi-square-test/chi-square-goodness-of-fit-test]
- 64. AP Statistics Chi-Square Test Explained | Step-by- ... [https://www.revisiondojo.com/blog/ap-statistics-chi-square-test-explained-or-step-by-step-2025-guide]
- 65. Chi-Square Test Statistical Analysis & Testing [https://www.acte.in/chi-square-test-article]
- 66. 14.2: Chi-squared Goodness of Fit [https://stats.libretexts.org/Bookshelves/Introductory_Statistics/Statistics%3A_Open_for_Everyone_(Peter)/14%3A_Chi-Squared/14.02%3A_Chi-squared_Goodness_of_Fit]
- 67. Practical guide to calculate sample size for chi-square test in ... [https://pmc.ncbi.nlm.nih.gov/articles/PMC12107878/]
- 68. Validation-based model selection for 13C metabolic flux ... [https://pubmed.ncbi.nlm.nih.gov/35404953/]
- 69. Validation-based model selection for 13C metabolic flux ... [https://pmc.ncbi.nlm.nih.gov/articles/PMC9022838/]
- 70. Parallel labeling experiments validate Clostridium ... [https://www.sciencedirect.com/science/article/abs/pii/S1096717614001050]
- 71. Robustifying Experimental Tracer Design for13C-Metabolic ... [https://www.frontiersin.org/journals/bioengineering-and-biotechnology/articles/10.3389/fbioe.2021.685323/full]
- 72. Fluxer: a web application to compute, analyze and ... [https://pmc.ncbi.nlm.nih.gov/articles/PMC7319574/]
- 73. Fluxer: Home [https://fluxer.umbc.edu/]
- 74. Selection of Tracers for 13C-Metabolic Flux Analysis using ... [https://pmc.ncbi.nlm.nih.gov/articles/PMC6474252/]
- 75. Rational design of 13C-labeling experiments for metabolic flux ... [https://bmcsystbiol.biomedcentral.com/articles/10.1186/1752-0509-6-43]
- 76. Synergy between 13 C-metabolic flux analysis and ... [https://www.sciencedirect.com/science/article/abs/pii/S1096717610001023]
- 77. Optimization-based framework with flux balance analysis (FBA ... [https://pmc.ncbi.nlm.nih.gov/articles/PMC12578352/]
- 78. Metabolic flux analysis reaching genome wide coverage [https://www.sciencedirect.com/science/article/abs/pii/S2211339820300356]
- 79. 13C metabolic flux analysis in cell line and bioprocess ... [https://www.sciencedirect.com/science/article/abs/pii/S2211339821000502]