13C Isotope Tracing in Proteins: A Complete GC-MS Guide for Metabolic Pathway Analysis
This article provides a comprehensive guide for researchers and drug development scientists on utilizing Gas Chromatography-Mass Spectrometry (GC-MS) to detect 13C isotopic patterns in protein-bound amino acids.
13C Isotope Tracing in Proteins: A Complete GC-MS Guide for Metabolic Pathway Analysis
Abstract
This article provides a comprehensive guide for researchers and drug development scientists on utilizing Gas Chromatography-Mass Spectrometry (GC-MS) to detect 13C isotopic patterns in protein-bound amino acids. It covers the foundational principles of stable isotope tracing for probing cellular metabolism, details the complete methodological workflow from sample preparation to data interpretation, addresses common troubleshooting and optimization challenges, and validates the approach against alternative techniques. The content serves as a practical resource for applying this powerful analytical method to study metabolic reprogramming in cancer, monitor drug efficacy, and investigate disease-specific metabolic phenotypes.
The Power of 13C Tracing: Decoding Metabolic Flux Through Protein-Bound Amino Acids
Stable Isotope-Resolved Metabolomics (SIRM) is a powerful analytical framework that utilizes non-radioactive isotopic tracers (e.g., ¹³C, ¹⁵N, ²H) to track the fate of atoms through metabolic networks. Within the context of a thesis focusing on GC-MS detection of ¹³C patterns in protein-bound amino acids, SIRM provides the critical methodology to trace in vivo metabolic activity. The analysis of protein-bound amino acids offers a stable, time-integrated snapshot of metabolic flux, circumventing the lability of free metabolites and reflecting the metabolic history of the cell or tissue over the protein's lifetime. ¹³C-glucose or ¹³C-glutamine tracers are fed to biological systems, and the resulting isotopically labeled patterns (isotopologues) in isolated and hydrolyzed protein-derived amino acids are detected by GC-MS. This reveals the activities of pathways such as glycolysis, the TCA cycle, and anaplerotic reactions, which is indispensable for research in cancer metabolism, metabolic disorders, and drug mechanism-of-action studies.
Core Principles and Quantitative Data
Common Tracers and Their Metabolic Entry Points
The choice of ¹³C tracer determines which metabolic pathways are illuminated. The table below summarizes key tracers used in protein-bound amino acid research.
Table 1: Common ¹³C Tracers for SIRM Studies of Protein-Bound Amino Acids
| Tracer | Primary Entry Point | Key Pathways Probed | Information Gained from Protein-Bound AA |
|---|---|---|---|
| [1,2-¹³C₂]Glucose | Glycolysis | Glycolysis, PPP, TCA Cycle | Glycolytic flux, Pyruvate entry, TCA cycle activity (via Ala, Ser, Asp, Glu). |
| [U-¹³C₆]Glucose | Glycolysis | Full central carbon metabolism | Complete isotopomer mapping for rigorous flux analysis (all amino acids). |
| [U-¹³C₅]Glutamine | TCA Cycle (α-KG) | Glutaminolysis, TCA Cycle, Reductive carboxylation | Glutamine contribution to TCA cycle, IDH activity (Glu, Asp, Pro). |
| [3-¹³C]Lactate | Pyruvate pool | Gluconeogenesis, TCA Cycle | Cori cycle activity, mitochondrial pyruvate metabolism (Ala, Asp, Glu). |
Expected ¹³C Enrichment Patterns in Key Amino Acids
After tracer infusion, specific labeling patterns emerge in amino acids based on precursor metabolite labeling.
Table 2: Representative ¹³C Labeling Patterns in Protein-Bound Amino Acids from [U-¹³C₆]Glucose
| Amino Acid | Precursor Metabolite(s) | Key Isotopologue (M+X) | Interpretation |
|---|---|---|---|
| Alanine | Pyruvate | M+3 | Direct glycolytic flux to pyruvate. |
| Serine | 3-Phosphoglycerate | M+3 | Glycolytic flux through upper glycolysis. |
| Aspartate | Oxaloacetate (OAA) | M+2, M+3 | TCA cycle activity from acetyl-CoA (M+2) or pyruvate carboxylase (M+3). |
| Glutamate | α-Ketoglutarate (α-KG) | M+2, M+4, M+5 | TCA cycle turn number and anapleurosis. M+5 indicates reductive metabolism. |
| Proline | Glutamate | M+2, M+4, M+5 | Reflects glutamate labeling; indicates collagen turnover or stress response. |
Experimental Protocols
Protocol 1: Cell Culture SIRM Experiment with [U-¹³C₆]Glucose and Protein Isolation
Objective: To trace glucose-derived carbon into the protein-bound amino acid pool of cultured cells.
Materials:
- Cell line of interest.
- Standard and tracer media: Glucose-free DMEM supplemented with 10% dialyzed FBS and either 25 mM [U-¹³C₆]glucose (tracer) or 25 mM unlabeled glucose (control).
- PBS (phosphate-buffered saline), pH 7.4.
- Lysis Buffer: RIPA buffer supplemented with protease inhibitors.
- Pre-chilled Methanol, Chloroform, Water for protein precipitation.
- 6M Hydrochloric Acid (HCl).
- Nitrogen or SpeedVac evaporator.
Method:
- Cell Seeding & Quenching: Seed cells and grow to ~70% confluence. Wash cells twice with warm PBS. Replace media with tracer or control media.
- Tracer Incubation: Incubate for a defined period (e.g., 24h) to allow tracer incorporation into proteins.
- Harvest & Protein Extraction: Wash cells 3x with ice-cold PBS. Scrape cells into cold PBS and pellet. Lyse pellet in RIPA buffer on ice for 30 min. Centrifuge (14,000g, 15 min, 4°C) to clear debris.
- Protein Precipitation: Transfer supernatant to a new tube. Add 4 volumes of cold methanol, vortex, then add 1 volume chloroform, and 3 volumes water. Vortex vigorously. Centrifuge (10,000g, 15 min, 4°C). The protein forms a firm interphase layer.
- Protein Wash: Carefully remove upper aqueous and lower organic layers. Add 3 volumes methanol to the protein interphase, vortex, and centrifuge (10,000g, 10 min, 4°C). Decant supernatant. Air-dry the protein pellet.
- Protein Hydrolysis: Add 200 µL of 6M HCl to the dried protein pellet. Hydrolyze at 110°C for 24h under nitrogen or in a sealed tube to prevent oxidation.
- Hydrolysate Derivatization for GC-MS: Dry the hydrolysate under nitrogen or SpeedVac. Derivatize with 50 µL of N-tert-Butyldimethylsilyl-N-methyltrifluoroacetamide (MTBSTFA) with 1% tert-butyldimethylchlorosilane (TBDMCS) in pyridine at 70°C for 1h. Analyze by GC-MS.
Protocol 2: GC-MS Analysis of Derivatized Amino Acid Isotopologues
Objective: To separate and detect the mass isotopomer distributions of protein-derived amino acids.
GC-MS Parameters (Example):
- Instrument: Agilent 7890B GC / 5977B MSD.
- Column: DB-35MS or equivalent (30 m × 0.25 mm i.d., 0.25 µm film).
- Inlet: 250°C, Splitless mode.
- Carrier Gas: Helium, constant flow (1.0 mL/min).
- Oven Program: 100°C (hold 2 min), ramp at 5°C/min to 180°C, then at 10°C/min to 300°C (hold 5 min).
- Transfer Line: 280°C.
- MS Source: 230°C.
- MS Quad: 150°C.
- Detection: Electron Impact (EI) at 70 eV, SIM (Selected Ion Monitoring) and/or full scan (m/z 50-650).
Data Processing:
- Peak Integration: Integrate chromatographic peaks for each amino acid (as TBDMS derivatives).
- Correct for Natural Isotope Abundance: Use software (e.g., IsoCor, AccuCor) to correct raw mass spectral intensities for the natural abundance of ¹³C, ²H, ²⁹Si, ³⁰Si, etc.
- Calculate Isotopologue Fractions: Determine the molar fraction (M+0, M+1, M+2, ... M+n) for each amino acid.
The Scientist's Toolkit: Key Research Reagent Solutions
Table 3: Essential Materials for SIRM of Protein-Bound Amino Acids
| Item | Function/Description |
|---|---|
| Dialyzed Fetal Bovine Serum (FBS) | Removes small molecules (e.g., glucose, amino acids) to prevent dilution of the added tracer. |
| ¹³C-Labeled Tracer (e.g., [U-¹³C₆]Glucose) | The metabolic probe; introduces detectable isotopic label into metabolic networks. |
| Protein Hydrolysis Tubes (Sealed/Under N₂) | Prevents oxidative loss of amino acids (e.g., Cys, Met, Trp) during high-temperature acid hydrolysis. |
| 6M Hydrochloric Acid (HCl), TraceMetal Grade | Hydrolyzes peptide bonds to release free amino acids from the protein pellet. |
| Derivatization Reagent: MTBSTFA + 1% TBDMCS | Forms volatile tert-butyldimethylsilyl (TBDMS) derivatives of amino acids for GC-MS analysis, providing excellent chromatographic properties and distinct fragmentation. |
| GC-MS Instrument with Electron Impact Ionization | Separates (GC) and fragments (EI-MS) derivatized amino acids, generating reproducible mass spectra for isotopologue analysis. |
| Isotopic Natural Abundance Correction Software | Essential for deconvoluting tracer-derived enrichment from background natural abundance isotopes. |
Visualizations
Diagram 1: Central Carbon Metabolism Tracing from 13C Glucose
Diagram 2: GC-MS Workflow for Protein-Bound AA 13C Analysis
Why Protein-Bound Amino Acids Are Superior Metabolic Snapshots
Within metabolic flux research, the isotopic labeling pattern (e.g., 13C) of metabolites provides a dynamic but transient snapshot. In contrast, the analysis of protein-bound amino acids (PBAAs) offers a stable, time-integrated record of metabolic network activity. This is because amino acids, once incorporated into protein, are isolated from the rapid turnover of the free intracellular pool. Their labeling patterns thus reflect the average metabolic state over the protein's lifetime, providing a superior "metabolic snapshot" for steady-state investigations. This Application Note details protocols and workflows for GC-MS analysis of 13C patterns in PBAAs, framed within a broader thesis on their application in biomedical and drug development research.
Key Advantages: PBAA vs. Free Pool Analysis
Table 1: Comparative Analysis of Metabolic Snapshot Sources
| Parameter | Free Intracellular Amino Acids | Protein-Bound Amino Acids (PBAAs) |
|---|---|---|
| Temporal Resolution | Seconds to minutes (transient) | Hours to days (integrated) |
| Metabolic "Noise" | High (subject to rapid dilution/transport) | Low (protected from short-term fluctuations) |
| Sample Stability | Low (requires immediate quenching) | High (stable in harvested biomass) |
| Primary Information | Instantaneous flux state | Time-averaged net flux through pathways |
| Ideal Application | Dynamic flux analysis (e.g., INST-MFA) | Steady-state phenotype comparison, long-term tracer studies |
Table 2: Quantitative 13C Enrichment Data from a Model Cell Study
| Amino Acid | Precursor(s) in Pathway | Avg. 13C M+3 Enrichment (Free Pool) | Avg. 13C M+3 Enrichment (PBAA) | Coefficient of Variation (Free Pool) | Coefficient of Variation (PBAA) |
|---|---|---|---|---|---|
| Alanine | Pyruvate | 45.2% | 43.8% | 18.7% | 5.2% |
| Glutamate | α-Ketoglutarate | 38.7% | 39.1% | 22.3% | 4.1% |
| Aspartate | Oxaloacetate | 31.5% | 32.0% | 25.9% | 5.9% |
| Serine | 3-Phosphoglycerate | 28.4% | 29.5% | 30.1% | 6.8% |
The Scientist's Toolkit: Research Reagent Solutions
Table 3: Essential Reagents and Materials for PBAA Analysis
| Item | Function & Critical Note |
|---|---|
| U-13C Glucose (or other tracer) | Stable isotope precursor for metabolic labeling; defines the input for flux analysis. |
| 6M Hydrochloric Acid (HCl), Under N2 | For protein hydrolysis; acid must be deoxygenated to prevent oxidative degradation of amino acids (e.g., Met, Cys). |
| Norleucine or Norvaline Internal Standard | Added pre-hydrolysis for quantification; corrects for losses during hydrolysis and derivatization. |
| Derivatization Reagents: MTBSTFA or MCF | MTBSTFA: Forms tert-butyldimethylsilyl (TBDMS) derivatives for excellent fragmentation. MCF: Forms methyl chloroformate derivatives for polar, aqueous samples. |
| Solid Phase Extraction (SPE) Cartridges (C18) | For post-hydrolysis clean-up of amino acids to remove salts and acid, improving GC-MS column life and signal. |
| GC-MS with DB-35ms or Equivalent Column | Standard configuration for high-resolution separation of amino acid derivatives; electron impact (EI) ionization for fragmentation. |
| Stable Isotope Analysis Software (e.g., IsoCorrector) | Corrects for natural isotope abundance and calculates net 13C enrichment in mass isotopomer distributions (MIDs). |
Experimental Protocols
Protocol 1: Cell Culture Labeling & Protein Hydrolysis for PBAA Extraction
- Labeling: Culture cells in standard medium. Replace medium with identical medium containing 13C-labeled substrate (e.g., [U-13C]glucose). Incubate for a duration exceeding 2-3 doubling times to ensure full labeling of the protein pool.
- Quenching & Harvest: Rapidly aspirate medium. Wash cells 2x with ice-cold PBS (pH 7.4). Scrape cells into PBS and pellet by centrifugation (500 x g, 5 min, 4°C).
- Protein Precipitation & Washing: Lyse pellet in 1 mL ice-cold 10% Trichloroacetic Acid (TCA). Vortex and incubate on ice for 30 min. Centrifuge (15,000 x g, 15 min, 4°C). Wash protein pellet 3x with ice-cold 5% TCA, then 2x with ice-cold 100% ethanol.
- Hydrolysis: Dry protein pellet under N2 stream. Add 200 µL of 6M HCl (deoxygenated) containing 0.1% phenol (prevents halogenation). Transfer to a glass hydrolysis tube, flame-seal under vacuum. Hydrolyze at 110°C for 20-24 hours.
- Post-Hydrolysis Processing: Cool, open tube, and filter hydrolysate. Dry under N2 or vacuum. Reconstitute in 0.1M HCl for storage at -80°C or proceed to derivatization.
Protocol 2: Derivatization for GC-MS Analysis (TBDMS Method)
- Preparation: Transfer an aliquot of the amino acid hydrolysate (or standard) containing ~10-50 µg of total amino acids to a GC-MS vial insert. Dry completely under a stream of N2.
- Derivatization: Add 50 µL of acetonitrile and 50 µL of MTBSTFA (+ 1% TBDMCS as catalyst) to the dried residue. Cap tightly.
- Reaction: Heat at 70°C for 60 minutes. Cool to room temperature. The sample is now ready for GC-MS injection (typically 1 µL, splitless mode).
Protocol 3: GC-MS Data Acquisition and MID Analysis
- GC Parameters: Use a DB-35ms column (30 m x 0.25 mm, 0.25 µm). Inlet: 250°C. Oven program: Start at 80°C, ramp at 5°C/min to 280°C, hold 5 min. Carrier Gas: He, constant flow.
- MS Parameters: EI mode at 70 eV. Source temperature: 230°C. Quadrupole: 150°C. Operate in Selected Ion Monitoring (SIM) mode targeting specific fragments for each amino acid derivative (e.g., alanine: m/z 260, 261, 262, 263).
- Data Processing: Integrate peak areas for the targeted mass fragments (M+0, M+1, M+2, etc.). Calculate the Mass Isotopomer Distribution (MID) as the fractional abundance of each isotopologue.
- Correction: Use dedicated software (e.g., IsoCorrector) to correct the raw MIDs for the natural abundance of 13C, 2H, 15N, 18O, 29Si, and 30Si from the derivatization reagent, yielding the net 13C enrichment.
Visualizing the Workflow & Metabolic Logic
Diagram 1: From Tracer to Flux Inference Workflow
Diagram 2: Key PBAA & Precursor Relationships
Key Metabolic Pathways Revealed by 13C Patterns (e.g., Glycolysis, TCA Cycle, PPP, Anaplerosis)
Application Notes
Tracking 13C enrichment patterns in protein-bound amino acids via GC-MS provides a stable, integrated readout of metabolic pathway activities over the lifetime of the protein, free from acute fluctuations. This approach is central to investigating metabolic rewiring in diseases like cancer and for assessing drug mechanisms in development.
The core principle relies on distinct 13C-labeling patterns in precursor metabolites that are faithfully passed on to their derivative amino acids. For instance:
- Glycolysis activity is reflected in the labeling of alanine, serine, and glycine from [3-13C]pyruvate.
- TCA Cycle flux and entry points are deciphered from labeling patterns in glutamate, aspartate, and asparagine.
- Pentose Phosphate Pathway (PPP) relative flux is quantified by the labeling of serine and glycine, which acquire label via the upper glycolytic/PPP intermediate 3-phosphoglycerate.
- Anaplerosis (e.g., via pyruvate carboxylase or glutaminolysis) is revealed through specific labeling motifs in citrate and subsequent TCA cycle derivatives.
Table 1: Characteristic 13C-Labeling Patterns in Protein-Bound Amino Acids from Key Precursors
| Metabolic Pathway | Tracer Input (Common) | Key Diagnostic Amino Acid(s) | Mass Isotopomer Pattern (M+X) | Interpretation of Enriched Pattern |
|---|---|---|---|---|
| Glycolysis | [1-13C]Glucose or [U-13C]Glucose | Alanine (from pyruvate) | M+1 (from [1-13C]glc) or M+3 (from [U-13C]glc) | Direct measure of glycolytic flux to pyruvate. |
| TCA Cycle (Oxidative) | [U-13C]Glucose | Glutamate (M+4, M+2) | M+4 (first turn), M+2 (second turn) | M+4 indicates full entry of [U-13C]acetyl-CoA into TCA. M+2 indicates recycling via pyruvate carboxylase. |
| Anaplerosis (PC) | [U-13C]Glucose | Aspartate (M+3) | M+3 | Specific signature of pyruvate carboxylase activity labeling oxaloacetate. |
| Glutaminolysis | [U-13C]Glutamine | Glutamate (M+5), Citrate (M+5) | M+5 | Direct entry of glutamine-derived α-ketoglutarate into TCA cycle. |
| Pentose Phosphate Pathway | [1,2-13C]Glucose | Serine, Glycine | M+2 (not M+1) | Retention of C1-C2 bond indicates flux through oxidative PPP and non-oxidative PPP recycling. |
Table 2: Example Enrichment Data from a Cancer Cell Study (GC-MS Analysis)
| Cell Line | Tracer | % M+3 Alanine (Glycolysis) | % M+4 Glutamate (TCA Cycle) | % M+2 Serine (PPP) | M+3/M+2 Aspartate Ratio (PC vs. PDH) |
|---|---|---|---|---|---|
| Normal Fibroblast | [U-13C]Glucose | 45.2 ± 3.1 | 18.5 ± 2.0 | 12.8 ± 1.5 | 0.6 ± 0.1 |
| Pancreatic Cancer | [U-13C]Glucose | 68.7 ± 4.5* | 9.2 ± 1.3* | 5.1 ± 0.8* | 2.3 ± 0.4* |
| (Drug-Treated Cancer) | [U-13C]Glucose | 52.1 ± 3.8# | 14.7 ± 1.7# | 10.5 ± 1.2# | 1.1 ± 0.2# |
Data presented as mean ± SD; *p<0.05 vs. Normal, #p<0.05 vs. Untreated Cancer. PC: Pyruvate Carboxylase, PDH: Pyruvate Dehydrogenase.
Experimental Protocols
Protocol 1: Cell Culture 13C-Tracing and Protein-Bound Amino Acid Extraction
Objective: To metabolically label cellular proteins with stable isotopes for subsequent GC-MS analysis of pathway fluxes.
Materials:
- Cells of interest
- 13C-labeled substrate (e.g., [U-13C]glucose, [U-13C]glutamine)
- Dialyzed Fetal Bovine Serum (FBS)
- Glucose-/glutamine-free culture medium
- PBS (Phosphate Buffered Saline)
- Lysis Buffer: 6M Guanidine HCl, 10mM Tris-HCl (pH 8.0)
- Acetone
- 6M HCl
- Nitrogen or Argon gas stream
- Heating block or oven (110°C)
Procedure:
- Cell Seeding & Quiescence: Seed cells in standard medium. At ~70% confluence, wash twice with PBS and incubate in substrate-free medium with dialyzed FBS for 1-2 hours to deplete intracellular pools.
- Tracer Incubation: Replace medium with identical medium containing the desired 13C-labeled tracer (e.g., 10mM [U-13C]glucose). Incubate for a duration sufficient for protein turnover (typically 24-72 hours, cell-type dependent).
- Harvesting: Wash cells 3x with ice-cold PBS. Scrape cells into PBS and pellet by centrifugation (500 x g, 5 min).
- Protein Hydrolysis: Resuspend cell pellet in 1 mL Lysis Buffer. Precipitate proteins by adding 4 mL of cold acetone and incubating at -20°C for 2 hours. Centrifuge (15,000 x g, 10 min, 4°C). Wash pellet twice with cold 80% acetone. Dry pellet under nitrogen stream.
- Hydrolysis: Add 1 mL of 6M HCl to the dried protein pellet. Flush tube headspace with nitrogen/argon, cap tightly. Hydrolyze at 110°C for 24 hours.
- Sample Cleanup: Cool, centrifuge, and transfer hydrolysate to a clean tube. Dry completely under nitrogen stream at 60°C. Resuspend in deionized water for derivatization (see Protocol 2).
Protocol 2: GC-MS Sample Derivatization and Analysis of Proteinogenic Amino Acids
Objective: To convert hydrolyzed amino acids into volatile derivatives suitable for GC-MS separation and isotopologue analysis.
Materials:
- Dried amino acid hydrolysate
- Derivatization solvent: Acetonitrile
- Derivatization reagents: N-tert-Butyldimethylsilyl-N-methyltrifluoroacetamide (MTBSTFA) with 1% tert-Butyldimethylchlorosilane (tBDMCS)
- Pyridine (anhydrous)
- GC-MS system with a 30m DB-35MS or equivalent capillary column
- Glass autosampler vials with inserts
Procedure:
- Derivatization: Redissolve dried hydrolysate in 50 µL of acetonitrile. Add 50 µL of MTBSTFA (+1% tBDMCS) and 50 µL of pyridine. Vortex thoroughly.
- Reaction: Incubate at 70°C for 1 hour. Cool to room temperature. Transfer solution to a GC-MS vial.
- GC-MS Parameters:
- Injection: Split or splitless mode (1 µL), injector temp 280°C.
- Oven Program: Start at 150°C, ramp at 5°C/min to 280°C, hold for 5 min.
- Carrier Gas: Helium, constant flow (~1 mL/min).
- MS: Electron Impact (EI) ionization at 70 eV. Operate in Selected Ion Monitoring (SIM) mode targeting specific mass fragments for each amino acid's tert-butyldimethylsilyl (TBDMS) derivative. Also acquire a full scan (m/z 50-650) for quality control.
- Data Analysis: Integrate peak areas for the selected ions corresponding to the M0, M+1, M+2, etc., isotopologues of each amino acid. Correct for natural isotope abundance using standard algorithms (e.g., IsoCor) and calculate fractional enrichments and mass isotopomer distributions.
Visualizations
Metabolic Network and 13C Tracer Entry Points
GC-MS 13C Proteinogenic AA Analysis Workflow
The Scientist's Toolkit
Table 3: Key Research Reagent Solutions for 13C Metabolic Flux Analysis
| Item | Function / Purpose |
|---|---|
| Dialyzed Fetal Bovine Serum (FBS) | Essential for tracer studies; low-molecular-weight metabolites (sugars, amino acids) are removed to prevent dilution of the 13C-labeled tracer. |
| 13C-Labeled Substrates (e.g., [U-13C]Glucose, [1,2-13C]Glucose, [U-13C]Glutamine) | The isotopic probes that introduce measurable labels into metabolic networks. Purity (>99% 13C) is critical. |
| MTBSTFA (+1% tBDMCS) | Derivatization reagent. Forms volatile tert-butyldimethylsilyl (TBDMS) derivatives of amino acids, providing excellent chromatographic properties and characteristic mass fragments for GC-MS. |
| Guanidine HCl (6M Lysis Buffer) | A strong denaturant that efficiently solubilizes all cellular proteins while instantly quenching enzymatic activity to preserve labeling states. |
| Natural Abundance Correction Software (e.g., IsoCor, AccuCor) | Algorithms mandatory for correcting raw mass spectrometric data for the contribution of naturally occurring 13C, 2H, 15N, 18O, 29Si, etc., to obtain true isotopic enrichment. |
| Metabolic Flux Analysis (MFA) Software (e.g., INCA, IsoDyn, 13C-FLUX) | Computational platforms that use corrected isotopomer data to calculate absolute in vivo metabolic reaction rates (fluxes) in a network model. |
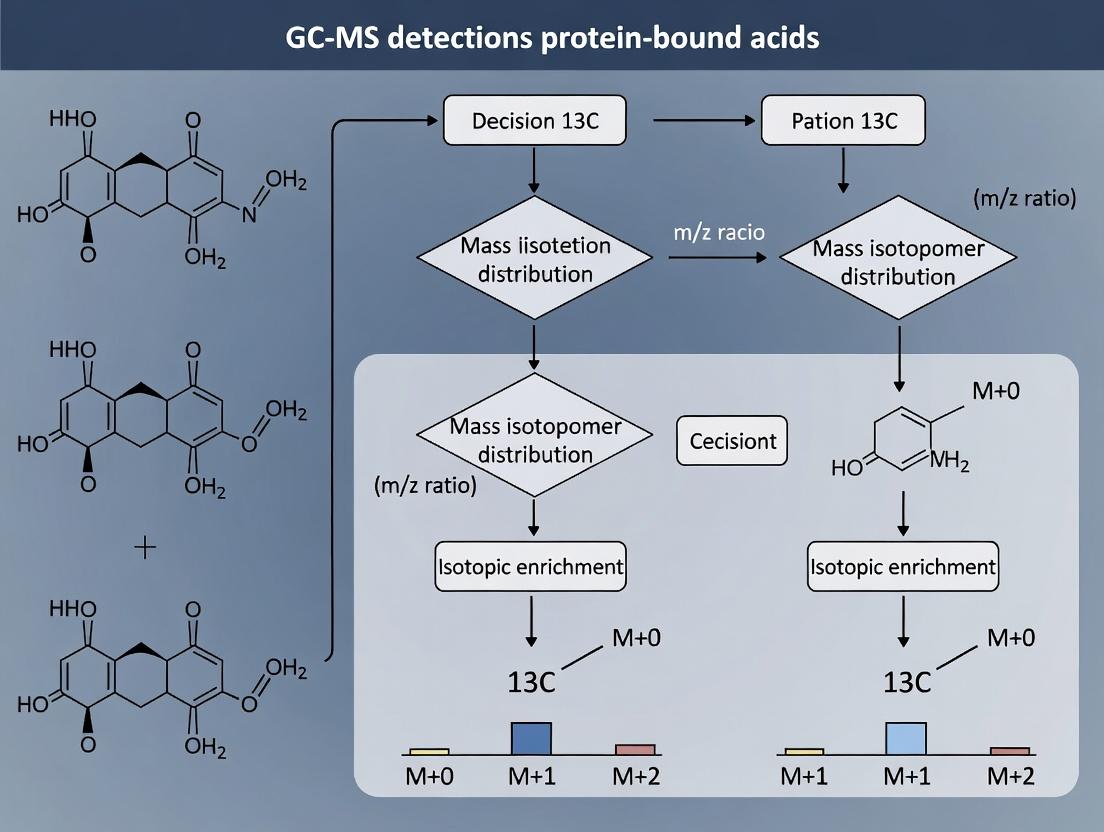
This document details the core principles and protocols for employing Gas Chromatography-Mass Spectrometry (GC-MS) in the analysis of isotopologues and mass isotopomers. Within the broader thesis on "GC-MS Detection of 13C Patterns in Protein-Bound Amino Acids," these methodologies are fundamental for tracing metabolic fluxes. By precisely measuring the incorporation of stable isotopes (e.g., ¹³C) into amino acids hydrolyzed from proteins, we can infer the activities of metabolic pathways in vivo, crucial for research in systems biology, cancer metabolism, and drug development.
Theoretical Foundation and Data Presentation
Isotopologue vs. Mass Isotopomer:
- Isotopologue: Molecules that differ only in their isotopic composition (e.g., alanine with all ¹²C vs. alanine with one ¹³C atom at carbon position 1).
- Mass Isotopomer: A set of isotopologues that share the same nominal mass but may have different isotopic atom positions. GC-MS typically measures mass isotopomers (e.g., all alanine molecules with a mass of M+1, regardless of where the ¹³C is located).
Key Quantitative Metrics: GC-MS data yields ion intensities for specific mass-to-charge (m/z) fragments. The primary calculated metrics are summarized in Table 1.
Table 1: Key Quantitative Metrics in GC-MS Isotopomer Analysis
| Metric | Formula | Description | Application in Flux Analysis |
|---|---|---|---|
| Molecular Ion Cluster (M, M+1, M+2...) | Measured directly from spectrum | Intensities for the unfragmented molecular ion. | Provides total isotope enrichment but lacks positional information. |
| Fragment Ion Cluster | Measured directly from spectrum | Intensities for specific fragment ions (e.g., m/z 232, 233 for TBDMS-alanine). | Used to infer ¹³C enrichment at specific carbon positions within the molecule. |
| Molar Fraction (MF) | MFi = Ii / Σ(I0 to n) | Fraction of molecules with i heavy isotopes. Ii = intensity at M+i. | Corrects for natural abundance; the primary input for metabolic models. |
| Molar Percent Excess (MPE) | MPE = (MFsample - MFnatural) × 100% | Net enrichment above natural abundance. | Direct measure of tracer incorporation. |
| Corrected Mass Isotopomer Distribution (MID) | Calculated via matrix correction (e.g., Isocorrector) | MID after accounting for natural abundance of ¹³C, ²H, ¹⁵N, ²⁹Si, ³⁰Si, ¹⁸O from derivatization. | Essential for accurate interpretation of tracer studies. |
Experimental Protocols
Protocol A: Hydrolysis and Derivatization of Protein-Bound Amino Acids for GC-MS
Objective: To extract and chemically modify amino acids from purified proteins into volatile, thermally stable derivatives suitable for GC-MS.
- Protein Hydrolysis: Place lyophilized, purified protein (≥50 µg) in a glass hydrolysis tube. Add 200 µL of 6M HCl containing 0.1% phenol (to protect tyrosine). Seal tube under vacuum or nitrogen atmosphere. Hydrolyze at 110°C for 18-24 hours.
- Sample Drying: Cool tube, open, and dry the hydrolysate completely under a stream of nitrogen or using a centrifugal vacuum concentrator.
- Derivatization (TBDMS method): a. Add 50 µL of anhydrous acetonitrile and 50 µL of N-(tert-butyldimethylsilyl)-N-methyltrifluoroacetamide (MTBSTFA) with 1% tert-butyldimethylchlorosilane (TBDMCS). b. Vortex vigorously and incubate at 70°C for 60 minutes. c. Cool to room temperature. The sample is now ready for GC-MS injection. Stable for ~48 hours at room temperature.
Protocol B: GC-MS Acquisition for Isotopomer Analysis
Objective: To separate amino acid derivatives and acquire high-quality mass spectra for isotopomer distribution analysis.
- GC Parameters:
- Column: Mid-polarity stationary phase (e.g., 5%-Phenyl-methylpolysiloxane, 30m x 0.25mm ID, 0.25µm film).
- Injection: Split or splitless mode (1-2 µL), 250°C injector temperature.
- Carrier Gas: Helium, constant flow (1.0 mL/min).
- Oven Program: 80°C (hold 2 min), ramp at 5°C/min to 280°C, hold 5 min.
- MS Parameters (Quadrupole):
- Ionization: Electron Impact (EI) at 70 eV.
- Ion Source Temperature: 230°C.
- Transfer Line Temperature: 280°C.
- Data Acquisition: Selected Ion Monitoring (SIM). Critical: Monitor the [M-57]⁺ fragment (loss of tert-butyl group) and/or the molecular ion [M]⁺ for each amino acid. Acquire ions for the base mass (M0) and sufficient isotopologues (e.g., M+1, M+2, M+3). Set dwell time ≥ 50 ms per ion for sufficient data points across the peak.
- System Suitability: Run a standard of unlabeled amino acids to verify retention times, fragmentation, and natural abundance MID.
Protocol C: Data Processing and Correction for Natural Isotopic Abundance
Objective: To convert raw ion intensities into a corrected Mass Isotopomer Distribution (MID) for metabolic modeling.
- Peak Integration: Integrate the ion chromatograms for each monitored m/z value. Sum the absolute intensities (area counts) across the peak for each ion.
- Calculate Raw MID: For each fragment, compute the molar fraction (MF) as shown in Table 1.
- Apply Isotopic Correction: Use a dedicated algorithm (e.g., Isocorrector, a web-based tool). a. Input the raw MID, the chemical formula of the fragment ion, and the derivatization agent used. b. The algorithm uses a matrix correction to subtract the contribution of naturally occurring isotopes (¹³C, ²H, ¹⁵N, ²⁹Si, ³⁰Si) to reveal the true ¹³C enrichment from the tracer. c. The output is the corrected MID, which is used for subsequent calculation of MPE and computational flux analysis.
Visualization: Workflow and Logical Relationships
Workflow for GC-MS Based Isotopomer Analysis of Protein-Bound Amino Acids
Logical Flow of Isotopic Data Correction
The Scientist's Toolkit: Essential Research Reagents & Materials
Table 2: Key Reagent Solutions for Protein-Bound Amino Acid ¹³C Analysis
| Item | Function in Workflow | Critical Notes |
|---|---|---|
| 6M Hydrochloric Acid (HCl) with 0.1% Phenol | Hydrolyzes peptide bonds in purified protein to release free amino acids. Phenol prevents degradation of tyrosine. | Must be high-purity, prepared under inert atmosphere to minimize oxidation. Use glass hydrolysis vials. |
| MTBSTFA + 1% TBDMCS | Derivatizing agent. Forms tert-butyldimethylsilyl (TBDMS) derivatives of amino acid carboxyl and amine groups, ensuring volatility and specific fragmentation. | Must be anhydrous. Store under nitrogen; moisture causes failed derivatization. |
| Anhydrous Acetonitrile | Solvent for derivatization reaction. | Strict anhydrous conditions are mandatory for reproducible TBDMS formation. |
| ¹³C-Labeled Tracer Substrates | Precursors (e.g., [U-¹³C₆]glucose, [U-¹³C₅]glutamine) fed to biological systems to induce labeling in protein-bound amino acids. | Isotopic purity (>99% ¹³C) is essential for accurate modeling. |
| Unlabeled Amino Acid Standard Mix | For GC-MS method development, establishing retention times, and determining natural abundance MID. | Should match the derivatization protocol used for samples. |
| Isotopic Correction Software (e.g., Isocorrector) | Computationally removes the contribution of naturally occurring isotopes from the raw MID data. | Non-negotiable step. Accuracy depends on correct input of fragment and derivatization agent formulas. |
Applications in Cancer Metabolism, Immunology, and Drug Mechanism of Action Studies
Application Note: GC-MS-Based 13C Flux Analysis in Oncology Research
This application note details the use of Gas Chromatography-Mass Spectrometry (GC-MS) for tracing 13C-labeled isotopes into protein-bound amino acids. This methodology is central to a broader thesis investigating metabolic rewiring in the tumor microenvironment (TME) and its interface with immunometabolism, providing a direct readout of metabolic pathway activities that inform drug mechanisms of action (MoA).
Application in Cancer Metabolism
Stable Isotope-Resolved Metabolomics (SIRM) via GC-MS enables precise mapping of carbon flow through central carbon metabolism, critical for understanding the anabolic demands of proliferating cancer cells.
Key Protocol: Tracing Glycolytic and TCA Cycle Flux in Cancer Cell Lines
- Objective: Quantify the contribution of glucose versus glutamine to the TCA cycle and biosynthetic precursors.
- Reagents: [U-13C6]-Glucose, [U-13C5]-Glutamine, Dulbecco's Modified Eagle Medium (DMEM) lacking glucose/glutamine, phosphate-buffered saline (PBS), trypsin-EDTA, methanol, chloroform, water (HPLC grade), hydrochloric acid (HCl), derivatization agents (e.g., N-methyl-N-(tert-butyldimethylsilyl)trifluoroacetamide, MTBSTFA).
- Procedure:
- Culture target cancer cells (e.g., MDA-MB-231, HCT-116) in standard medium.
- Prior to experiment, wash cells and switch to substrate-specific labeling medium: Group A: Medium with [U-13C6]-Glucose (10 mM) and unlabeled glutamine (4 mM). Group B: Medium with unlabeled glucose (10 mM) and [U-13C5]-Glutamine (4 mM). Include an unlabeled control.
- Incubate for a determined time (e.g., 2, 6, 24 h) to achieve steady-state labeling in protein-bound pools.
- Harvest cells via trypsinization, wash with cold PBS.
- Protein Hydrolysis: Pellet cell samples. Hydrolyze protein pellet with 6M HCl at 110°C for 24h under inert atmosphere.
- Amino Acid Extraction: Dry hydrolysate under nitrogen stream. Reconstitute in water/methanol mixture.
- Derivatization: Mix extract with MTBSTFA + 1% TBDMCS at 70°C for 1h to form TBDMS derivatives.
- GC-MS Analysis: Inject sample onto a non-polar GC column (e.g., DB-5MS) coupled to a quadrupole MS. Use electron impact ionization (EI) and selected ion monitoring (SIM) for relevant mass isotopomers.
- Data Analysis: Calculate Mass Isotopomer Distribution (MID) for key amino acids. For example, alanine (from pyruvate) informs glycolysis; glutamate (from α-ketoglutarate) informs TCA cycle activity; serine and glycine inform one-carbon metabolism.
Table 1: Example 13C Enrichment in Protein-Bound Amino Acids from [U-13C6]-Glucose
| Amino Acid | Precursor Metabolic Pool | M+0 (%) | M+3 (%) | M+6 (%) | Key Interpretation |
|---|---|---|---|---|---|
| Alanine | Pyruvate | 12.5 | 85.4 | 2.1 | High glycolytic flux |
| Glutamate | α-Ketoglutarate | 45.2 | 18.7 | 32.1 | Partial TCA cycle filling from glucose-derived acetyl-CoA |
| Aspartate | Oxaloacetate | 50.1 | 25.3 | 24.6 | Anaplerotic contributions |
| Serine | 3-Phosphoglycerate | 15.8 | 81.0 | 3.2 | Active serine biosynthesis pathway |
Application in Immunology (Immunometabolism)
This approach deciphers the metabolic shifts underlying immune cell activation, differentiation, and function within the TME.
Key Protocol: Assessing Metabolic Competition Between T Cells and Tumor Cells
- Objective: Profile how nutrient consumption by tumor cells impacts the metabolic activity and 13C-labeling patterns of co-cultured T cells.
- Procedure:
- Culture tumor cells in [U-13C6]-glucose medium for 24h to pre-label the microenvironment. Wash.
- Isolate primary human CD8+ T cells and activate with CD3/CD28 beads.
- Set up co-culture systems (Transwell or direct contact) of pre-labeled tumor cells and activated T cells in fresh, unlabeled medium.
- After 6-12h, physically separate cell types using FACS or magnetic beads based on CD45 expression.
- Process T-cell pellet for protein-bound amino acid hydrolysis, derivatization, and GC-MS analysis as in Section 1.
- Data Interpretation: Reduced 13C enrichment in T-cell alanine and glutamate versus T cells alone indicates tumor-mediated glucose depletion. Enrichment patterns in T-cell aspartate can reveal compensatory metabolism.
Application in Drug Mechanism of Action Studies
GC-MS 13C tracing provides a functional readout of metabolic pathway inhibition or activation by therapeutics.
Key Protocol: Elucidating the MoA of a Novel Glutaminase Inhibitor
- Objective: Determine the metabolic consequences of glutaminase (GLS) inhibition on glutamine utilization.
- Procedure:
- Treat cancer cells with a GLS inhibitor (e.g., CB-839) or vehicle (DMSO) for 6 hours.
- Switch both groups to medium containing [U-13C5]-Glutamine as the sole labeled source.
- Incubate for an additional 2-4 hours.
- Harvest cells and analyze protein-bound amino acid 13C patterns as per standard protocol.
- Data Interpretation: Effective GLS inhibition will manifest as a dramatic decrease in M+5 and M+4 labeling in glutamate and subsequent TCA-derived amino acids (aspartate, proline), confirming on-target engagement and metabolic reprogramming.
Table 2: Impact of GLS Inhibitor on 13C-Glutamine-Dependent Labeling
| Condition | Glutamate M+5 (%) | Aspartate M+4 (%) | Citrulline M+5 (%) | Interpretation |
|---|---|---|---|---|
| DMSO Control | 68.3 | 45.6 | 15.2 | Active glutaminolysis |
| GLS Inhibitor (1μM) | 5.1 | 8.9 | 1.3 | Severe blockade of glutamine entry into TCA |
The Scientist's Toolkit: Research Reagent Solutions
| Item | Function in GC-MS 13C Tracing |
|---|---|
| [U-13C6]-Glucose | Tracer for mapping glycolytic flux, pentose phosphate pathway, and glucose-derived TCA cycle entry via acetyl-CoA. |
| [U-13C5]-Glutamine | Tracer for assessing glutaminolysis, anaplerosis, and biosynthesis of nucleotides & glutathione. |
| Dialyzed Fetal Bovine Serum (FBS) | Essential for labeling studies; removes confounding unlabeled metabolites from serum. |
| Custom Labeling Media | Culture media formulated without specific nutrients (e.g., glucose, glutamine) to allow controlled tracer introduction. |
| MTBSTFA Derivatization Reagent | Silylating agent for GC-MS; reacts with amino acid carboxyl and amine groups to form volatile, thermally stable TBDMS derivatives. |
| Hydrochloric Acid (6M), Sealed Vials | For complete, non-oxidative hydrolysis of proteins into constituent amino acids. |
| DB-5MS GC Column | Standard low-polarity stationary phase for high-resolution separation of amino acid derivatives. |
| Standard Amino Acid Mix (Unlabeled & 13C-labeled) | Critical for calibrating GC retention times and MS response factors, and for quantifying isotopic enrichment. |
Visualizations
Title: Core 13C-Tracing Pathways in Cancer Metabolism
Title: Tumor-T Cell Metabolic Competition in the TME
Title: GC-MS Workflow for Protein-Bound Amino Acid 13C Analysis
Step-by-Step Protocol: From Cell Culture to GC-MS Data Acquisition
This application note is framed within a broader thesis investigating central carbon metabolism in cancer cell lines via GC-MS detection of 13C-labeling patterns in protein-bound amino acids. The choice of tracer is the single most critical experimental parameter, as it determines which metabolic pathways can be interrogated and the resolution of flux information. Protein-bound amino acids provide a time-integrated snapshot of metabolic activity, mitigating the influence of rapid pool turnover.
Tracer Selection: Principles and Quantitative Comparison
The selection of a 13C tracer depends on the metabolic pathways of interest. Key considerations include the entry point into metabolism and the resulting labeling patterns in downstream metabolites and, ultimately, proteinogenic amino acids.
Table 1: Comparison of Common 13C Tracers for Protein-Bound Amino Acid Analysis
| Tracer | Primary Metabolic Entry Point | Ideal for Probing | Key Labeling Pattern in Protein-Bound Amino Acids (via GC-MS) | Relative Cost (Approx.) |
|---|---|---|---|---|
| [U-13C]-Glucose | Glycolysis, Pentose Phosphate Pathway (PPP) | Glycolytic flux, TCA cycle activity, anaplerosis, pyruvate entry. | M+0 to M+3 patterns in Ala, Ser, Gly; M+0 to M+6 patterns in Asp, Glu, Pro; Ribose moiety in His/Phe/Tyr. | $$$$ |
| [1,2-13C]-Glucose | Glycolysis | PDH vs. PC activity, TCA cycle topology. | M+2 labeling in acetyl-CoA leads to specific M+1, M+2 patterns in TCA-derived amino acids (e.g., Glu M+1, M+2). | $$$ |
| [U-13C]-Glutamine | TCA cycle (via α-KG) | Glutaminolysis, reductive carboxylation, nitrogen metabolism. | M+5 patterns in Glu, Gln, Pro, Asp; M+4 in citrate from reductive pathway. | $$$$ |
| [1,2-13C]-Glutamine | TCA cycle (via α-KG) | Citrate synthase vs. reductive carboxylation flux. | M+2 patterns in Glu, Asp; distinguishes forward/reverse TCA flux. | $$ |
| [3-13C]-Lactate | TCA cycle (via PDH) | Mitochondrial pyruvate metabolism, Cori cycle. | M+1 labeling in Ala; M+2 in acetyl-CoA leads to specific patterns in TCA-derived amino acids. | $ |
Detailed Protocols
Protocol 1: Cell Culture Tracer Experiment with [U-13C]-Glucose
Objective: To determine glycolytic and TCA cycle flux contributions to the proteinogenic amino acid pool.
Materials (Research Reagent Solutions Toolkit):
Table 2: Essential Reagents and Materials
| Item | Function |
|---|---|
| [U-13C]-Glucose (99% atom purity) | Tracer substrate for labeling metabolic networks. |
| Glucose- and Glutamine-free DMEM | Base medium for precise tracer control. |
| Dialyzed Fetal Bovine Serum (dFBS) | Removes small molecules (e.g., unlabeled glucose) that would dilute tracer. |
| Phosphate-Buffered Saline (PBS), ice-cold | For halting metabolism and washing cells. |
| 6M Hydrochloric Acid (HCl) | For protein hydrolysis. |
| Derivatization Reagent (e.g., MTBSTFA + 1% TBDMCS) | Converts amino acids to volatile tert-butyldimethylsilyl (TBDMS) derivatives for GC-MS. |
| Methanol:PBS (8:2 v/v) Quench Solution | Rapidly cools cells and extracts intracellular metabolites for parallel metabolomics. |
Procedure:
- Culture & Depletion: Grow cells in standard medium to 70% confluency. Wash twice with PBS and incubate in tracer medium (DMEM + 10% dFBS + 2 mM [U-13C]-Glucose + 2 mM unlabeled Gln) for a defined period (e.g., 24-72 hrs for protein-bound analysis).
- Harvesting: Wash cells 3x with ice-cold PBS. Scrape into 1 mL PBS, transfer to a microtube, and pellet (500 x g, 5 min, 4°C).
- Protein Hydrolysis: Lyse pellet in 0.5 mL 6M HCl. Hydrolyze at 105°C for 24 hrs under nitrogen/argon atmosphere.
- Sample Cleanup: Cool, dry hydrolysate under nitrogen stream. Reconstitute in 0.5 mL deionized water.
- Derivatization: Mix 50 µL sample with 50 µL pyridine and 100 µL MTBSTFA. Incubate at 70°C for 1 hr.
- GC-MS Analysis: Inject 1 µL into GC-MS system (e.g., DB-35MS column). Use electron impact ionization and selected ion monitoring (SIM) for mass isotopomer distributions (MIDs) of TBDMS-amino acids.
Protocol 2: Targeted Analysis of Reductive Carboxylation with [U-13C]-Glutamine
Objective: To quantify the contribution of reductive carboxylation of α-KG to citrate and acetyl-CoA pools.
Procedure:
- Culture: Seed cells and switch to tracer medium (DMEM + 10% dFBS + 25 mM unlabeled Glucose + 2 mM [U-13C]-Glutamine) at ~80% confluency. Incubate 6-24 hrs.
- Harvest & Extract: Rapidly wash with 5 mL ice-cold 0.9% NaCl. Quench with 2 mL -20°C Methanol:PBS (8:2). Scrape and transfer. Add 2 mL -20°C chloroform and vortex. Centrifuge (10,000 x g, 15 min, 4°C).
- Phase Separation: The upper aqueous phase contains amino acids and organic acids. Dry under nitrogen.
- Protein Pellet: The interphase protein pellet can be washed and hydrolyzed per Protocol 1 for protein-bound amino acid analysis.
- Derivatization & Analysis: Derivatize aqueous extract as in Step 5 of Protocol 1. Analyze citrate and malate MIDs (from extract) and protein-bound Asp/Glu MIDs (from pellet) by GC-MS.
Visualized Pathways and Workflows
Title: Tracer Selection Decision Logic Tree
Title: [U-13C]-Glucose Experimental Workflow
Title: Glutamine Metabolic Pathways & Labeling Outcomes
Application Notes
Within the context of GC-MS research for analyzing ¹³C isotopic patterns in protein-bound amino acids, the selection of hydrolysis method is critical. Acid hydrolysis, while robust, can degrade or modify certain amino acids (e.g., tryptophan, cysteine, asparagine, glutamine), potentially skewing isotopic enrichment data. Enzymatic hydrolysis is gentler and preserves these labile residues but may be incomplete for some proteins, leading to underestimation of amino acid abundance. The choice directly impacts the accuracy of ¹³C flux studies in metabolic pathways, a core focus in drug development research targeting metabolic disorders or cancer.
Quantitative Comparison of Hydrolysis Methods
Table 1: Performance Characteristics of Acid vs. Enzymatic Hydrolysis for GC-MS AA Analysis
| Parameter | Acid Hydrolysis (6M HCl, 110°C) | Enzymatic Hydrolysis (e.g., Pronase, Pepsin, etc.) |
|---|---|---|
| Typical Duration | 18-24 hours | 24-72 hours |
| Temperature | 100-110°C | 37-50°C |
| Completeness | >98% for most AAs | 85-95% (varies by protein) |
| Labile AA Recovery | Tryptophan destroyed, Ser/Thr partially degraded, Asn/Gln deamidated | Full recovery of all standard AAs |
| Risk of Racinization | High | Minimal |
| Downstream GC-MS Prep | Requires derivatization post-hydrolysis; may need cleanup for acid. | Requires enzyme inactivation/removal before derivatization. |
| Best For | Robust proteins, non-labile AAs, high-throughput. | Delicate AAs, isotope studies where preservation of all species is vital. |
Table 2: Recovered Yield of Key Amino Acids for ¹³C Analysis (% of Theoretical)
| Amino Acid | Acid Hydrolysis | Enzymatic Hydrolysis |
|---|---|---|
| Alanine | 99% | 97% |
| Leucine | 99% | 96% |
| Glutamic Acid | 98%* | 99% |
| Aspartic Acid | 97* | 99% |
| Serine | 90% | 98% |
| Threonine | 95% | 98% |
| Tryptophan | <5% | 95% |
| Methionine | 95% | 98% |
| *Represents Glutamate + Glutamine; With phenol addition to prevent oxidation. |
Experimental Protocols
Protocol 1: Cell/Tissue Harvesting for Protein-Bound AA Analysis
Objective: To harvest biological material while halting metabolism and preserving proteins for subsequent hydrolysis. Materials: PBS (ice-cold), Lysis Buffer (e.g., RIPA with protease inhibitors), Centrifuge, Liquid N₂. Procedure:
- Rapid Quenching: For cell cultures, rapidly aspirate medium and wash twice with ice-cold PBS. For tissues, snap-freeze in liquid N₂ immediately upon excision.
- Homogenization: Lyse cells/tissue in ice-cold lysis buffer using a sonicator or mechanical homogenizer.
- Protein Precipitation: Add ice-cold acetone (80% final concentration) to the lysate. Incubate at -20°C for 2 hours to precipitate proteins.
- Pellet Collection: Centrifuge at 16,000 × g for 20 min at 4°C. Discard supernatant.
- Washing: Wash the protein pellet twice with 80% ice-cold acetone/water (v/v) to remove free amino acids and contaminants.
- Drying: Air-dry the purified protein pellet under a gentle stream of N₂ gas. Store at -80°C until hydrolysis.
Protocol 2: Acid Hydrolysis for GC-MS Sample Preparation
Objective: To completely hydrolyze purified protein pellets into constituent amino acids using hydrochloric acid. Materials: 6M HCl (Sequanal Grade), 1% Phenol (w/v in HCl), Hydrolysis tubes, Vacuum desiccator, Heating block. Procedure:
- Preparation: Re-suspend 0.1-1 mg of dried protein pellet in 200-500 µL of 6M HCl containing 1% phenol.
- Degassing: Freeze the sample in a dry ice/ethanol bath. Evacuate the tube using a vacuum pump and flame-seal or use a nitrogen-flushed, screw-cap vial.
- Hydrolysis: Incubate at 110°C for 18-24 hours.
- Cooling & Drying: Cool to room temperature. Open tube and dry the hydrolysate completely in a vacuum desiccator over NaOH pellets to remove residual HCl.
- Reconstitution: Re-suspend dried amino acids in a suitable solvent (e.g., 20 mM HCl or derivatization reagent) for subsequent GC-MS derivatization.
Protocol 3: Enzymatic Hydrolysis for GC-MS Sample Preparation
Objective: To gently hydrolyze proteins while preserving labile amino acids for accurate ¹³C isotopic analysis. Materials: Pronase (from Streptomyces griseus), Pepsin, Aminopeptidase M, Leucine Aminopeptidase, 0.1M Ammonium Acetate buffer (pH 7.5), 0.1M Sodium Acetate buffer (pH 4.5), 0.22 µm Filter. Procedure:
- Denaturation (Optional): For insoluble proteins, denature in 8M Urea, then dialyze into digestion buffer.
- Primary Digestion: Dissolve 0.1-1 mg protein in 500 µL of 0.1M Ammonium Acetate, pH 7.5. Add Pronase at 1:50 (enzyme:substrate ratio). Incubate at 37°C for 24 hours.
- Secondary Digestion: Adjust pH to ~4.5 with dilute acetic acid. Add Pepsin (1:100 ratio). Incubate at 37°C for 24 hours.
- Terminal Digestion: Re-adjust pH to 7.5. Add Aminopeptidase M & Leucine Aminopeptidase (1:100 each). Incubate at 37°C for an additional 24 hours.
- Enzyme Inactivation: Heat sample at 95°C for 5 min.
- Cleanup: Centrifuge and filter through a 0.22 µm filter to remove precipitated enzymes. Lyophilize the filtrate containing free AAs.
Diagrams
Title: Workflow for Protein Hydrolysis Prior to GC-MS
Title: Method Selection Logic for 13C Research
The Scientist's Toolkit: Research Reagent Solutions
Table 3: Essential Materials for Protein Harvesting and Hydrolysis
| Item | Function & Relevance to ¹³C AA Research |
|---|---|
| Sequanal Grade 6M HCl | Highest purity acid minimizes contaminants that interfere with sensitive GC-MS detection of isotopic ratios. |
| Phenol (Molecular Biology Grade) | Added to acid hydrolysis to protect oxidation-prone amino acids (Tyr, Met) from degradation, preserving signal. |
| Pronase (from S. griseus) | Broad-specificity protease cocktail for initiating enzymatic hydrolysis; ensures breakdown of diverse protein types. |
| Aminopeptidase M | Exopeptidase that completes hydrolysis by releasing terminal amino acids, crucial for quantitative yield. |
| Deuterated Internal Standards (e.g., D₅-Phenylalanine) | Added pre-hydrolysis to correct for losses during sample processing; essential for precise GC-MS quantitation of ¹³C enrichment. |
| MTBSTFA Derivatization Reagent | Common silylation agent for GC-MS; converts amino acids to volatile tert-butyldimethylsilyl derivatives for separation and detection. |
| Inert Atmosphere Vials/Sealers | For acid hydrolysis; prevents oxidative degradation during high-temperature incubation, protecting AA integrity. |
| Ultra-Pure Water (LC-MS Grade) | Used in all buffers and reconstitution steps to prevent background contamination in mass spectrometry. |
| Centrifugal Vacuum Concentrator | For gentle, complete removal of hydrolysis acids or solvents without heating that could degrade samples. |
In the context of a thesis investigating ¹³C isotopic patterns in protein-bound amino acids via GC-MS, derivatization is a critical step. It converts polar, non-volatile amino acids into volatile, thermally stable derivatives suitable for gas chromatography. The choice of derivatizing reagent directly impacts the analytical outcome, influencing volatility, mass spectral fragmentation, sensitivity, and crucially, the preservation of the original ¹³C isotopic signature at each carbon position. Artifacts or side reactions that scramble or add carbon atoms must be avoided to ensure accurate isotopic enrichment data from tracer studies (e.g., ¹³C-glucose infusions).
Key Derivatizing Reagents: Mechanisms and Comparative Data
The two predominant silylation reagents for amino acid analysis are MSTFA and MTBSTFA. Their properties and applications are summarized below.
Table 1: Comparison of Key Silylation Reagents for Amino Acid Analysis
| Reagent | Full Name | Mechanism | Key Derivatives Formed | Advantages in ¹³C Research | Disadvantages |
|---|---|---|---|---|---|
| MSTFA | N-Methyl-N-(trimethylsilyl)trifluoroacetamide | Trimethylsilylation (-OTMS) of -COOH, -NH₂, -OH, -SH. | TMS esters (COOH) and TMS amines (NH₂). | Fast reaction, high volatility, excellent for complex mixtures. | Derivatives can be moisture-sensitive. Potential for multiple derivatives (e.g., N,O,S-TMS). |
| MTBSTFA | N-Methyl-N-(tert-butyldimethylsilyl)trifluoroacetamide | tert-Butyldimethylsilylation (-OTBDMS). | TBDMS esters (COOH) and TBDMS amines (NH₂). | Highly stable derivatives, resistant to hydrolysis. Produces characteristic [M-57]⁺ fragment (loss of tert-butyl), simplifying spectra. | Bulkier group may reduce volatility for very large molecules. Longer reaction times/temperatures often needed. |
| BSTFA | N,O-Bis(trimethylsilyl)trifluoroacetamide | Trimethylsilylation, similar to MSTFA. | Same as MSTFA. | Common, effective silyl donor. Often used with TMCS catalyst. | Slightly less reactive than MSTFA. |
| MBTSTFA | N-Methyl-N-(bis-tert-butyldimethylsilyl)trifluoroacetamide | Provides two TBDMS groups. | Di-TBDMS derivatives for amino acids. | Enhanced stability for difficult-to-derivatize functional groups. | Highest molecular weight, most expensive. |
For ¹³C isotopic research, MTBSTFA is often favored because the TBDMS group does not contain additional carbon atoms that could be exchanged or confused with the analyte's native carbons during fragmentation, and its clean fragmentation pattern aids in ion selection for isotopic ratio measurements.
Application Notes & Protocols
General Workflow for Protein-Bound Amino Acid ¹³C Analysis:
- Protein Hydrolysis: 6M HCl, 110°C, 24h under N₂ atmosphere.
- Hydrolysate Drying: Lyophilization or centrifugal evaporation.
- Derivatization: (See protocols below).
- GC-MS Analysis: Using a polar capillary column (e.g., DB-35ms) and monitoring both molecular/pseudomolecular ions and key fragments for ¹³C enrichment calculation.
Protocol A: Derivatization with MSTFA (for rapid profiling)
- Materials: Dry amino acid residue, MSTFA, pyridine (anhydrous), alkane standard mix (retention index calibration).
- Procedure:
- Redissolve dried hydrolysate in 20 µL of pyridine.
- Add 30 µL of MSTFA. Vortex vigorously for 30 seconds.
- Incubate at 70°C for 30 minutes.
- Cool to room temperature and transfer directly to a GC vial insert for analysis.
- GC-MS Notes: Monitor ions like M⁺, [M-15]⁺ (loss of CH₃), and specific fragment ions for each amino acid.
Protocol B: Derivatization with MTBSTFA (for stable, isotopic-focused analysis)
- Materials: Dry amino acid residue, MTBSTFA, 1% tert-butyldimethylchlorosilane (TBDMCS) in pyridine (v/v) as catalyst.
- Procedure:
- Redissolve dried hydrolysate in 50 µL of the pyridine/TBDMCS catalyst mixture.
- Add 50 µL of MTBSTFA. Vortex vigorously for 1 minute.
- Incubate at 70°C for 60-90 minutes.
- Cool and analyze immediately. Stable for ~24-48h if kept dry.
- GC-MS Notes: Characteristic [M-57]⁺ ion is dominant for most TBDMS-amino acids. Select this ion or other high-mass fragments for isotopic ratio calculation to maximize precision.
Diagram: Derivatization & Analysis Workflow for ¹³C-AA
Title: Workflow for ¹³C Analysis of Protein-Bound Amino Acids
The Scientist's Toolkit: Essential Reagents & Materials
Table 2: Research Reagent Solutions for Derivatization & Analysis
| Item | Function/Description | Critical Note for ¹³C Work |
|---|---|---|
| 6M Hydrochloric Acid (HCl) | Hydrolyzes peptide bonds to release free amino acids. | Must be high-purity; trace organics can contaminate. Use under inert atmosphere (N₂) to prevent oxidation. |
| MSTFA (≥98.5% purity) | Primary trimethylsilyl donor for rapid derivatization. | Ensure anhydrous conditions. Store under argon. May contain traces of ammonium salts which can form artifacts. |
| MTBSTFA (≥95% purity) | Primary tert-butyldimethylsilyl donor for stable derivatives. | Preferred for isotopic studies. Use with TBDMCS catalyst for complete reaction with amines. |
| Anhydrous Pyridine | Solvent and basic catalyst for silylation reactions. | Must be rigorously anhydrous (molecular sieves). Acidity quencher. |
| TBDMCS (tert-Butyldimethylchlorosilane) | Catalyst for MTBSTFA reactions, enhances silylation of stubborn groups. | Typically used as 1% (v/v) in pyridine. Highly moisture-sensitive. |
| TMCS (Trimethylchlorosilane) | Catalyst for MSTFA/BSTFA reactions. | Similar use to TBDMCS but for TMS chemistry. |
| Alkane Standard Mix (C8-C30) | For determination of Kovats Retention Index (RI). | Essential for compound identification across different GC methods and columns. |
| Derivatization Vials & Septa | Reaction vessels for heating. | Must be inert, heat-resistant glass with PTFE-lined septa to maintain anhydrous conditions. |
| Polar GC Column (e.g., DB-35ms) | Stationary phase for chromatographic separation. | Mid-polarity (35% phenyl) offers excellent separation of amino acid derivatives. |
GC-MS Instrument Parameters and Method Optimization for Amino Acid Separation
This protocol is developed within the framework of a doctoral thesis investigating ¹³C isotopic patterns in protein-bound amino acids (AAs) to elucidate metabolic pathways in cancer cell lines. Precise GC-MS separation and detection of proteinogenic AAs are critical for obtaining accurate ¹³C/¹²C enrichment data, which serves as a tracer for metabolic flux analysis. This document details the optimized instrument parameters and derivatization protocols essential for high-resolution AA analysis.
Key Research Reagent Solutions
| Item | Function in Analysis |
|---|---|
| MTBSTFA + 1% TBDMCS | Silylation reagent. Derivatizes -COOH and -NH₂ groups to form volatile tert-butyldimethylsilyl (TBDMS) derivatives, enhancing thermal stability and chromatographic separation. |
| HCl (6M, Constant Boiling) | Acid for protein hydrolysis. Cleaves peptide bonds to release individual, protein-bound amino acids under inert atmosphere to prevent oxidative degradation. |
| Methanol:HCl (3N) | Esterification agent. Converts free amino acids to their methyl esters prior to silylation, a two-step process that improves derivative stability for certain AAs (e.g., Arg, His). |
| Pyridine (Anhydrous) | Reaction solvent for derivatization. Provides a basic, anhydrous environment crucial for efficient silylation. |
| Norvaline (Internal Standard) | A non-proteinogenic amino acid added at a known concentration prior to hydrolysis/derviatization to correct for sample loss and injection variability. |
| C7-C30 Saturated Alkane Mix | Used for determination of Kovats Retention Index (RI) for each AA derivative, enabling reliable identification across different GC columns and conditions. |
Optimized GC-MS Instrument Parameters
Table 1: Gas Chromatography Parameters
| Parameter | Setting | Purpose/Rationale |
|---|---|---|
| GC System | Agilent 8890/5977B MSD | Standard platform for high-sensitivity analysis. |
| Injection | Pulsed Splitless, 15 psi until 0.5 min | Ensures narrow band of sample enters column. |
| Injection Volume | 1 µL | Optimized for sensitivity and column load. |
| Inlet Temperature | 250°C | Volatilizes TBDMS-AA derivatives. |
| Carrier Gas | Helium, Constant Flow | Flow set at 1.2 mL/min. |
| Column | Agilent DB-35ms (or equivalent) | Low-bleed, mid-polarity column (35% phenyl). |
| Dimensions | 30 m × 0.25 mm × 0.25 µm | Standard for complex metabolite separation. |
| Oven Program | Initial: 80°C hold 2 min | Allows solvent focusing. |
| Ramp 1: 6°C/min to 210°C | Gradual separation of early eluting AAs. | |
| Ramp 2: 10°C/min to 320°C, hold 5 min | Elutes later, less volatile derivatives. |
Table 2: Mass Spectrometry Parameters
| Parameter | Setting | Purpose/Rationale |
|---|---|---|
| Transfer Line Temp. | 280°C | Prevents condensation of high-boiling derivatives. |
| Ion Source Temp. | 230°C | Standard for electron impact (EI) ionization. |
| Quadrupole Temp. | 150°C | |
| Ionization Mode | Electron Impact (EI) | 70 eV for reproducible, library-matchable spectra. |
| Acquisition Mode | Scan / Selected Ion Monitoring (SIM) | Scan: m/z 50-650 for identification/RI. SIM: For highest sensitivity in isotopic enrichment studies. |
| Solvent Delay | 6.5 minutes | Protects filament from derivatization reagents. |
| Tuning | Perfluorotributylamine (PFTBA) | Daily autotune ensures optimal sensitivity and mass accuracy. |
Experimental Protocols
Protocol 1: Protein Hydrolysis and Amino Acid Extraction
- Weigh 0.5-1.0 mg of purified protein or cell pellet into a 4 mL hydrolysis vial.
- Add 50 µL of a 250 µM Norvaline solution as an internal standard.
- Dry completely under a gentle stream of N₂.
- Add 1 mL of 6M constant boiling HCl. Briefly vortex.
- Freeze the sample in a dry ice/ethanol bath.
- Evacuate the vial to < 50 mTorr and flush with N₂. Repeat evacuation/flush cycle 3 times.
- Seal the vial under vacuum and place in a 110°C oven for 18-24 hours.
- Cool to room temperature, open vial, and dry the hydrolysate completely under N₂ at 60°C.
- Reconstitute the dried amino acids in 100 µL of 20 mM HCl, vortex, and centrifuge. Transfer supernatant to a clean GC-MS vial insert.
Protocol 2: Two-Step Derivatization (Methyl Esterification + Silylation) Note: This method is optimal for challenging AAs like arginine and histidine.
- Transfer 50 µL of the reconstituted hydrolysate to a clean 2 mL derivatization vial. Dry under N₂.
- Esterification: Add 100 µL of 3N Methanol:HCl. Cap tightly, vortex, and heat at 75°C for 60 min.
- Cool to room temperature and dry completely under a stream of N₂.
- Silylation: Add 50 µL of anhydrous pyridine and 50 µL of MTBSTFA + 1% TBDMCS.
- Cap tightly, vortex vigorously for 30 seconds.
- Heat at 70°C for 60 minutes. Vortex midway.
- Cool and transfer derivative to a GC-MS vial. Analyze within 24 hours for best results.
Data Presentation: Representative Quantitative Metrics
Table 3: Characteristic Ions and Retention Data for TBDMS-Amino Acids
| Amino Acid | Primary Quantifier Ion (m/z) | Qualifier Ions (m/z) | Approx. Retention Time (min) | Kovats RI (on DB-35ms) |
|---|---|---|---|---|
| Alanine | 260 | 232, 116 | 9.2 | 1185 |
| Valine | 288 | 186, 218 | 11.8 | 1280 |
| Leucine | 302 | 200, 232 | 13.5 | 1365 |
| Proline | 286 | 184, 142 | 14.1 | 1390 |
| Glutamate | 432 | 246, 348 | 18.5 | 1620 |
| Phenylalanine | 336 | 234, 192 | 20.8 | 1755 |
| Norvaline (IS) | 288 | 186, 218 | 12.5 | 1310 |
Visualization
Title: Sample Prep and Analysis Workflow
Title: Key Parameters for Method Optimization
This protocol is framed within a broader thesis investigating metabolic flux in biological systems through the precise measurement of ¹³C labeling patterns in protein-bound amino acids. Stable Isotope-Resolved Metabolomics (SIRM) using Gas Chromatography-Mass Spectrometry (GC-MS) is a cornerstone technique for this research, enabling the quantification of Mass Isotopomer Distributions (MIDs). Accurate MID data are critical for drug development professionals and researchers modeling metabolic pathways, as they reveal the activity and rewiring of central carbon metabolism in response to disease, genetic modification, or therapeutic intervention.
Key Principles of MID Acquisition via GC-MS
The MID for a given metabolite fragment is the relative abundance of its various mass isotopologues (M0, M+1, M+2,... M+n), where 'n' is the number of carbon atoms in the fragment. GC-MS electron impact ionization produces characteristic fragments from derivatized amino acids. The MID is acquired by scanning across a defined range of mass-to-charge ratios (m/z) corresponding to these isotopologues. Corrections for natural abundance of ¹³C, ²H, ¹⁵N, ¹⁸O, ²⁹Si, and ³⁰Si (from derivatization agents) are essential and are performed post-acquisition using dedicated software algorithms.
Experimental Protocol: GC-MS Analysis of Protein-Bound Amino Acids
Sample Preparation (Hydrolysis & Derivatization)
- Protein Hydrolysis: Transfer ~20 µg of purified protein or ~1 mg of cell pellet into a glass hydrolysis vial. Add 200 µL of 6M HCl. Seal under vacuum or nitrogen atmosphere. Hydrolyze at 110°C for 24 hours. Dry the hydrolysate completely using a vacuum centrifuge.
- Amino Acid Derivatization (MTBSTFA method):
- Reduction: Reconstitute dried hydrolysate in 50 µL of dimethylformamide (DMF).
- Esterification: Add 50 µL of tert-butyldimethylsilyl (TBDMS) derivatization reagent (e.g., MTBSTFA with 1% tert-butyldimethylchlorosilane) to each vial.
- Reaction: Incubate at 70°C for 60 minutes.
- Transfer: Cool to room temperature and transfer the derivatized sample to a GC-MS vial with insert.
GC-MS Instrument Configuration & Data Acquisition
- GC Parameters:
- Column: Agilent HP-5ms (30 m × 0.25 mm ID, 0.25 µm film thickness).
- Inlet: Splitless mode at 250°C.
- Carrier Gas: Helium, constant flow at 1.2 mL/min.
- Oven Program: 80°C (hold 2 min), ramp at 5°C/min to 300°C (hold 5 min). Total run time: 49 min.
- MS Parameters for MID Scanning:
- Ion Source: Electron Impact (EI) at 70 eV, temperature 230°C.
- Quadrupole: Temperature 150°C.
- Acquisition Mode: Selected Ion Monitoring (SIM). Do not use scan mode for quantitative MID work.
- SIM Setup: For each target amino acid, define a SIM group containing the m/z values for the [M-57]⁺ fragment (loss of tert-butyl group) and its isotopologues. Dwell time per ion: ≥ 50 ms for statistical reliability.
- Example SIM Ions for Alanine (derivatized, 3 carbons in fragment): m/z 260 (M0), 261 (M+1), 262 (M+2), 263 (M+3).
Data Processing & MID Calculation Workflow
- Peak Integration: Use instrument software (e.g., Agilent MassHunter) to integrate the chromatographic peak area for each monitored ion.
- Background Subtraction: Subtract the average background signal from each integrated ion peak area.
- Natural Abundance Correction: Input the corrected peak areas into dedicated software (e.g., IsoCor, MIDmax, or Metabolomics Isotope Tool (MIT)). The software corrects the observed MIDs using matrix-based algorithms that account for the natural isotope distribution of all non-carbon atoms in the fragment.
- Output: The final corrected MID is expressed as a molar fraction vector, where the sum of all fractions (M0 to M+n) equals 1.
Data Presentation: Representative MID Data
Table 1: Corrected Mass Isotopomer Distributions (Molar Fractions) for Key Proteinogenic Amino Acids from a ¹³C-Glucose Tracing Experiment in Cultured Cells.
| Amino Acid (Fragment) | M0 | M+1 | M+2 | M+3 | M+4 | M+5 | M+6 |
|---|---|---|---|---|---|---|---|
| Alanine (3C) | 0.215 | 0.478 | 0.267 | 0.040 | - | - | - |
| Glutamate (5C) | 0.158 | 0.302 | 0.285 | 0.185 | 0.065 | 0.005 | - |
| Aspartate (4C) | 0.189 | 0.401 | 0.320 | 0.090 | 0.001 | - | - |
| Glycine (2C) | 0.550 | 0.400 | 0.050 | - | - | - | - |
Note: Data is simulated for illustrative purposes. MIDs reflect label incorporation from [U-¹³C₆]glucose after 6 hours of incubation.
Table 2: Essential GC-MS Parameters for Reproducible MID Acquisition.
| Parameter | Recommended Setting | Function/Rationale |
|---|---|---|
| Quadrupole Dwell Time | ≥ 50 ms per ion | Ensures sufficient data points across chromatographic peak for accurate integration. |
| SIM Groups | Max 10-15 ions per group | Maintains cycle time to adequately sample the chromatographic peak shape. |
| Ion Source Temp | 230°C | Standard for EI, ensures consistent fragmentation and ionization efficiency. |
| Detector Gain | Use default or autotune | Optimizes signal-to-noise ratio without saturation. |
Visualization of Workflows
Workflow for GC-MS MID Analysis
MID Natural Abundance Correction Process
The Scientist's Toolkit: Research Reagent Solutions
Table 3: Essential Materials for GC-MS Based MID Analysis of Protein-Bound Amino Acids.
| Item/Category | Specific Example & Vendor | Function in Protocol |
|---|---|---|
| Derivatization Reagent | N-Methyl-N-(tert-butyldimethylsilyl)trifluoroacetamide (MTBSTFA) with 1% tBDMCS (e.g., Pierce, Regis) | Adds the tert-butyldimethylsilyl (TBDMS) group to amino acids, making them volatile and providing characteristic fragments for MID analysis. |
| Hydrolysis Acid | 6 M Hydrochloric Acid (HCl), TraceMetal Grade (e.g., Fisher Scientific) | Cleaves peptide bonds to release free amino acids from purified protein or cellular pellets. High purity minimizes contamination. |
| Internal Standard | U-¹³C,¹⁵N Algal Amino Acid Mix (e.g., Cambridge Isotope Laboratories, CLM-1547) | Added pre-hydrolysis to correct for losses during sample preparation and variability in derivatization efficiency. |
| GC Column | Agilent HP-5ms UI (30m x 0.25mm, 0.25µm) | Standard low-polarity column for separating a wide range of TBDMS-amino acid derivatives. |
| Natural Abundance Correction Software | IsoCor (Open Source) or MIDmax (Commercial) | Performs the essential mathematical correction for the contribution of natural heavy isotopes to the observed MID. |
| Stable Isotope Tracer | [U-¹³C₆]-D-Glucose (e.g., Cambridge Isotope Laboratories, CLM-1396) | The metabolic precursor used in tracing experiments to label amino acids via central carbon metabolism. |
| Deuterated Lock Mass | Tris(perfluorobutyl)amine (e.g., Restek) | Provides constant reference ions in the mass spectrometer for accurate mass calibration during acquisition. |
Solving Common GC-MS Challenges in 13C-Amino Acid Analysis
Avoiding Isotopic Dilution and Contamination During Sample Processing.
Application Notes and Protocols
Within a thesis investigating GC-MS detection of ¹³C patterns in protein-bound amino acids, maintaining isotopic integrity is paramount. Contamination or isotopic dilution compromises the accuracy of ¹³C-enrichment measurements, leading to erroneous metabolic flux data. This document details protocols to safeguard sample purity from extraction to derivatization.
1. Quantitative Risks of Contamination & Dilution The following table quantifies common sources of interference and their impact on isotopic measurements.
| Contamination/Dilution Source | Typical Contribution | Impact on δ¹³C or %Enrichment | Mitigation Protocol Section |
|---|---|---|---|
| Laboratory Airborne CO₂ | ~400 ppm CO₂, δ¹³C ≈ -8‰ | Can shift δ¹³C of carbonate steps | 2.1, 3.2 |
| Fingerprint Lipids | Variable C18+ chains, δ¹³C ~ -25‰ | Major dilution in AA peaks | 2.2, 2.3 |
| Plasticizer Leaching (e.g., Pthalates) | µg per g sample | Co-elution, baseline noise | 2.2, 3.1 |
| Incomplete Acid Hydrolysis | <95% protein-bound AA release | Skews AA pattern, not isotopic ratio | 3.3 |
| Incomplete Derivatization | Variable methyl/ester yield | Alters MS fragmentation pattern | 3.4 |
| Glassware Residues | ng-level organics | Broad chromatographic interference | 2.3 |
2. Pre-Analytical Sample Handling Protocols
Protocol 2.1: Lipid & Contaminant Removal from Protein Pellet Objective: Isolate pure protein while excluding exogenous carbon. Materials: Chloroform (Optima grade), Methanol (Optima grade), Deionized water (18.2 MΩ·cm), Glass homogenizer, PTFE-lined centrifuge tubes.
- Homogenize tissue/cells in 2:1 chloroform:methanol (v/v) using glass.
- Centrifuge at 10,000 × g for 10 min at 4°C. Discard supernatant (lipid fraction).
- Wash pellet with 1 mL 70% ethanol, vortex, centrifuge, discard supernatant.
- Repeat wash with 1 mL methanol. Dry pellet under a stream of N₂ gas (not air).
Protocol 2.2: Solvent and Labware Purity Verification Objective: Ensure reagents do not contribute background carbon. Materials: High-purity solvents, combusted glassware (see 2.3), GC-MS.
- Evaporate 100 µL of each solvent lot (hexane, dichloromethane, etc.) under N₂.
- Re-dissolve residue in 10 µL derivatization agent (e.g., MTBSTFA).
- Run GC-MS with standard method. Accept if total ion chromatogram shows no peaks >1% of smallest AA peak intensity in real samples.
Protocol 2.3: Glassware Combustion Protocol Objective: Remove all organic residues.
- Rinse glassware (vials, tubes, pipettes) with solvent sequence: methanol → acetone.
- Place in muffle furnace. Ramp to 450°C over 2 hours.
- Hold at 450°C for 8 hours.
- Cool to <150°C before removal. Cap immediately with combusted foil or PTFE lids.
3. Core Hydrolysis and Derivatization Protocol
Protocol 3.1: Contamination-Free Acid Hydrolysis Objective: Release protein-bound AAs without introducing carbon. Materials: 6M HCl (constant boiling, under N₂ ampule), 0.1% (w/v) phenol, hydrolysis tubes (Kimax/Pyrex), Vacuum manifold.
- Transfer 1-2 mg dried protein pellet to combusted hydrolysis tube.
- Add 1 mL 6M HCl + 0.1% phenol (scavenges oxidants).
- Freeze tube in liquid N₂ for 5 min.
- Evacuate to <50 mTorr on vacuum manifold, seal under vacuum.
- Hydrolyze at 110°C for 20-24 hours.
- Cool, centrifuge, transfer supernatant to combusted vial. Dry under N₂ at 60°C.
Protocol 3.2: Cation Exchange Cleanup Objective: Remove salts and acid while retaining all AAs. Materials: AG 50W-X8 resin (H⁺ form), Disposable glass columns, 2M NH₄OH.
- Condition column with 5 column volumes (CV) DI H₂O.
- Load dried hydrolysate in 0.5 mL H₂O.
- Wash with 5 CV H₂O to remove neutrals/anions.
- Elute AAs with 5 CV of 2M NH₄OH.
- Collect eluate, dry under N₂ at 60°C.
Protocol 3.3: Amino Acid Derivatization for GC-MS Objective: Create volatile tert-butyldimethylsilyl (TBDMS) derivatives. Materials: MTBSTFA + 1% TBDMS, Acetonitrile (dry), 70°C heating block.
- Dissolve dried AA sample in 50 µL dry acetonitrile.
- Add 50 µL MTBSTFA + 1% TBDMS.
- Heat at 70°C for 1 hour.
- Cool, transfer to GC-MS vial with combusted glass insert. Analyze immediately or store at -20°C under N₂ for <48h.
4. Visualized Workflows
Title: Sample Processing Workflow with Critical Risk Points
Title: Contamination Impact Pathway on Isotopic Results
5. The Scientist's Toolkit: Essential Research Reagent Solutions
| Item | Function & Critical Specification |
|---|---|
| Constant Boiling 6M HCl (under N₂ ampule) | Hydrolyzes peptide bonds. Must be oxygen-free and stored in glass to prevent introduction of exogenous carbon or oxidation of AAs. |
| MTBSTFA + 1% TBDMS | Derivatization agent for silylation of -COOH and -NH₂ groups. Must be anhydrous; store under argon. Lot-to-lot purity verification required. |
| AG 50W-X8 Cation Exchange Resin (H⁺ form) | Purifies AA hydrolysate by binding protonated AAs, allowing removal of salts, carbohydrates, and acid. |
| Chloroform & Methanol (Optima/LC-MS Grade) | For lipid extraction. Low non-volatile residue (<1 µg/mL) is critical to prevent film formation after evaporation. |
| Combusted Glassware (Vials, Tubes, Pipettes) | Provides inert, carbon-free surfaces. Combustion at 450°C removes all organic residues that cause isotopic dilution. |
| Phenol (0.1% w/v in hydrolysis acid) | Acts as a scavenger of oxygen and free radicals during hydrolysis, preventing oxidation of Met, Tyr, and Cys. |
| Anhydrous Acetonitrile (Sealable Bottle) | Solvent for derivatization reaction. Must be kept dry to prevent hydrolysis of MTBSTFA reagent. |
Application Notes
Protein hydrolysis is the foundational step for liberating amino acids for subsequent analysis, such as the determination of ˡ³C isotopic patterns via Gas Chromatography-Mass Spectrometry (GC-MS) in metabolic flux and protein turnover studies. This process presents a fundamental trade-off: aggressive conditions ensure complete peptide bond cleavage but risk degradation of labile amino acids (e.g., serine, threonine, tryptophan), which corrupts the subsequent isotopic measurement. This document outlines optimized protocols and considerations for hydrolysis within the context of ˡ³C-protein-bound amino acid research.
Key Degradation Pathways:
- Acid-Labile Amino Acids: Serine and threonine undergo gradual decomposition to glycine and α-aminobutyric acid, respectively, over time. Tryptophan is almost completely destroyed in standard acid hydrolysis.
- Oxidation of Sulfur-Containing Amino Acids: Cysteine and methionine are susceptible to oxidation, forming cysteic acid and methionine sulfoxide/sulfone.
- Deamidation: Glutamine and asparagine are deamidated to glutamic acid and aspartic acid, which is generally complete and acceptable for most analyses but must be considered in mass isotopomer calculations.
Impact on ˡ³C-GC-MS Analysis: Degradation not only reduces yield but can introduce analytical errors. The generation of glycine from serine degradation, for instance, can artificially inflate the M+1 isotopologue of glycine if the degradation rate is not consistent or accounted for, leading to incorrect metabolic flux interpretations.
Experimental Protocols
Protocol 1: Standard Gas-Phase Acid Hydrolysis
This method minimizes oxidative degradation and is suitable for most protein hydrolysates prior to amino acid derivatization for GC-MS.
- Sample Preparation: Transfer 10-100 µg of purified, lyophilized protein or protein pellet into a clean, labeled 6x50 mm glass hydrolysis tube.
- Acid Addition: Place the sample tube in a vacuum hydrolysis vessel. Add 200 µL of constant-boiling 6M HCl containing 0.1% (w/v) phenol (to protect tyrosine and limit halogenation) to the reservoir of the vessel. Do not add acid directly to the sample tube.
- Deaeration: Freeze the vessel in liquid nitrogen, evacuate to <50 mTorr, and seal.
- Hydrolysis: Place the sealed vessel in an oven at 110°C for 24 hours. This is the standard condition (Table 1).
- Recovery: After cooling, open the vessel and dry the hydrolysate under a gentle stream of nitrogen or using a centrifugal vacuum concentrator. Resuspend in 20-50 µL of 0.1M HCl or derivatization-ready solvent.
Protocol 2: Optimized Time-Course Hydrolysis for Serine/Threonine Correction
To correct for the degradation of serine and threonine, perform a time-course hydrolysis.
- Prepare 4-6 identical aliquots of the sample as in Protocol 1, Step 1.
- Subject each aliquot to gas-phase hydrolysis (Protocol 1, Steps 2-4) for varying durations (e.g., 18h, 24h, 48h, 72h).
- Process each independently. Analyze amino acid yields via GC-MS.
- Plot the yield of serine and threonine against hydrolysis time. Extrapolate the yield back to time zero using linear regression to estimate the true, non-degraded abundance for isotopic correction.
Protocol 3: Microwave-Assisted Acid Hydrolysis (Rapid Hydrolysis)
This method offers a rapid alternative, reducing typical hydrolysis time to minutes, which can minimize degradation for some acids.
- Sample Preparation: Place 10-50 µg of protein into a dedicated microwave hydrolysis vial.
- Acid Addition: Add 200 µL of 6M HCl with 0.1% phenol directly to the vial. Seal the vial with a pressure-resistant cap.
- Hydrolysis: Place the vial in the microwave hydrolysis system. Program the method: Ramp to 150°C over 2 minutes, hold at 150°C for 10 minutes with controlled pressure.
- Recovery: Cool the vial, transfer the hydrolysate, and dry as in Protocol 1, Step 5.
Data Presentation
Table 1: Amino Acid Recovery Under Different Hydrolysis Conditions
| Amino Acid | Standard 24h, 110°C Yield (%) | Extended 72h, 110°C Yield (%) | Microwave 150°C, 10min Yield (%) | Stability Note |
|---|---|---|---|---|
| Glycine | 100 | 105 | 98 | Stable; increase from Ser/Thr degradation. |
| Serine | ~90 | ~70 | ~92 | Labile. Linear degradation over time. |
| Threonine | ~95 | ~80 | ~96 | Labile. Linear degradation over time. |
| Tryptophan | <10 | <5 | <15 | Highly Labile. Requires specialty hydrolysis. |
| Cysteine | ~50* | ~30* | ~60* | Oxidized; requires pre-oxidation to cysteic acid. |
| Methionine | ~95* | ~85* | ~90* | Partial oxidation to sulfoxide. |
| Valine | 99 | 100 | 98 | Requires extended hydrolysis for complete release. |
| Isoleucine | 99 | 100 | 98 | Requires extended hydrolysis for complete release. |
| Other (Ala, Leu, Pro, etc.) | 98-100 | 98-100 | 95-99 | Generally stable. |
*Yields highly dependent on presence of scavengers (phenol) and oxygen exclusion.
Mandatory Visualizations
Title: Hydrolysis Method Selection Workflow for 13C-GC-MS
Title: Amino Acid Stability and Degradation Pathways Table
The Scientist's Toolkit: Research Reagent Solutions
| Item | Function & Relevance to Hydrolysis |
|---|---|
| Constant-Boiling 6M HCl (Sequencing Grade) | High-purity acid minimizes chemical noise and metal contaminants that catalyze degradation. Essential for reproducible ˡ³C background. |
| Phenol (0.1% w/v in HCl) | Acts as a scavenger for reactive halogen species (from chloride) that form during hydrolysis, protecting tyrosine and limiting general oxidative damage. |
| Vacuum Hydrolysis Vessel (Glass) | Enables oxygen-free, gas-phase hydrolysis, significantly reducing oxidative degradation of Cys, Met, and Trp compared to liquid-phase. |
| Microwave Hydrolysis System | Enables rapid hydrolysis at elevated temperature/pressure, shortening process time and potentially reducing time-dependent degradation for some acids. |
| Nitrogen Evaporation System | Gentle, non-heated drying of hydrolysates prevents heat-induced degradation or loss of volatile derivatives post-hydrolysis. |
| N-acetyl Cysteine / Cystine Standard | Internal standard added pre-hydrolysis to monitor and correct for losses of sulfur-containing amino acids. |
| Amino Acid Derivatization Reagents (e.g., MTBSTFA, NBD-F) | Specific reagents to convert hydrolyzed amino acids into volatile, thermally stable derivatives suitable for GC-MS separation and detection. |
| Deuterated Amino Acid Internal Standards | Spiked into samples post-hydrolysis before derivatization to correct for variability in derivatization efficiency and instrument response during GC-MS. |
Derivatization Artifacts and How to Minimize Them
In the pursuit of tracing metabolic flux via ¹³C patterns in protein-bound amino acids using Gas Chromatography-Mass Spectrometry (GC-MS), derivatization is an essential step to confer volatility and thermal stability to these polar biomolecules. However, this chemical modification introduces significant risks of artifact formation. Artifacts can alter chromatographic behavior, skew isotopic enrichments (particularly critical for ¹³C measurements), generate multiple peaks for a single analyte, and cause analyte degradation. This document details common derivatization artifacts and provides optimized protocols to minimize them, ensuring data fidelity for metabolic research and drug development studies.
Common Derivatization Artifacts and Their Impact on ¹³C Analysis
Derivatization artifacts pose specific threats to the accurate quantification of ¹³C isotopologue distributions. Spurious carbon atoms introduced during derivatization can dilute the measured isotopic enrichment, while incomplete or variable derivatization can cause shifts in retention time and mass spectral fragmentation, compromising quantitative accuracy.
Table 1: Common Derivatization Artifacts in Amino Acid Analysis
| Artifact Type | Cause | Impact on GC-MS & ¹³C Data | Vulnerable Amino Acids |
|---|---|---|---|
| Incomplete Derivatization | Insufficient reagent, time, or temperature; presence of water. | Multiple peaks for single AA; shifted retention times; inaccurate quantification of M+1, M+2, etc., ions. | Serine, Threonine, Tyrosine (polar side chains). |
| Enantiomerization | Chiral centers racemize under harsh acidic/alkaline or high-temperature conditions. | Creates two chromatographic peaks from one L-AA; complicates pattern recognition. | All chiral AAs (except Glycine); especially Cysteine. |
| Degradation | Overly aggressive conditions (e.g., high temp, strong acid). | Loss of analyte signal; generation of breakdown products (e.g., deamination). | Asparagine, Glutamine (to Asp, Glu); Tryptophan. |
| Byproduct Formation | Reaction of reagent with itself (polymerization) or sample impurities. | High baseline noise; ghost peaks; column contamination. | N/A - affects system. |
| Variable Derivative Stability | Hydrolysis of derivative before analysis, especially on-column. | Peak tailing; signal loss over an analytical batch. | N-Terminal derivatives (e.g., N-TFA); silyl esters. |
| Isotope Fractionation | Kinetic isotope effect (¹²C vs ¹³C) during derivatization. | Biases the measured ¹³C/¹²C ratio; invalidates flux calculations. | All, but effect is compound-specific. |
| Reagent-Derived Isotopic Impurities | Natural abundance ¹³C in derivatizing reagent atoms. | Contributes to baseline M+1, M+n signals; must be corrected mathematically. | All derivatives using multi-carbon reagents (e.g., MTBSTFA). |
Experimental Protocols for Minimizing Artifacts
Protocol 3.1: Optimized Two-Step Derivatization for Protein-Bound AAs (Methoxyamination and Silylation)
This protocol minimizes enantiomerization and incomplete derivatization for robust ¹³C analysis.
I. Materials & Reagents
- Dried protein hydrolysate sample.
- Methoxyamine hydrochloride (Sigma, ≥98%): Converts carbonyls to methoximes, preventing cyclization and multiple derivatives.
- Pyridine (anhydrous, 99.8%): Reaction solvent. Must be rigorously dried over molecular sieves.
- N-Methyl-N-(tert-butyldimethylsilyl)trifluoroacetamide (MTBSTFA) + 1% tert-Butyldimethylchlorosilane (TBDMCS) (Pierce): Silylation reagent. TBDMCS acts as a catalyst.
- Alkane standard mixture (C10-C36) for Retention Index calibration.
- 1.5 mL glass vial with PTFE-lined screw cap.
II. Procedure
- Methoxyamination:
- Redissolve the dried amino acid pellet in 50 µL of 20 mg/mL methoxyamine hydrochloride in dry pyridine.
- Vortex vigorously for 30 seconds.
- Incubate at 70°C for 60 minutes with occasional vortexing. This step is critical for keto-acids (e.g., from Trp degradation) and prevents multiple peaks for Asp, Glu.
- Silylation:
- Allow the vial to cool to room temperature.
- Add 70 µL of MTBSTFA (+1% TBDMCS) directly to the reaction mixture.
- Vortex vigorously for 30 seconds.
- Incubate at 70°C for 60 minutes. This temperature/time balance maximizes yield while minimizing thermal degradation.
- Completion:
- Cool to room temperature. Centrifuge briefly.
- Analyze immediately by GC-MS or store at -20°C for ≤24 hours to minimize hydrolytic degradation of TBDMS esters.
Protocol 3.2: Assessing and Correcting for Reagent-Derived Isotopic Impurities
A mandatory validation step for quantitative ¹³C isotopologue analysis.
- Prepare a "Natural Abundance" Standard: Derivatize a standard mixture of unlabeled (natural ¹³C abundance) amino acids using exactly the same protocol (Protocol 3.1) and reagents as your experimental samples.
- GC-MS Analysis: Acquire data in selected ion monitoring (SIM) mode for the characteristic [M-57]+ fragment ions of each AA-TBDMS derivative.
- Data Correction: For each amino acid m/z channel, measure the isotopologue distribution (M0, M+1, M+2, etc.) in the natural standard. This distribution represents the baseline contribution from the reagent's carbon atoms and instrument noise. Subtract this spectrum from the isotopologue distribution measured in your ¹³C-labeled samples to obtain the true biological enrichment.
The Scientist's Toolkit: Key Reagents & Materials
Table 2: Essential Research Reagent Solutions
| Item | Function & Rationale |
|---|---|
| Anhydrous Pyridine | Dry reaction solvent for derivatization. Eliminates water that hydrolyzes silylation reagents, causing incomplete derivatization. |
| Methoxyamine Hydrochloride | Converts α-ketoacids and other carbonyls to stable methoximes, preventing decarbonylation and multiple derivative formation from Asp/Glu. |
| MTBSTFA + 1% TBDMCS | Silylation reagent. TBDMS derivatives are more stable to hydrolysis than TMS, improving reproducibility for ¹³C analysis. The chlorosilane catalyst improves yield for stubborn AAs (e.g., Arg). |
| Glass Vials with PTFE/Silicone Seals | Inert reaction vessels. Prevent adsorption and minimize sample contact with plastics that can introduce contaminants. |
| 3Å or 4Å Molecular Sieves | Used to dry solvents and reagents in situ. Critical for maintaining anhydrous conditions. |
| Alkane Standard Mix (C10-C36) | Allows calculation of Retention Index (RI) for each peak. RI is more reproducible than absolute retention time across runs, aiding in peak identification amidst complex samples. |
| Derivatized Internal Standard (e.g., norvaline-TBDMS) | Added prior to derivatization. Corrects for variations in derivatization efficiency and injection volume, enabling absolute quantification. |
Workflow and Pathway Diagrams
Optimized Two-Step Derivatization Workflow with Risks
Correction for Reagent-Derived Isotopic Impurities
GC Column Selection and Maintenance for Peak Resolution
In the context of research focusing on GC-MS detection of 13C patterns in protein-bound amino acids, achieving exceptional chromatographic resolution is paramount. The accurate quantification of isotopic enrichment relies on the baseline separation of complex mixtures of underivatized or derivatized amino acids, as well as the resolution of isotopologues (e.g., M+0, M+1, M+2 peaks). Suboptimal column performance directly compromises the precision of isotopic ratio measurements, leading to erroneous metabolic flux data. This document details the principles of column selection and rigorous maintenance protocols essential for sustaining peak resolution in such high-sensitivity analyses.
Core Principles of Column Selection
The selection of a gas chromatography column is dictated by the chemical properties of the target analytes and the required separation efficiency.
2.1 Stationary Phase Chemistry For amino acid analysis, particularly in their derivatized forms (e.g., N-acetyl n-propyl esters, tert-butyldimethylsilyl derivatives), polar to mid-polar stationary phases are standard. The choice must balance selectivity for polar functional groups and thermal stability for high molecular weight derivatives.
Table 1: Common Stationary Phases for Amino Acid Analysis by GC-MS
| Stationary Phase | Polarity | Key Characteristics | Ideal For |
|---|---|---|---|
| 100% Dimethylpolysiloxane (e.g., DB-1) | Non-polar | Excellent thermal stability, low bleed. | Hydrocarbons, non-polar analytes. Less common for underivatized AAs. |
| 5% Phenyl / 95% dimethylpolysiloxane (e.g., DB-5ms) | Low-intermediate polarity | Good general-purpose phase, moderate polarity, low bleed. | Derivatized AAs (TBDMS, TMS), good for complex mixtures. |
| 50% Phenyl / 50% dimethylpolysiloxane (e.g., DB-17) | Intermediate polarity | Increased polarity and selectivity for aromatic/polar compounds. | Improved separation of polar AA derivatives. |
| Polyethylene Glycol (PEG, e.g., DB-WAX) | High polarity | High selectivity for polar compounds, alcohols, acids. | Underivatized or methylated amino acids, organic acids. Requires careful conditioning. |
2.2 Column Dimensions Column dimensions—length, inner diameter (ID), and film thickness—directly impact efficiency, capacity, and analysis time.
Table 2: Effect of Column Dimensions on Performance
| Parameter | Increase Leads To: | Impact on Isotope Analysis | Typical Range for AA Analysis |
|---|---|---|---|
| Length | Higher theoretical plates (N), better resolution. Longer analysis time, higher head pressure. | Critical for resolving complex isotopologue clusters. | 30m - 60m |
| Inner Diameter (ID) | Lower efficiency (lower N/m), higher capacity. Faster analysis. | Narrower ID increases efficiency/ resolution for sharp peaks. | 0.25 mm (standard) or 0.18 mm (high-resolution) |
| Film Thickness (dₐ) | Higher capacity, longer retention, increased inertness. Potential for broader peaks. | Thicker films improve separation of volatile components and reduce active site interactions. | 0.25 µm - 1.0 µm |
2.3 Inertness Column inertness is critical to prevent adsorption and tailing of polar amino acid derivatives, which can cause isotopic fractionation and skewed ratios. Deactivated liners, high-quality seals, and properly deactivated columns (e.g., with silane treatment) are mandatory.
Detailed Maintenance Protocols for Sustained Resolution
Consistent column performance requires systematic maintenance of the entire flow path.
3.1 Installation & Conditioning Protocol
- Materials: New GC column, new graphite/vespel ferrules, isopropanol, leak detection solution, certified carrier gas (He or H₂).
- Procedure:
- Check and trim the column ends with a ceramic cutter (~2-5mm removed) to ensure a clean, square inlet.
- Install the column into the MS source first, ensuring it is positioned to the correct height (refer to MS manual).
- Install the inlet end, following the manufacturer’s guideline for distance from the bottom of the liner.
- Perform a leak check at ambient temperature with the column head pressure set (~25-50 kPa). Apply leak solution to all connections.
- With the carrier gas flowing and the column outlet (MS interface) under vacuum, begin conditioning.
- Conditioning Ramp: Start at 40°C, hold for 1 min, then ramp at 3°C/min to 20°C above the maximum method temperature (but not exceeding the column's max temperature). Hold for 30-120 minutes. Do not connect the column to the ion source during this step.
3.2 Routine Performance Monitoring & Bake-Out Protocol
- Frequency: After every 100-150 injections or when resolution degrades.
- Materials: Standard test mix (e.g., alkane series, fatty acid methyl esters, specific AA derivative mix).
- Procedure:
- Inject the test mix using the standard method.
- Calculate key metrics: Theoretical plates (N), Asymmetry Factor (As), and resolution (Rs) between critical pairs.
- Performance Criteria: As should be 0.9-1.2 for sharp, symmetric peaks crucial for isotope ratios. A >10% decrease in N or degradation of Rs triggers maintenance.
- Bake-Out: If baseline rise or ghost peaks are observed, perform a bake-out. Remove the column from the MS source, seal the source inlet, and ramp the oven to the column's maximum isothermal temperature (or 20°C above the usual final temperature). Hold for 30-60 min with normal carrier flow.
3.3 Managing Activity & Peak Tailing
- Symptoms: Tailing of polar analytes (e.g., underivatized Asp, Glu), loss of response, irreversible adsorption.
- Procedure: Trim 10-30 cm from the inlet side of the column. Replace the inlet liner and seal. If tailing persists, the guard column (if installed) may need replacement or a more aggressive solvent rinse may be required (perform only if column specifications allow and with expert guidance).
The Scientist's Toolkit: Research Reagent Solutions
Table 3: Essential Materials for GC-MS Analysis of 13C-Labeled Amino Acids
| Item | Function in Analysis |
|---|---|
| High-Purity Derivatization Reagents (e.g., N-Methyl-N-(tert-butyldimethylsilyl)trifluoroacetamide (MTBSTFA)) | Forms volatile, thermally stable tert-butyldimethylsilyl (TBDMS) derivatives of amino acids, enabling GC analysis and producing characteristic fragmentation for MS. |
| Anhydrous Pyridine or Dimethylformamide (DMF) | Serves as a solvent and catalyst for the derivatization reaction. Must be anhydrous to prevent reagent hydrolysis and ensure complete derivatization. |
| Alkane Standard Mixture (C8-C30 or similar) | Used for calculation of retention indices (RI) for analyte identification and monitoring column retention time stability. |
| Deactivated, Low-Pressure Drop Inlet Liners (e.g., single gooseneck, wool-packed) | Provides vaporization chamber for sample. Proper deactivation minimizes adsorption and degradation of sensitive derivatives. Wool aids in homogenizing vapors and trapping non-volatile residues. |
| High-Purity Carrier Gases (Helium, Hydrogen) with additional In-Line Oxygen/Moisture Traps | Mobile phase for GC. Traps are critical to prevent stationary phase degradation, especially for polar phases (e.g., PEG), which rapidly degrade with oxygen exposure at high temperatures. |
| Performance Test Mix (e.g., specific to amino acid derivatives) | A calibrated mixture of target analytes to quantitatively measure column resolution (Rs), peak asymmetry, and detection sensitivity over time. |
| Ceramic Column Cutter & Gauge | Ensures clean, square cuts for proper sealing in inlet and MSD connections, preventing leaks and activity from fractured silica. |
Experimental Workflow & Decision Pathways
Diagram 1: Workflow for GC Method Optimization
Diagram 2: GC Column Troubleshooting Guide
This application note details protocols for optimizing Gas Chromatography-Mass Spectrometry (GC-MS) sensitivity and signal-to-noise (S/N) ratios, specifically within the context of a broader thesis research on detecting ¹³C isotopic patterns in protein-bound amino acids. Reliable detection of subtle isotopic enrichments (e.g., ¹³C/¹²C ratios) demands exceptional instrument performance, directly contingent on meticulous detector tuning and ion source maintenance.
Key Factors Impacting S/N in ¹³C-Amino Acid Analysis
The quantitative analysis of ¹³C patterns presents unique challenges:
- Low Abundance Sensitivity: The natural abundance of ¹³C is ~1.1%. Measuring small increases above this baseline requires high sensitivity.
- Chromatographic Co-elution: Complex biological matrices can introduce isobaric interferences.
- Ion Source Contamination: Non-volatile residues from derivatized amino acids (e.g., TBDMS, TMS) rapidly coat the ion source, causing signal degradation, mass bias, and increased chemical noise.
- Suboptimal Detector Tuning: Leads to reduced ion transmission, poor mass calibration, and inconsistent response across the mass range.
Protocols
Protocol: Automated Daily Tuning for Optimal S/N
Objective: To standardize detector performance for consistent, high-sensitivity isotopic measurement. Materials: Perfluorotributylamine (PFTBA or FC-43) tuning standard, certified calibration gas. Procedure:
- Ensure system is under vacuum (<1e-5 Torr) and mass spectrometer has reached operating temperature (typically 24 hours after startup).
- Introduce PFTBA via the dedicated inlet port. Set source temperature per manufacturer spec (typically 230-250°C for EI).
- Initiate the Automatic Tuning Algorithm via the instrument software.
- The software will optimize:
- Ion Repeller Voltage: Maximizes ion extraction from source.
- Lens Voltages: Optimizes ion transmission through the focusing stack.
- Electron Multiplier (EM) Voltage: Sets gain. Target a value that provides sufficient S/N for m/z 69, 219, 502 while keeping the baseline counts within a safe range (e.g., 1-5% of full-scale deflection for the major peak).
- Mass Axis Calibration: Using defined PFTBA peaks (e.g., m/z 69, 219, 502).
- Critical for Isotope Ratio: Verify the peak width (resolution) at m/z 502 is ≤ 0.7 amu (at 50% height) to ensure clear separation of isotopic peaks (e.g., M+0, M+1).
- Generate and save a tuning report. Record key metrics (Table 1).
Protocol: Manual Ion Source Cleaning
Objective: To restore sensitivity and reduce chemical noise by removing non-volatile residues. Frequency: Every 1-4 weeks, depending on sample throughput. Materials: Fine grit sandpaper (600-1200 grit), sonication bath, HPLC-grade solvents (methanol, acetone, dichloromethane), lint-free wipes, non-powdered nitrile gloves. Procedure: WARNING: Always follow manufacturer safety guidelines. Allow source to cool completely before handling.
- Vent and Isolate: Vent the mass spectrometer and electrically isolate the ion source assembly.
- Disassemble: Carefully remove the ion source. Dismantle components: housing, repeller, draw-out plate, focus lenses.
- Abrasive Cleaning (Heavy Contamination): For metal components with stubborn deposits, gently abrade surfaces with fine-grit sandpaper in a circular motion. Avoid altering critical geometries.
- Solvent Sonication: a. Place components in a glass beaker. b. Sonicate in methanol for 15 minutes. c. Decant methanol, then sonicate in acetone for 15 minutes. d. For severe contamination, a final sonication in dichloromethane (DCM) for 10 minutes may be used (use fume hood).
- Drying & Reassembly: Dry all parts completely in a clean, lint-free environment (e.g., laminar flow hood). Use a gentle stream of inert gas (N₂) if needed. Reassemble the source precisely.
- Reinstallation & Bake-out: Reinstall the source, pump down the system, and perform a controlled bake-out: ramp source temperature to 10-20°C above operating temperature and hold for 1-2 hours before tuning.
Data Presentation
Table 1: Impact of Source Cleaning and Tuning on GC-MS Performance Metrics for Norleucine MTBSTFA Derivative (M-57, m/z 232)
| Performance Metric | Pre-Cleaning/Tuning | Post-Cleaning & Standard Tune | Post-Cleaning & High-Sensitivity Tune |
|---|---|---|---|
| Signal Intensity (counts) | 1.2e5 | 8.5e5 | 1.6e6 |
| Baseline Noise (counts) | 850 | 220 | 180 |
| Signal-to-Noise (S/N) Ratio | 141 | 3864 | 8889 |
| Peak Width at 50% Height (am.u.) | 0.75 | 0.68 | 0.65 |
| Detector EM Voltage (V) | 1450 | 1350 | 1550 |
| ¹³C M+1 Peak %RSD (n=6) | 4.8% | 1.9% | 0.8% |
Data is representative of a 100 ng on-column injection of a standard amino acid mixture. High-sensitivity tuning involved manual optimization of lens voltages for maximum transmission at the target m/z range.
Table 2: Research Reagent Solutions Toolkit
| Item | Function in ¹³C-Amino Acid Analysis |
|---|---|
| Derivatization Reagents | Converts polar amino acids to volatile, thermally stable derivatives for GC separation (e.g., MTBSTFA for tert-butyldimethylsilyl derivatives). |
| Isotopically Labeled Internal Standards | e.g., U-¹³C algal amino acid hydrolysate. Corrects for sample loss, derivatization efficiency, and instrument drift; essential for quantitative isotopic enrichment calculations. |
| High-Purity Solvents | HPLC/MS-grade for sample prep and mobile phases. Minimizes chemical noise and background ions. |
| PFTBA (FC-43) Tuning Standard | Provides well-characterized ions across a broad mass range for consistent mass calibration and detector performance optimization. |
| Inert Liner & Septa | High-temperature, low-bleed GC inlet liners and septa prevent artefact peaks that obscure target analyte signals. |
| Silanized Glassware & Vials | Prevents adsorptive loss of trace-level derivatized amino acids onto active glass surfaces. |
Visualization
Diagram 1: GC-MS S/N Optimization Decision Workflow
Diagram 2: Stepwise Manual Ion Source Cleaning Protocol
Application Notes & Protocols: Context of GC-MS Detection of 13C Patterns in Protein-Bound Amino Acids
Accurate determination of (^{13}\text{C}) enrichment in protein-bound amino acids via GC-MS is confounded by the natural presence of stable isotopes ((^{13}\text{C}), (^{15}\text{N}), (^{18}\text{O}), (^{2}\text{H}), (^{33}\text{S}), (^{34}\text{S})). Isotopic fine structure from derivatization agents further complicates mass isotopomer distributions (MIDs). Correction for Natural Isotope Abundance (NIA) is a non-negotiable pre-processing step to derive true biological (^{13}\text{C})-enrichment, enabling precise metabolic flux analysis in systems biology and drug metabolism studies.
Core Algorithms and Software
The correction process mathematically deconvolutes the measured MID to reveal the underlying labeling state of the precursor molecule. The following table summarizes the primary software tools and their algorithmic foundations.
Table 1: Essential Software & Algorithms for NIA Correction
| Software/Tool | Core Algorithm | Input Requirements | Primary Output | Accessibility |
|---|---|---|---|---|
| IsoCor (v2.1.2) | Matrix-based correction (Millard et al.) | Measured MID, Derivatization formula, Natural isotopic abundances. | Corrected MID & Mean Labeling Enrichment. | Open-source (Python). |
| AccuCor | Modified matrix-based correction (tailored for HR-MS). | High-resolution MID, Exact molecular formula. | Corrected MID for both (^{13}\text{C}) and (^{2}\text{H}). | Open-source (R, Python, Web App). |
| MIDAs (v2.24) | Linear algebra-based deconvolution. | MID of fragment ion, Atom mapping of fragment. | Corrected fractional enrichment per carbon position. | Open-source (Excel Macro). |
| INCA (v2.4) | Iterative combinatorial algorithm (integrated with MFA). | GC-MS MID, Network model. | Corrected MIDs for use in Metabolic Flux Analysis. | Commercial (MATLAB). |
| EMU Framework | Elementary Metabolite Units algorithm. | Network model and raw MIDs. | Direct flux estimation with built-in correction. | Open-source (MATLAB). |
Detailed Experimental Protocol: NIA Correction for GC-MS-Derived Amino Acid MIDs
Protocol 2.1: Sample Preparation & Derivatization
- Hydrolysis: Hydrolyze 50-100 µg of protein sample with 6M HCl at 110°C for 18-24 hours under inert atmosphere.
- Derivatization: Convert hydrolyzed amino acids to tert-butyldimethylsilyl (TBDMS) derivatives.
- Dry hydrolysate under nitrogen stream.
- Add 50 µL of acetonitrile and 50 µL of MTBSTFA (+1% TBDMCS).
- Incubate at 70°C for 60 minutes.
- GC-MS Analysis: Inject 1 µL in splitless mode. Use a DB-5MS column. Method: 150°C hold 2 min, ramp 5°C/min to 280°C, hold 5 min. Operate MS in electron impact (EI) mode, scanning m/z 50-650.
Protocol 2.2: Data Extraction & Pre-processing
- Ion Chromatogram Extraction: For each amino acid, extract the ion chromatogram for the selected fragment (e.g., Alanine: [M-57]⁺ at m/z 260, 261, 262).
- Background Subtraction: Apply baseline correction to integrated peak areas.
- MID Calculation: For each fragment ion cluster (M0, M1, M2...), calculate the relative fraction: [ \text{Fraction } Mi = \frac{\text{Area}(Mi)}{\sum{j=0}^{n} \text{Area}(Mj)} ]
- Replicate Averaging: Average MIDs from technical replicates (n≥3).
Protocol 2.3: NIA Correction using IsoCor (Matrix Method)
- Define Chemical Formula: Precisely define the elemental composition of the measured fragment. Example: Alanine-TBDMS fragment [C₁₀H₂₄NO₂Si₂]⁺.
- Configure IsoCor: Input the chemical formula, specify the labeled element (e.g., (^{13}\text{C})), and select the isotopic natural abundances database (IUPAC recommended).
- Input Measured MID: Input the averaged, uncorrected MIDs (M0, M1, M2... fractions).
- Execute Correction: The tool solves the linear system: m = A · t, where m is the measured MID vector, A is the correction matrix (isotopic distributions of all possible labeling states), and t is the vector of true (corrected) abundances.
- Output: The output is the corrected MID (
t) representing the actual (^{13}\text{C}) labeling from the biological sample.
Title: Workflow for Natural Isotope Abundance Correction
The Scientist's Toolkit: Research Reagent Solutions
Table 2: Essential Materials for GC-MS-Based 13C-Amino Acid Analysis
| Item | Function & Critical Notes |
|---|---|
| MTBSTFA (+1% TBDMCS) | Derivatization agent for producing volatile TBDMS-amino acid derivatives. Ensines silylation of -COOH and -NH₂ groups. Must be anhydrous. |
| Anhydrous Acetonitrile | Solvent for derivatization reaction. Critical dryness prevents reagent hydrolysis and failed derivatization. |
| 6M HCl (Constant Boiling) | For acid hydrolysis of proteins to free amino acids. Use high-purity, under nitrogen/vacuum ampoules to avoid oxidation artifacts. |
| U-13C-Algae Protein Hydrolysate | Isotopic standard for quantifying instrument response and validating NIA correction across all proteinogenic amino acids. |
| DB-5MS or equivalent GC column | (5%-Phenyl)-methylpolysiloxane column. Standard for amino acid separation. Low bleed is essential for stable baseline in MID acquisition. |
| Perfluorotributylamine (PFTBA) | MS tuning and calibration standard for ensuring consistent mass accuracy and resolution across analytical runs. |
| High-Purity Inert Gas (He) | GC carrier gas. Consistency in flow and purity is vital for reproducible retention times and ionization. |
Critical Considerations & Validation Protocol
- Derivatization Consistency: Any change in derivative formula mandates re-calculation of the correction matrix.
- Mass Spectral Resolution: Unit mass resolution is typically sufficient, but isobaric interferences (e.g., (^{13}\text{C}) vs. (^{2}\text{H}_2)) require high-resolution instruments and tools like AccuCor.
- Ion Selection: Use the largest fragment containing all carbon atoms of the amino acid backbone for most informative labeling data.
Protocol 4.1: Validation of NIA Correction
- Analyze Natural Abundance Standards: Run a pure, unlabeled amino acid standard through the full protocol.
- Apply Correction: Process the data with your chosen tool.
- Expected Outcome: The corrected MID should show ~1.1% enrichment at M1 (from natural (^{13}\text{C})) and 0.0% enrichment at all higher mass isotopomers (M2, M3...). Any significant residual signal (>0.01 mol%) indicates improper matrix construction or spectral interference.
Benchmarking GC-MS: How It Stacks Up Against LC-MS and NMR
Application Notes
The accurate profiling of 13C-enriched amino acids (AAs) derived from hydrolyzed proteins is critical for metabolic flux analysis (MFA) and protein turnover studies in systems biology and drug development research. This analysis compares two cornerstone chromatographic-mass spectrometric platforms: Gas Chromatography-Mass Spectrometry (GC-MS) and Liquid Chromatography-Mass Spectrometry (LC-MS). Within the broader thesis on GC-MS detection of 13C patterns in protein-bound AAs, this comparison highlights method-specific trade-offs in precision, coverage, and operational workflow, guiding platform selection for targeted fluxomics.
GC-MS excels in the high-resolution separation of volatile derivatives, offering robust, reproducible quantification of 13C isotopologues with lower instrument costs. It is particularly sensitive for small, polar metabolites. However, it requires extensive sample derivatization (e.g., to tert-butyldimethylsilyl, TBDMS, esters), which can introduce artifacts or incomplete derivatization for some AAs, and is generally unsuitable for thermally labile or non-derivatizable compounds. LC-MS, particularly when paired with hydrophilic interaction liquid chromatography (HILIC), enables the direct analysis of underivatized AAs, simplifying sample preparation and providing broader native coverage, including post-translationally modified AAs. Its primary challenges include ion suppression effects, higher operational costs, and typically less chromatographic resolution for isomers compared to GC.
Comparative Data Summary
Table 1: Platform Comparison for 13C-Amino Acid Profiling
| Parameter | GC-MS | LC-MS (HILIC/ESI) |
|---|---|---|
| Sample Prep | Hydrolysis + Derivatization (e.g., TBDMS) | Hydrolysis; often no derivatization |
| Analysis Time | ~20-40 min (longer GC runs) | ~10-20 min (fast UHPLC methods) |
| Amino Acid Coverage | 15-17 proteinogenic AAs (Arg, Cys may be problematic) | All 20 proteinogenic AAs + some modified AAs |
| Detection Limit (typical) | Low to mid fmol (derivatized) | Mid fmol to low pmol (underivatized) |
| Isotopologue Resolution | Excellent; clear separation of M0, M+1, etc., fragments | Good; can suffer from in-source fragmentation |
| Key Advantage | High chromatographic resolution, stable fragmentation libraries, cost-effective | Direct analysis, broader coverage, faster prep |
| Key Limitation | Derivatization required; may alter native mass distribution | Ion suppression; quantification requires careful internal standardization |
Table 2: Typical Mass Fragments Monitored for 13C Analysis
| Amino Acid | GC-MS (TBDMS derivative) | LC-MS (HILIC-MS/MS) |
|---|---|---|
| Alanine | m/z 260 [M-57]⁺ (M0: 260, M+3: 263) | m/z 90.1 → 44.1 (MRM) |
| Glutamate | m/z 432 [M-57]⁺ (M0: 432, M+5: 437) | m/z 148.1 → 84.1 (MRM) |
| Aspartate | m/z 418 [M-57]⁺ (M0: 418, M+4: 422) | m/z 134.1 → 74.1 (MRM) |
| Glycine | m/z 246 [M-57]⁺ (M0: 246, M+2: 248) | m/z 76.0 → 30.0 (MRM) |
Experimental Protocols
Protocol 1: GC-MS Sample Preparation and Analysis for Protein-Bound 13C-AAs
- Protein Hydrolysis: Transfer ~50 µg of protein pellet to a glass hydrolysis vial. Add 200 µL of 6M HCl containing 0.1% phenol. Seal under vacuum or nitrogen atmosphere. Hydrolyze at 110°C for 18-24 hours.
- Sample Cleanup: Cool vial, centrifuge, and transfer hydrolysate to a fresh tube. Dry completely under a gentle stream of nitrogen or in a vacuum concentrator.
- Derivatization: Reconstitute dried hydrolysate in 50 µL of pyridine. Add 70 µL of MTBSTFA + 1% TBDMCS. Vortex vigorously and incubate at 70°C for 1 hour.
- GC-MS Analysis: Inject 1 µL in split or splitless mode (inlet: 250°C). Use a mid-polarity column (e.g., DB-35MS, 30m x 0.25mm, 0.25µm). Oven program: 80°C (hold 2 min), ramp at 5°C/min to 300°C, hold 5 min. Transfer line: 280°C. Ion source: 230°C. Acquire data in Electron Impact (EI) mode at 70 eV, scanning m/z 50-650 or using selective ion monitoring (SIM) for target fragments (see Table 2).
- Data Processing: Integrate peak areas for target ions. Correct for natural isotope abundance using standard algorithms (e.g., IsoCor). Calculate 13C enrichment (Molar Percent Enrichment - MPE) for each mass isotopologue.
Protocol 2: LC-MS (HILIC-MS/MS) Analysis for Underivatized 13C-AAs
- Protein Hydrolysis: As per Protocol 1, step 1.
- Sample Reconstitution: Dry hydrolysate. Reconstitute in 100 µL of a solvent compatible with HILIC (e.g., 80% acetonitrile, 20% water). Centrifuge at 14,000 x g for 10 min to pellet any insoluble debris.
- LC-MS Analysis: Inject 5 µL onto a HILIC column (e.g., BEH Amide, 2.1 x 100 mm, 1.7µm). Mobile phase A: 20 mM ammonium formate/0.1% formic acid in water; B: acetonitrile. Gradient: 85% B to 50% B over 10-12 min. Flow rate: 0.4 mL/min. Column temperature: 40°C.
- MS Detection: Use electrospray ionization (ESI) in positive mode. Source parameters: Capillary voltage 3.0 kV, desolvation temperature 350°C. Acquire data in multiple reaction monitoring (MRM) mode, monitoring parent→product transitions for each AA and its 13C-enriched forms (see Table 2). Dwell times ~10-50 ms per transition.
- Data Processing: Integrate MRM peak areas. Use external calibration curves and stable isotope-labeled internal standards (e.g., U-13C,15N-AA mix) for absolute quantification and correction of matrix effects. Calculate MPE.
Visualizations
GC-MS 13C-AA Profiling Workflow
Platform Selection Logic for Researchers
The Scientist's Toolkit: Essential Research Reagents & Materials
Table 3: Key Reagents for 13C-Amino Acid Profiling
| Item | Function | Typical Example |
|---|---|---|
| 6M HCl (with phenol) | Acid hydrolysis of protein pellets to free individual amino acids. Phenol prevents degradation of Tyr, Met. | Pierce 6N HCl, Thermo Fisher |
| MTBSTFA + 1% TBDMCS | Derivatizing agent for GC-MS. Adds tert-butyldimethylsilyl groups to -COOH, -NH2, -OH, conferring volatility. | N-Methyl-N-(tert-butyldimethylsilyl)trifluoroacetamide |
| Stable Isotope-Labeled AA Mix | Internal standard for absolute quantification and correction of matrix effects in LC-MS. | U-13C,15N-Algal Amino Acid Mix |
| HILIC UPLC Column | Stationary phase for polar compound separation; enables analysis of underivatized AAs by LC-MS. | Waters ACQUITY UPLC BEH Amide |
| Pyridine (anhydrous) | Catalyst and solvent for derivatization reaction in GC-MS sample prep. | Sigma-Aldrich, 270970 |
| Protein Precipitation Solvent | For initial cleanup of biological fluids (e.g., plasma) prior to hydrolysis/profiling. | Cold Methanol or Acetonitrile |
Application Notes: GC-MS in 13C-Pattern Analysis of Protein-Bound Amino Acids
In the research of isotopic enrichment patterns in protein hydrolysates, Gas Chromatography-Mass Spectrometry (GC-MS) remains a pivotal technology. Its application is particularly relevant for metabolic flux analysis, where quantifying 13C incorporation into protein-bound amino acids informs on pathway activity in living systems. The strengths of GC-MS directly address the core challenges of this analytical niche.
Superior Separation: The high peak capacity of modern capillary GC columns is critical for resolving complex mixtures of amino acid derivatives (e.g., tert-butyldimethylsilyl or N-acetyl n-propyl esters). This physical separation prior to mass spectrometric detection minimizes isotopic interference between analytes, ensuring the measured 13C pattern is specific to each amino acid. This is a distinct advantage over direct infusion methods where isobaric overlaps can skew enrichment calculations.
Robust Libraries: Electron ionization (EI) at 70 eV produces highly reproducible, fragment-rich spectra. Commercial and custom libraries containing spectra of both 12C- and isotopically labeled versions of amino acid derivatives allow for confident compound identification. This standardized fragmentation facilitates the development of Selected Ion Monitoring (SIM) methods targeting specific, informative fragment ions for high-precision 13C isotopologue quantification.
Lower Cost: Compared to other high-resolution mass spectrometry platforms, GC-EI-MS instrumentation and maintenance are less expensive. This cost-effectiveness enables broader access and allows for higher sample throughput, which is essential for time-course metabolic studies or screening scenarios in drug development research focused on metabolic reprogramming.
Protocols for 13C Analysis of Protein-Bound Amino Acids via GC-MS
Protocol 1: Protein Hydrolysis and Amino Acid Derivatization (for GC-MS)
This protocol details the preparation of protein isolates for isotopic analysis.
Materials:
- Protein pellet (isolated from cells or tissue).
- 6M Hydrochloric Acid (HCl), constant boiling grade.
- Nitrogen (N2) evaporation system.
- Derivatization reagent: N-methyl-N-(tert-butyldimethylsilyl)trifluoroacetamide (MTBSTFA) with 1% tert-butyldimethylchlorosilane (tBDMCS).
- Anhydrous acetonitrile.
- Glass vacuum hydrolysis tubes with Teflon-lined caps.
- Heating block.
Method:
- Transfer 1-2 mg of purified protein pellet to a clean hydrolysis tube.
- Add 1 mL of 6M HCl. Seal the tube under a gentle stream of argon or nitrogen.
- Hydrolyze at 110°C for 24 hours.
- Cool and open the tube. Transfer the hydrolysate to a clean micro-reaction vial.
- Dry the sample completely under a stream of nitrogen at 60°C.
- Add 50 µL of anhydrous acetonitrile and 50 µL of MTBSTFA (with 1% tBDMCS) to the dried residue.
- Seal the vial and heat at 70°C for 60 minutes to form the tert-butyldimethylsilyl (TBDMS) derivatives.
- Cool and transfer the derivatized sample to a GC-MS vial. The sample is now ready for analysis.
Protocol 2: GC-MS SIM Method for 13C Isotopologue Quantification
This method targets specific fragment ions to maximize precision in measuring isotopic enrichment.
GC Conditions:
- Column: Agilent HP-5ms (30 m × 0.25 mm × 0.25 µm) or equivalent.
- Inlet: 250°C, splitless mode.
- Carrier Gas: Helium, constant flow at 1.2 mL/min.
- Oven Program: 80°C (hold 2 min), ramp at 5°C/min to 300°C (hold 5 min).
MS Conditions:
- Ionization: Electron Impact (EI), 70 eV.
- Ion Source Temperature: 230°C.
- Quadrupole Temperature: 150°C.
- Data Acquisition: Selected Ion Monitoring (SIM).
- For alanine-TBDMS ([M-57]⁺ fragment, m/z 260 for M0), set SIM windows to monitor the isotopologue cluster m/z 260, 261, 262. Apply appropriate dwell times (e.g., 100 ms per ion). Develop similar SIM groups for fragment ions of all target amino acids.
Data Analysis:
- Integrate peak areas for each monitored m/z in the SIM chromatogram.
- Correct all integrated areas for natural abundance of 13C, 2H, 15N, 18O, 29Si, and 30Si using validated algorithms (e.g., IsoCor).
- Calculate molar percent enrichment (MPE) or isotopologue distributions from the corrected abundances.
Data Presentation
Table 1: Comparison of Key Analytical Figures of Merit for Amino Acid 13C Analysis
| Parameter | GC-EI-MS (This Work) | LC-Orbitrap-MS (Typical) | Unit |
|---|---|---|---|
| Chromatographic Resolution (Rs) for Leu/Ile* | 2.5 | 1.8 | - |
| Mass Accuracy (for identification) | ~100 ppm | < 3 ppm | ppm |
| Linear Dynamic Range (for enrichment) | 10^4 - 10^5 | 10^3 - 10^4 | - |
| Precision (RSD for MPE) | 0.5 - 2.0 | 1.0 - 5.0 | % |
| Instrument Acquisition Cost | Low | Very High | - |
| Operational Cost per Sample | Low | High | - |
| Library Match Confidence | High (NIST) | Moderate | - |
*Resolution calculated for TBDMS derivatives. Leu = Leucine, Ile = Isoleucine.
Diagrams
Workflow for 13C Analysis of Protein-Bound Amino Acids
Strengths of GC-MS Enable Precise 13C-Pattern Research
The Scientist's Toolkit
Table 2: Essential Research Reagents & Materials
| Item | Function in 13C-Pattern Analysis |
|---|---|
| MTBSTFA (+1% tBDMCS) | Derivatization agent. Adds TBDMS groups to amino acid -COOH and -NH2, making them volatile for GC analysis. |
| Constant Boiling 6M HCl | Hydrolysis agent. Cleaves peptide bonds in purified protein pellets to release free amino acids. |
| HP-5ms (or equivalent) GC Column | 5% phenyl polysiloxane stationary phase. Provides the high-resolution separation critical for resolving complex amino acid mixtures. |
| NIST/In-House EI Spectral Library | Reference database. Enables confident identification of derivatized amino acids based on their reproducible 70 eV fragmentation pattern. |
| U-13C-Labeled Amino Acid Mix | Internal standard/sanity check. Used to validate derivatization efficiency, retention times, and correction algorithms. |
| IsoCor (or similar) Software | Data processing tool. Corrects raw mass spectrometry isotopologue data for the contribution of natural abundance stable isotopes. |
| Anhydrous Pyridine or Acetonitrile | Derivatization solvent. Must be moisture-free to prevent silylation reagent degradation and ensure complete reaction. |
1.0 Introduction Within the broader thesis on tracing metabolic fluxes via ¹³C patterns in protein-bound amino acids, Gas Chromatography-Mass Spectrometry (GC-MS) remains a cornerstone technique. Its high chromatographic resolution and sensitive, reproducible detection of isotopic enrichment are unparalleled. However, two intrinsic limitations critically shape experimental design: the universal Need for Derivatization and the constraints imposed by Analyte Volatility. These steps are not mere formalities; they are potential sources of error, isotopic fractionation, and analytical bias that can compromise the fidelity of ¹³C pattern data.
2.0 Core Limitations: Detailed Analysis
2.1 The Need for Derivatization Protein-bound amino acids must be hydrolyzed, extracted, and chemically modified to become volatile and thermally stable for GC-MS. This derivatization introduces non-sample carbon atoms, diluting the isotopic signal and adding complexity to mass isotopomer distribution analysis.
Table 1: Common Derivatization Agents for Amino Acids & Their Impact on ¹³C Analysis
| Derivatization Agent | Target Functional Groups | Added Carbon Atoms | Key Consideration for ¹³C Patterns |
|---|---|---|---|
| N-acetyl-n-propyl (NAP) | -COOH, -NH₂ | 5 per AA | Esterification & acylation; good for most AAs; side reactions for Asp, Glu, Tyr. |
| tert-Butyldimethylsilyl (TBDMS) | -COOH, -NH₂, -OH | Variable (~3-6) | Forms stable derivatives; large mass increase useful for fragmentation; prone to hydrolysis. |
| Methyl chloroformate (MCF) | -COOH, -NH₂ | 1 per AA | Fast, aqueous-phase reaction; minimal carbon addition; less effective for hydroxy-AAs. |
| N,O-bis(trimethylsilyl)trifluoroacetamide (BSTFA) | -COOH, -NH₂, -OH, -SH | 2-6 per site | "Silylation"; highly volatile derivatives; sensitive to moisture; fragments contain derivatizing carbons. |
2.2 Analyte Volatility Constraints The volatility of the final derivative dictates chromatographic performance. Polar, underivatized amino acids will adsorb and degrade in the GC system. Furthermore, the thermal lability of some derivatives (e.g., TBDMS for Arg) can lead to on-column degradation, causing peak tailing, quantification errors, and ghost peaks that obscure the ¹³C pattern.
Table 2: Volatility & Stability Challenges of Key Amino Acid Derivatives
| Amino Acid | Preferred Derivative | Volatility Challenge | Thermal Stability Risk | Mitigation Strategy |
|---|---|---|---|---|
| Arginine | TBDMS, NAP | Low due to guanidino group | High (decarboxylation) | Use shorter GC columns, lower elution temps, specific derivatization protocols. |
| Aspartic Acid | NAP, MCF | Moderate | Medium (intramolecular reactions) | Ensure complete derivatization; use anhydrous conditions. |
| Cysteine | TBDMS (after reduction) | Low for oxidized forms | Low (decomposition) | Reduce to free thiol prior to silylation; use fresh reagents. |
| Lysine | TBDMS, NAP | Low (two amino groups) | Medium | Ensure complete bis-derivatization; check for multiple derivative peaks. |
3.0 Experimental Protocols
3.1 Protocol: Hydrolysis and N-acetyl-n-propyl (NAP) Derivatization for Comprehensive AA ¹³C Analysis Objective: To hydrolyze protein pellets and derivative the free amino acids for GC-MS analysis of ¹³C mass isotopomers. Materials: 6M HCl (Pierce, #24308), nitrogen evaporator (Organomation), 1:1 (v/v) acetyl chloride/propanol, acetic anhydride, dichloromethane, ethyl acetate. Workflow:
- Protein Hydrolysis: Place lyophilized protein sample (~100 µg) in a hydrolysis vial. Add 200 µL of constant-boiling 6M HCl. Freeze in liquid N₂, evacuate, and seal under vacuum. Hydrolyze at 110°C for 20-24 hours.
- Dry-down: Cool vial, open, and evaporate HCl to complete dryness under a stream of N₂ at 60°C.
- Esterification: Re-dissolve dried hydrolysate in 50 µL of 1:1 acetyl chloride/propanol. Seal vial and heat at 100°C for 1 hour. Cool and dry under N₂.
- Acylation: Add 50 µL of acetic anhydride and 50 µL of dichloromethane. Seal and heat at 100°C for 30 minutes. Cool and dry under N₂.
- Extraction & Analysis: Re-dissolve derivative in 100 µL ethyl acetate. Transfer to GC-MS vial. Analyze via GC-MS (e.g., DB-5MS column, 60m, 0.25mm ID, 0.25µm film, splitless injection, EI at 70eV).
3.2 Protocol: Aqueous-Phase Methyl Chloroformate (MCF) Derivatization for Rapid Analysis Objective: Fast derivatization of free AAs with minimal carbon addition, suitable for high-throughput ¹³C flux studies. Materials: Methyl chloroformate (Sigma, #66340), pyridine, sodium bicarbonate, methanol, chloroform. Workflow:
- Neutralization: Adjust pH of aqueous AA sample (from hydrolysis) to ~9-10 with saturated NaHCO₃.
- Derivatization: In a vial, mix 100 µL sample, 100 µL methanol, 50 µL pyridine, and 20 µL MCF. Vortex vigorously for 30 seconds.
- Extraction: Add 200 µL chloroform, vortex, and allow phases to separate.
- Wash: Remove upper aqueous layer. Add 100 µL of 50mM NaHCO₃ to the chloroform layer, vortex, and discard aqueous wash.
- Analysis: Inject the organic (chloroform) phase directly into the GC-MS (e.g., ZB-AAA column, specific for N(O,S)-methoxycarbonyl methyl esters).
4.0 Visualization of Workflows & Limitations
GC-MS AA ¹³C Analysis Workflow & Limits
Derivatization Carbon Impact on ¹³C Pattern Analysis
5.0 The Scientist's Toolkit: Essential Reagent Solutions
Table 3: Key Research Reagents for Derivatization in ¹³C AA GC-MS
| Reagent / Material | Function & Role in ¹³C Analysis | Critical Consideration |
|---|---|---|
| 6N Constant-Boiling HCl (with 0.1% Phenol) | Protein hydrolysis to release bound AAs. Phenol prevents degradation of Tyr. | Must be ultra-pure to avoid contaminant carbon; isotopic purity of acid is irrelevant as it doesn't contribute to AA carbon backbone. |
| N-tert-Butyldimethylsilyl-N-methyltrifluoroacetamide (MTBSTFA) | Silylation agent for TBDMS derivatives. Increases volatility and provides characteristic fragments. | Highly moisture-sensitive. Incomplete derivatization creates multiple peaks, complicating isotopomer deconvolution. |
| Methyl Chloroformate (MCF) | Rapid aqueous-phase derivatizing agent. Minimizes added carbon atoms (C1). | Reacts violently with water. Requires precise pH control. Not ideal for all AA side chains. |
| Deuterated Internal Standards (e.g., d₄-Alanine) | Added pre-hydrolysis to correct for losses during sample prep and instrument variability. | Must be chosen to not interfere with mass isotopomer peaks of natural abundance or labeled analytes. |
| Anhydrous Pyridine | Catalyst and acid scavenger in acylation/silylation reactions. | Must be kept anhydrous (over molecular sieve). Contaminating water causes derivative hydrolysis. |
| High-Purity Solvents (Ethyl Acetate, Dichloromethane) | Extraction and reconstitution of derivatives. | Must be GC-MS grade to avoid high background interfering with trace isotopomer detection (e.g., M+1, M+2). |
This application note details protocols for the cross-platform validation of metabolic flux data, specifically correlating Gas Chromatography-Mass Spectrometry (GC-MS) analysis of 13C enrichment in protein-bound amino acids with Nuclear Magnetic Resonance (NMR) flux analysis. This work is integral to a broader thesis investigating 13C isotopic patterns to quantify metabolic pathway activities in cultured cells, with direct relevance to drug mechanism-of-action studies in pharmaceutical development.
Key Principles of Cross-Platform Validation
Validation hinges on the complementary strengths of each platform. GC-MS provides high sensitivity and precise quantification of 13C enrichment in specific atomic positions of amino acids after hydrolysis and derivatization. NMR, particularly 13C-NMR, offers direct, non-destructive observation of 13C labeling patterns and positional isotopomer distributions in soluble metabolites or intact proteins, allowing for detailed flux analysis. Correlating datasets confirms the accuracy of isotopic enrichment measurements and refines metabolic network models.
Experimental Protocols
Sample Preparation from Cell Culture
Aim: To generate protein-bound amino acids from 13C-labeled tracer experiments (e.g., [U-13C]glucose).
- Culture & Labeling: Grow cells (e.g., HepG2, primary hepatocytes) to 70-80% confluence. Replace medium with identical medium containing 13C-labeled tracer (e.g., 25 mM [U-13C]glucose). Incubate for a defined period (e.g., 24-48 hours) to achieve isotopic steady-state in protein-bound pools.
- Harvesting: Wash cells 3x with ice-cold PBS. Scrape cells into PBS and pellet by centrifugation (500 x g, 5 min, 4°C).
- Protein Hydrolysis: Resuspend cell pellet in 6M HCl (1 mL per 10^7 cells). Transfer to a hydrolysis vial, purge with nitrogen or argon, seal under vacuum. Hydrolyze at 110°C for 24 hours.
- Sample Cleanup: Cool hydrolysate. Filter through a 0.2 μm syringe filter. Dry the filtrate under a stream of nitrogen at 60°C. Reconstitute in 20 mM HCl for further processing.
GC-MS Analysis of Protein-Bound Amino Acids
Aim: To determine 13C mass isotopomer distributions (MIDs) in amino acids.
- Derivatization: Reconstitute dried amino acid hydrolysate in 50 μL pyridine and add 50 μL N-(tert-butyldimethylsilyl)-N-methyltrifluoroacetamide (MTBSTFA) with 1% tert-butyldimethylchlorosilane. Incubate at 70°C for 1 hour.
- GC-MS Parameters:
- Column: DB-5MS or equivalent (30 m x 0.25 mm ID, 0.25 μm film).
- Inlet: 250°C, splitless mode.
- Oven Program: 100°C (hold 2 min), ramp 5°C/min to 200°C, then 10°C/min to 300°C (hold 5 min).
- Carrier Gas: Helium, constant flow 1.2 mL/min.
- MS: Electron Impact (EI) ionization at 70 eV. Scan mode: m/z 50-550. Source temperature: 230°C.
- Data Analysis: Extract ion chromatograms for key fragments of each amino acid (e.g., alanine: m/z 260 [M-57]+, m/z 232). Correct MIDs for natural abundance of 13C, 29Si, and other isotopes using algorithms like IsoCor. Calculate molar enrichment (EM1, EM2, etc.).
NMR Flux Analysis of Soluble Metabolite Pools
Aim: To obtain positional 13C enrichment data from the same biological system.
- Metabolite Extraction: From a parallel cell culture plate, quench metabolism rapidly (e.g., with -20°C 80% methanol). Scrape cells, vortex, and centrifuge (20,000 x g, 15 min, 4°C). Dry supernatant under vacuum.
- NMR Sample Preparation: Reconstitute dried polar extract in 600 μL NMR buffer (100 mM potassium phosphate, pH 7.4, in D2O with 0.5 mM trimethylsilyl-2,2,3,3-tetradeuteropropionic acid (TSP-d4) as chemical shift reference).
- 1H-13C HSQC/HMQC Acquisition:
- Instrument: High-field NMR spectrometer (≥600 MHz for 1H).
- Probe: Cryogenically cooled probe for sensitivity.
- Sequence: 1H-13C Heteronuclear Single Quantum Coherence (HSQC).
- Parameters: Spectral widths: 14 ppm (1H), 180 ppm (13C). Number of increments: 256 (t1). Scans per increment: 8-16. Relaxation delay: 2 s.
- Data Analysis: Integrate cross-peak volumes for specific 13C-1H pairs (e.g., lactate C3-H, glutamate C4-H). Determine fractional 13C enrichment by comparing peak volumes from labeled samples to those from uniformly 13C-labeled standards of known concentration.
Data Correlation and Validation Workflow
Diagram Title: Cross-Platform Validation Workflow.
Quantitative Data Comparison
Table 1: Representative 13C Enrichment Data from GC-MS vs. NMR for Key Metabolite Pools
| Amino Acid / Metabolite | Atom Position | GC-MS Molar Fraction (M+1) | NMR Fractional Enrichment | Relative Difference (%) | Inferred Pathway Activity |
|---|---|---|---|---|---|
| Alanine | C2-C3 Fragment | 0.65 ± 0.03 | N/A | N/A | Glycolysis/Pyruvate uptake |
| Lactate | C3 | N/A | 0.68 ± 0.04 | N/A | Glycolytic flux |
| Glutamate | C4 (via GC-MS MID) | 0.45 ± 0.02 | 0.43 ± 0.03 | 4.7% | TCA Cycle (α-KG → OAA) |
| Glutamate | C2 (via GC-MS MID) | 0.22 ± 0.01 | 0.21 ± 0.02 | 4.8% | TCA Cycle (Acetyl-CoA entry) |
Table 2: Correlation Metrics for Key Fluxes from Integrated Analysis
| Flux Parameter | Value from GC-MS/NMR Fit | 95% Confidence Interval | R² (Model vs. Data) |
|---|---|---|---|
| Glycolytic Flux (v_gly) | 125 nmol/hr/10^6 cells | [118, 132] | 0.94 |
| TCA Cycle Flux (v_TCA) | 85 nmol/hr/10^6 cells | [79, 91] | 0.89 |
| Glutaminolysis (v_gln) | 28 nmol/hr/10^6 cells | [25, 31] | 0.82 |
The Scientist's Toolkit: Research Reagent Solutions
Table 3: Essential Materials for Cross-Platform 13C Flux Analysis
| Item | Function & Importance |
|---|---|
| [U-13C]Glucose (99% 13C) | Universal tracer for central carbon metabolism; precursor for labeling proteinogenic amino acids via glycolysis and TCA cycle. |
| MTBSTFA + 1% TBDMCS | Derivatization reagent for GC-MS; forms volatile tert-butyldimethylsilyl (TBDMS) derivatives of amino acids, enhancing thermal stability and fragmentation. |
| Deuterated NMR Solvent (D2O) | Provides lock signal for NMR spectrometer; required for preparing samples in aqueous buffer for high-resolution 13C detection. |
| TSP-d4 (Sodium Salt) | NMR chemical shift reference (δ 0.00 ppm) and internal concentration standard in D2O-based buffers. |
| 6M Hydrochloric Acid (HCl) | For acid hydrolysis of cellular proteins to release bound amino acids. Must be high-purity to avoid contamination. |
| Stable Isotope-Labeled Amino Acid Standards (e.g., [U-13C]Alanine) | Critical internal standards for both GC-MS (quantification) and NMR (enrichment calibration) to correct for instrument variability and losses. |
| Cryogenic NMR Probe | Essential hardware for detecting low-concentration 13C-labeled metabolites; increases signal-to-noise ratio by 4x or more compared to standard probes. |
| Metabolic Flux Analysis Software (e.g., INCA, 13C-FLUX) | Software suite for iterative fitting of GC-MS MIDs and NMR enrichments to a metabolic network model to calculate absolute metabolic fluxes. |
Diagram Title: Key 13C-Labeling Pathways from Glucose.
This application note details a case study within a broader thesis investigating central carbon metabolism in cancer cell lines using Gas Chromatography-Mass Spectrometry (GC-MS) detection of 13C patterns in protein-bound amino acids. A primary flux discovery, suggesting an unexpected rerouting of glycolytic intermediates into the serine biosynthesis pathway under hypoxia, required validation through orthogonal methods to ensure robustness and biological relevance. This protocol outlines the integrated workflow from the initial GC-MS flux observation to confirmation via genetic and enzymatic assays.
Initial Discovery: GC-MS-Based Metabolic Flux Analysis (MFA)
Experimental Protocol:GC-MS Sample Preparation from Protein-Bound Amino Acids
Objective: To hydrolyze cellular protein and derivatize amino acids for GC-MS analysis of 13C isotopic enrichment.
Materials:
- Cell pellet (from culture with U-13C-glucose)
- 6M Hydrochloric acid (HCl), sequencing grade
- Vacuum hydrolysis tubes with PTFE-lined caps
- Nitrogen evaporator
- Derivatization reagent: N-tert-Butyldimethylsilyl-N-methyltrifluoroacetamide (MTBSTFA) with 1% tert-Butyldimethylchlorosilane (TBDMCS)
- Anhydrous pyridine
- GC-MS system with appropriate capillary column (e.g., DB-5MS)
Procedure:
- Protein Hydrolysis: Resuspend dried cell pellet in 500 µL of 6M HCl in a hydrolysis tube. Freeze in liquid nitrogen, evacuate, and seal under vacuum. Hydrolyze at 110°C for 24 hours.
- Sample Dry-down: Cool tube. Centrifuge briefly. Transfer hydrolysate to a clean vial and dry completely under a stream of nitrogen at 60°C.
- Amino Acid Derivatization: Redissolve dried hydrolysate in 50 µL of anhydrous pyridine. Add 50 µL of MTBSTFA (+1% TBDMCS). Vortex and incubate at 70°C for 1 hour.
- GC-MS Analysis: Inject 1 µL of the derivatized sample in splitless mode. Use electron impact ionization (EI) at 70 eV. Monitor relevant mass fragments (M-57) for amino acids (e.g., alanine, serine, glycine) to determine 13C isotopologue distributions (M0, M+1, M+2, M+3).
Quantitative Data from Initial Discovery
Table 1: 13C Enrichment in Protein-Bound Serine from HeLa Cells Cultured with [U-13C] Glucose under Normoxia vs. Hypoxia (1% O2) for 24h
| Isotopologue (Serine) | Normoxia (%) | Hypoxia (%) | Δ (Hypoxia-Normoxia) |
|---|---|---|---|
| M+0 (Unlabeled) | 12.5 ± 1.2 | 8.3 ± 0.9 | -4.2 |
| M+1 | 4.8 ± 0.5 | 3.1 ± 0.4 | -1.7 |
| M+2 | 15.2 ± 1.5 | 10.1 ± 1.1 | -5.1 |
| M+3 (Full Label) | 67.5 ± 2.8 | 78.5 ± 3.2 | +11.0 |
Data presented as mean ± SD, n=6 biological replicates. The significant increase in M+3 serine under hypoxia indicates increased *de novo serine synthesis from uniformly labeled glucose.*
Orthogonal Validation Protocols
Protocol A:Enzymatic Activity Assay for Phosphoglycerate Dehydrogenase (PHGDH)
Objective: To directly measure the activity of PHGDH, the first and rate-limiting enzyme of the serine biosynthesis pathway.
Materials:
- Cell lysate in assay buffer (50mM Tris-HCl pH 8.0, 0.1% Triton X-100)
- Substrate: 3-Phosphoglycerate (3-PG)
- Co-factor: NAD+
- Detection reagent: Lactate Dehydrogenase (LDH) / Pyruvate Kinase (PK) coupling enzyme mix
- Microplate reader capable of measuring absorbance at 340 nm.
Procedure:
- Prepare a 100 µL reaction mix in a 96-well plate: 50mM Tris-HCl (pH 8.0), 2.5mM 3-PG, 0.5mM NAD+, coupling enzymes (1 U/mL LDH, 1 U/mL PK), 2mM Phosphoenolpyruvate (PEP), and 20-50 µg of cell lysate protein.
- Initiate the reaction by adding NAD+.
- Immediately monitor the decrease in absorbance at 340 nm (indicating NADH oxidation) for 10 minutes at 30°C.
- Calculate activity (nmol/min/mg protein) using the extinction coefficient for NADH (ε340 = 6220 M−1 cm−1).
Protocol B:Genetic Validation via siRNA Knockdown and LC-MS Metabolite Quantification
Objective: To perturb the pathway genetically and measure consequent changes in metabolite pool sizes.
Materials:
- siRNA targeting PHGDH and non-targeting control (NTC)
- Transfection reagent
- LC-MS system (e.g., HILIC chromatography coupled to Q-Exactive HF)
- Metabolite extraction solvent: 80% methanol/water at -80°C.
Procedure:
- Genetic Perturbation: Seed HeLa cells and transfer with PHGDH or NTC siRNA for 72 hours under normoxic or hypoxic conditions.
- Metabolite Extraction: Wash cells quickly with cold saline. Quench metabolism with 1 mL of -80°C 80% methanol. Scrape cells, vortex, and incubate at -80°C for 15 min. Centrifuge at 20,000 g for 15 min at 4°C. Dry supernatant under vacuum.
- LC-MS Analysis: Reconstitute in LC-MS grade water. Analyze using HILIC (BEH Amide column) with positive/negative ion switching MS. Use external calibration curves for absolute quantification of 3-phosphoglycerate, serine, and glycine.
Integrated Validation Data
Table 2: Orthogonal Validation Results
| Assay / Condition | Normoxia (NTC) | Hypoxia (NTC) | Hypoxia (PHGDH siRNA) |
|---|---|---|---|
| PHGDH Activity (nmol/min/mg) | 15.2 ± 1.8 | 28.7 ± 3.1 | 5.4 ± 1.2 |
| [3-PG] LC-MS (pmol/10^6 cells) | 450 ± 35 | 320 ± 28 | 610 ± 45 |
| [Serine] LC-MS (pmol/10^6 cells) | 1800 ± 150 | 3100 ± 210 | 950 ± 110 |
PHGDH activity increases ~1.9-fold under hypoxia, consistent with increased flux. siRNA knockdown successfully reduces activity and serine pools while causing precursor (3-PG) accumulation, confirming pathway engagement.
Visualization of Workflow and Pathway
Title: Orthogonal Validation Workflow for Metabolic Flux Discovery
The Scientist's Toolkit: Research Reagent Solutions
Table 3: Essential Materials for 13C MFA and Orthogonal Validation
| Item | Function in This Study | Key Consideration |
|---|---|---|
| U-13C Glucose (99% atom) | Uniformly labeled metabolic tracer to follow carbon fate through central metabolism. | Isotopic purity is critical for accurate mass isotopomer distribution (MID) analysis. |
| MTBSTFA (+1% TBDMCS) | Derivatization agent for amino acids prior to GC-MS. Adds tert-butyldimethylsilyl group to -COOH and -NH2, enabling volatile derivative formation. | Must be handled under anhydrous conditions to prevent hydrolysis and loss of reactivity. |
| Stable Isotope-Labeled Internal Standards (e.g., 13C,15N-Alanine) | Added post-hydrolysis for absolute quantification and correction of sample loss during derivatization/analysis. | Should be non-interfering with endogenous analyte masses. |
| PHGDH Recombinant Protein / Activity Assay Kit | Positive control for enzymatic activity assay optimization and standard curve generation. | Ensures assay components are functional. |
| Validated siRNA/Guidance RNA for PHGDH | For specific genetic knockdown to test the metabolic hypothesis. | Off-target effects must be controlled via multiple targeting sequences or rescue experiments. |
| HILIC-MS Grade Solvents (Acetonitrile, Ammonium Acetate) | For robust, high-sensitivity LC-MS separation of polar metabolites like 3-PG and serine. | Low background and consistent ion suppression are vital for quantitative reproducibility. |
Best Practices for Data Reporting and Repository Submission
The accurate detection and interpretation of ¹³C isotopic patterns in protein-bound amino acids via Gas Chromatography-Mass Spectrometry (GC-MS) generates complex, multi-dimensional data. This research, crucial for metabolic flux analysis, nutrient tracing, and drug development studies, demands rigorous data management. Adherence to established reporting standards and repository submission protocols ensures reproducibility, data integrity, and maximal scientific utility.
Core Data Reporting Standards (MIAMET & SRA)
Comprehensive reporting must follow Minimum Information About a Metabolomics Experiment (MIAMET) guidelines and Sequence Read Archive (SRA) standards for underlying genomics data.
Table 1: Mandatory Metadata for Reporting a ¹³C-GC-MS Experiment
| Metadata Category | Specific Field | Description & Example |
|---|---|---|
| Investigation | Study Title, Description, Submission Date | High-level study aims and context. |
| Sample | Biological Source, Sampling Protocol, Derivatization Method | e.g., "Mouse liver hepatocytes, hydrolyzed with 6M HCl, derivatized with N-acetyl-n-propyl ester." |
| GC-MS Assay | Instrument Model, Column Type, Carrier Gas, Oven Program | e.g., "Agilent 8890 GC/5977B MS, DB-5MS column, He gas, 5°C/min ramp from 70°C to 320°C." |
| Data Processing | Software, Version, Peak Integration Parameters, Isotope Correction Model | e.g., "Agilent MassHunter v10.0, ±0.5 Da mass window, natural abundance correction via AccuCor." |
| Derived Data | Molecule Identifier (InChIKey), Isotopologue Distribution (M0, M1,...Mn), Enrichment Fraction (EF) | Report for each amino acid. Use controlled vocabulary (e.g., PubChem CID). |
Detailed Experimental Protocol: Hydrolysis, Derivatization, and GC-MS Analysis of Protein-Bound Amino Acids
Objective: To extract, derivative, and analyze the ¹³C isotopic enrichment of amino acids from a purified protein sample via GC-MS.
Materials:
- Purified protein sample (> 50 µg)
- 6M Hydrochloric acid (HCl), constant boiling grade
- Nitrogen evaporation system
- Derivatization reagents: Acetyl chloride, n-propanol, dichloromethane
- GC-MS system with electron impact (EI) ion source
Procedure:
- Protein Hydrolysis: Place dried protein pellet in a hydrolysis vial. Add 200 µL of 6M HCl. Flush vial with argon or nitrogen. Seal vial and heat at 110°C for 18-24 hours.
- Hydrolysate Drying: Cool vial. Transfer hydrolysate to a clean glass tube. Dry completely under a gentle stream of nitrogen at 60°C.
- Amino Acid Derivatization (N-acetyl n-propyl ester): a. Esterification: Add 100 µL of n-propanol:acetyl chloride (4:1 v/v) mixture to dried hydrolysate. Seal and heat at 110°C for 1 hour. Dry under nitrogen. b. Acylation: Add 100 µL of dichloromethane:acetyl chloride (4:1 v/v) mixture. Seal and heat at 110°C for 1 hour. Dry completely under nitrogen. c. Reconstitution: Redissolve derivatized amino acids in 50 µL of ethyl acetate for GC-MS analysis.
- GC-MS Analysis: a. Inject 1 µL in split or splitless mode (as optimized). b. Use a mid-polarity column (e.g., DB-35MS) for optimal separation. c. Operate MS in Electron Impact (EI) mode at 70 eV. d. Acquire data in Selected Ion Monitoring (SIM) mode targeting specific mass fragments for unlabeled (M+0) and ¹³C-labeled (M+1, M+2, etc.) isotopologues of each amino acid derivative.
Data Deposition: Repository Submission Protocol
Primary data (raw instrument files, processed isotopologue distributions) must be submitted to public repositories.
Table 2: Recommended Repositories for ¹³C-Amino Acid Data
| Repository Name | Data Type to Deposit | Submission Format | Unique Identifier |
|---|---|---|---|
| Metabolomics Workbench (NIH) | Processed isotopologue distributions, experimental metadata | ISA-Tab format via the Project Dashboard | Study ID (e.g., ST002345) |
| MetaboLights (EMBL-EBI) | Raw GC-MS data (.D folders, .ms files), peak tables | MTBLS submission tool | Accession (e.g., MTBLS8765) |
| NCBI SRA (if applicable) | Raw genomic/transcriptomic data from the same study | FASTQ files, SRA metadata spreadsheet | BioProject ID (e.g., PRJNA789012) |
Submission Workflow:
- Select Repository: Choose based on data type (MetaboLights for raw GC-MS).
- Prepare Metadata: Complete all required fields in the repository's template.
- Format Data: Convert raw files to accepted formats (e.g., .mzML for mass spectrometry).
- Upload: Use the repository's secure upload portal or Aspera client for large datasets.
- Validate: Allow repository checks for completeness and format.
- Publish: Obtain the persistent accession number for citation.
The Scientist's Toolkit: Essential Research Reagent Solutions
Table 3: Key Reagents and Materials for ¹³C-GC-MS Protein Amino Acid Analysis
| Item | Function & Critical Specification |
|---|---|
| Constant Boiling 6M HCl | Hydrolyzes peptide bonds to free amino acids. Must be oxygen-free and contain <0.0002% phenol to prevent oxidation of Met, Tyr, Cys. |
| U-¹³C-Algal Amino Acid Mix | Isotopic internal standard for quantification and correction of instrumental drift. Used to create calibration curves. |
| N-Propanol (Anhydrous) | Derivatization reagent for esterification. Anhydrous grade prevents unwanted side reactions. |
| Acetyl Chloride | Catalyst for esterification and donor of acetyl group for acylation. Handle in fume hood. |
| DB-35MS or equivalent GC column | (35%-Phenyl)-methylpolysiloxane column provides optimal separation for derivatized polar molecules like amino acids. |
| Perfluorotributylamine (PFTBA) | MS calibration and tuning standard for EI sources, ensures consistent mass accuracy and fragmentation patterns. |
Visualized Workflows and Pathways
Diagram 1: Experimental & Data Submission Workflow
Diagram 2: ¹³C-Labeling Pathway to GC-MS Analysis
Conclusion
GC-MS analysis of 13C patterns in protein-bound amino acids remains a cornerstone technique for stable isotope-resolved metabolomics, offering a robust, accessible, and highly informative window into cellular metabolic activity. By mastering the foundational concepts, meticulous methodology, and troubleshooting strategies outlined, researchers can reliably extract quantitative flux data critical for understanding disease mechanisms, identifying novel therapeutic targets, and assessing drug response. Future directions point toward integration with multi-omics datasets, single-cell applications with enhanced sensitivity, and the development of standardized, open-source computational pipelines for flux analysis, further solidifying this approach's role in advancing personalized medicine and metabolic research.